We’d like to continue our efforts from last week to update parameters in the protocol. There was little on-chain opposition to our proposal but we failed to reach quorum and will be re-proposing along with our next change, to lower the WBTC collateral factor. We also got some great feedback from the community that they wanted to see more data from our stress tests and analysis, which we’ve included below. Obviously, higher capital efficiency for WBTC is something users really wanted (as we saw from the support for the proposal) but we believe this creates an untenable risk in the protocol.
In our next proposal, we plan to change the collateral requirements for ZRX, BAT, and WBTC.
| Collateral | Current collateralFactor | Recommended collateralFactor |
|---|---|---|
| ZRX | .60 | .65 |
| BAT | .60 | .65 |
| WBTC | .75 | .60 |
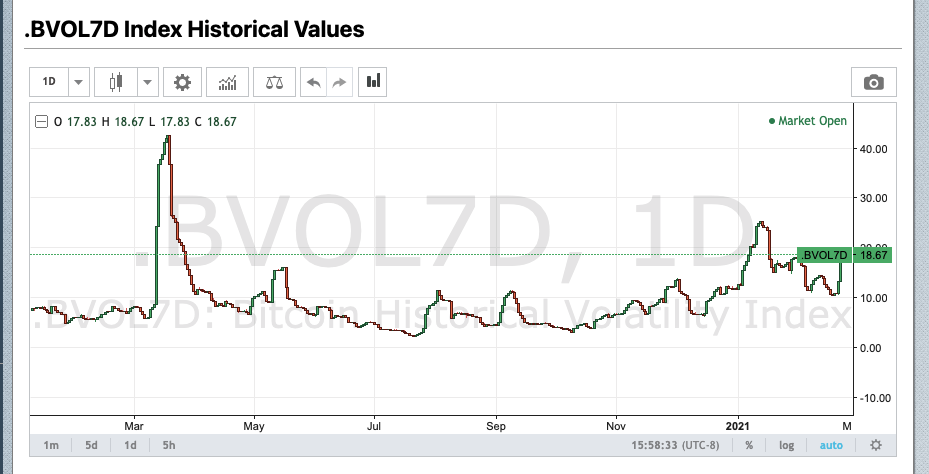
As we mentioned on Twitter recently, an increase in volatility for WBTC and the overall market has increased risk substantially across many defi protocols.
Currently, outside of the circular borrowing with DAI and USDC, much of the collateral on Compound is ETH and WBTC being used to borrow stables:

While there are similar levels of usage for both ETH and WBTC, ETH has much better liquidity, and poses less risk. On our dashboard, we track a few relevant statistics to collateral safety:

One of these, which is admittedly a bit hard to grok, is the liquidity ratio. This is the ratio of the Real Daily Volume of the asset to the total amount of that asset used as collateral on Compound. Right now, that ratio is 1:5, which means that if markets were to take a tumble, Compound could attempt to sell 5x the current daily volume for WBTC in as little as a few hours. Now many people would say this sounds difficult, but the only way to understand if this could be done safely is to either 1) try it or 2) simulate it. Since option one is financially infeasible, we chose to try option two.
We have run thousands of simulations across a wide variety of price trajectories, but with updated data since our last post. The tail risk of WBTC continues to increase. We’ll focus on the main output of the simulations, which is “Net Insolvent Value” per collateral type. This is highly dependent on price volatility, which we vary across the x-axis below. A “Volatility Scalar” of 1 means that the stress tests used price paths that matched the historical volatility of each asset, a scalar of 7 corresponds to price paths that are 7 times as volatile as recent asset prices. For reference, the historically bad volatility of March 12/13, 2020 corresponds to a scalar of about a 7. In the graphs below, we show two sets of sample simulation price trajectories so you can all have a clear idea of what this looks like.

You’ll notice that in the prices move together - this is because price trajectories are parameterized to match historical correlations. The expected loss to the protocol in an extreme market event has more than doubled since we first raised concerns:

This is due to adverse liquidations in the WBTC market. In our sim, you can see that the majority of protocol liquidations happen in the ETH and WBTC markets, but since ETH has so much better liquidity than WBTC, these do not contribute strongly to the risk of insolvency:

@sirokko recently asked how we estimate slippage for liquidators, and while we briefly touched on it here, I wanted to elaborate on that. We use Coinbase data to determine the order book structure, which fits the curve we use for slippage. We then scale that by a factor Real Volume / Coinbase Volume to create a curve that represents the entire market. The volume on Uniswap is included in this, however assuming x*y=k style slippage in the market is a very conservative assumption. In fact, we’ve tried this, and then the simulation sees insolvencies in even pretty normal (but bad) market conditions, and we know that not to be the case, so we continued to develop our model that fits and scales real order book data. One thing that we do consider here are gas fees. We add gas price and transaction delay implications by building gas distribution curves on three month trailing data, and use random samples in our liquidator logic. In addition, we fit expected transaction delay times to liquidation calls.
We plan to create another proposal through the governance contract later this week, once people have had a chance to provide feedback on these proposed changes.