[Gauntlet] Polygon Ecosystem Update: (2024-11-25 through 2024-12-01)
polygon USDC.e Comet
Gauntlet would like to provide the community with an update on the polygon USDC.e comet over the past week.
Simple Summary
-
USDC.e Borrows increased 3.08%, from $7.66M to $7.89M.
-
USDC.e Supply increased 5.68%, from $8.04M to $8.50M.
-
USDC.e utilization decreased 2.46%, from 95.19% to 92.85%.
-
The minimum USDC.e reserve growth was 6.70%, and the maximum was 13.19%. The average USDC.e reserve growth was 7.73%.
-
The comet accumulated $1.61K USDC.e reserves while distributing 3.33K COMP rewards for a weekly Net Protocol Profit of -1.72K.
Base Asset APR Trend
Reserve Analysis
COMP Rewards Analysis
| Chain |
CometRewards COMP token holdings |
Daily aggregate COMP token reward distributions |
Remaining days of rewards runway (not including existing claimable rewards) |
| polygon |
3.04K |
23.00 |
132.30 |
Collateral Asset Supply
This graph shows the total supply of all collateral assets over the past week.
To see updated statistics, please see the live version of this graph here.
Base Asset Borrows
This graph shows the total borrows of the base asset over the past week.
To see updated statistics, please see the live version of this graph here.
Utilization
This graph shows the utilization (borrow / supply) of the base asset over the past week.
Supply Cap Usage
This graph shows the supply cap usage (supply / supply cap) of all collateral assets over the past week.
polygon USDT Comet
Gauntlet would like to provide the community with an update on the polygon USDT comet over the past week.
Simple Summary
-
USDT Borrows increased 20.40%, from $3.44M to $4.15M.
-
USDT Supply increased 18.40%, from $3.78M to $4.47M.
-
USDT utilization increased 1.69%, from 91.18% to 92.72%.
-
The minimum USDT reserve growth was 6.70%, and the maximum was 13.26%. The average USDT reserve growth was 9.01%.
-
The comet accumulated $597.61 USDT reserves while distributing 3.64K COMP rewards for a weekly Net Protocol Profit of -3.04K.
Base Asset APR Trend
Reserve Analysis
COMP Rewards Analysis
| Chain |
CometRewards COMP token holdings |
Daily aggregate COMP token reward distributions |
Remaining days of rewards runway (not including existing claimable rewards) |
| polygon |
3.04K |
23.00 |
132.30 |
Collateral Asset Supply
This graph shows the total supply of all collateral assets over the past week.
To see updated statistics, please see the live version of this graph here.
Base Asset Borrows
This graph shows the total borrows of the base asset over the past week.
To see updated statistics, please see the live version of this graph here.
Utilization
This graph shows the utilization (borrow / supply) of the base asset over the past week.
Supply Cap Usage
This graph shows the supply cap usage (supply / supply cap) of all collateral assets over the past week.
1 Like
[Gauntlet] Polygon Ecosystem Update: (2024-12-02 through 2024-12-08)
polygon USDC.e Comet
Gauntlet would like to provide the community with an update on the polygon USDC.e comet over the past week.
Simple Summary
-
USDC.e Borrows decreased 4.95%, from $7.92M to $7.52M.
-
USDC.e Supply decreased 3.83%, from $8.50M to $8.18M.
-
USDC.e utilization decreased 1.16%, from 93.11% to 92.03%.
-
The minimum USDC.e reserve growth was 6.70%, and the maximum was 13.27%. The average USDC.e reserve growth was 9.10%.
-
The comet accumulated $1.30K USDC.e reserves while distributing 3.33K COMP rewards for a weekly Net Protocol Profit of -2.03K.
Base Asset APR Trend
Reserve Analysis
COMP Rewards Analysis
| Chain |
CometRewards COMP token holdings |
Daily aggregate COMP token reward distributions |
Remaining days of rewards runway (not including existing claimable rewards) |
| polygon |
2.59K |
23.00 |
112.60 |
Collateral Asset Supply
This graph shows the total supply of all collateral assets over the past week.
To see updated statistics, please see the live version of this graph here.
Base Asset Borrows
This graph shows the total borrows of the base asset over the past week.
To see updated statistics, please see the live version of this graph here.
Utilization
This graph shows the utilization (borrow / supply) of the base asset over the past week.
Supply Cap Usage
This graph shows the supply cap usage (supply / supply cap) of all collateral assets over the past week.
polygon USDT Comet
Gauntlet would like to provide the community with an update on the polygon USDT comet over the past week.
Simple Summary
-
USDT Borrows increased 5.60%, from $4.15M to $4.38M.
-
USDT Supply increased 19.92%, from $4.48M to $5.37M.
-
USDT utilization decreased 11.94%, from 92.62% to 81.56%.
-
The minimum USDT reserve growth was 6.70%, and the maximum was 13.25%. The average USDT reserve growth was 7.55%.
-
The comet accumulated $656.62 USDT reserves while distributing 3.64K COMP rewards for a weekly Net Protocol Profit of -2.98K.
Base Asset APR Trend
Reserve Analysis
COMP Rewards Analysis
| Chain |
CometRewards COMP token holdings |
Daily aggregate COMP token reward distributions |
Remaining days of rewards runway (not including existing claimable rewards) |
| polygon |
2.59K |
23.00 |
112.60 |
Collateral Asset Supply
This graph shows the total supply of all collateral assets over the past week.
To see updated statistics, please see the live version of this graph here.
Base Asset Borrows
This graph shows the total borrows of the base asset over the past week.
To see updated statistics, please see the live version of this graph here.
Utilization
This graph shows the utilization (borrow / supply) of the base asset over the past week.
Supply Cap Usage
This graph shows the supply cap usage (supply / supply cap) of all collateral assets over the past week.
1 Like
[Gauntlet] Polygon Ecosystem Update: (2024-12-09 through 2024-12-15)
polygon USDC.e Comet
Gauntlet would like to provide the community with an update on the polygon USDC.e comet over the past week.
Simple Summary
-
USDC.e Borrows increased 1.75%, from $7.52M to $7.66M.
-
USDC.e Supply decreased 4.87%, from $8.17M to $7.78M.
-
USDC.e utilization increased 6.96%, from 92.04% to 98.44%.
-
The minimum USDC.e reserve growth was 5.92%, and the maximum was 13.25%. The average USDC.e reserve growth was 9.03%.
-
The comet accumulated $737.17 USDC.e reserves while distributing 6.24K COMP rewards for a weekly Net Protocol Profit of -5.51K.
Base Asset APR Trend
Reserve Analysis
COMP Rewards Analysis
| Chain |
CometRewards COMP token holdings |
Daily aggregate COMP token reward distributions |
Remaining days of rewards runway (not including existing claimable rewards) |
| polygon |
2.44K |
23.00 |
106.10 |
Collateral Asset Supply
This graph shows the total supply of all collateral assets over the past week.
To see updated statistics, please see the live version of this graph here.
Base Asset Borrows
This graph shows the total borrows of the base asset over the past week.
To see updated statistics, please see the live version of this graph here.
Utilization
This graph shows the utilization (borrow / supply) of the base asset over the past week.
Supply Cap Usage
This graph shows the supply cap usage (supply / supply cap) of all collateral assets over the past week.
polygon USDT Comet
Gauntlet would like to provide the community with an update on the polygon USDT comet over the past week.
Simple Summary
-
USDT Borrows increased 25.90%, from $4.38M to $5.51M.
-
USDT Supply increased 12.23%, from $5.37M to $6.03M.
-
USDT utilization increased 12.18%, from 81.52% to 91.44%.
-
The minimum USDT reserve growth was 6.70%, and the maximum was 13.25%. The average USDT reserve growth was 9.76%.
-
The comet accumulated $617.95 USDT reserves while distributing 6.81K COMP rewards for a weekly Net Protocol Profit of -6.19K.
Base Asset APR Trend
Reserve Analysis
COMP Rewards Analysis
| Chain |
CometRewards COMP token holdings |
Daily aggregate COMP token reward distributions |
Remaining days of rewards runway (not including existing claimable rewards) |
| polygon |
2.44K |
23.00 |
106.10 |
Collateral Asset Supply
This graph shows the total supply of all collateral assets over the past week.
To see updated statistics, please see the live version of this graph here.
Base Asset Borrows
This graph shows the total borrows of the base asset over the past week.
To see updated statistics, please see the live version of this graph here.
Utilization
This graph shows the utilization (borrow / supply) of the base asset over the past week.
Supply Cap Usage
This graph shows the supply cap usage (supply / supply cap) of all collateral assets over the past week.
1 Like
[Gauntlet] Polygon Ecosystem Update: (2024-12-16 through 2024-12-22)
polygon USDC.e Comet
Gauntlet would like to provide the community with an update on the polygon USDC.e comet over the past week.
Simple Summary
-
USDC.e Borrows increased 1.45%, from $7.66M to $7.77M.
-
USDC.e Supply increased 4.61%, from $7.80M to $8.16M.
-
USDC.e utilization decreased 3.02%, from 98.14% to 95.17%.
-
The minimum USDC.e reserve growth was 6.70%, and the maximum was 13.27%. The average USDC.e reserve growth was 8.62%.
-
The comet accumulated $1.90K USDC.e reserves while distributing 6.84K COMP rewards for a weekly Net Protocol Profit of -4.95K.
Base Asset APR Trend
Reserve Analysis
COMP Rewards Analysis
| Chain |
CometRewards COMP token holdings |
Daily aggregate COMP token reward distributions |
Remaining days of rewards runway (not including existing claimable rewards) |
| polygon |
2.30K |
23.00 |
99.90 |
Collateral Asset Supply
This graph shows the total supply of all collateral assets over the past week.
To see updated statistics, please see the live version of this graph here.
Base Asset Borrows
This graph shows the total borrows of the base asset over the past week.
To see updated statistics, please see the live version of this graph here.
Utilization
This graph shows the utilization (borrow / supply) of the base asset over the past week.
Supply Cap Usage
This graph shows the supply cap usage (supply / supply cap) of all collateral assets over the past week.
polygon USDT Comet
Gauntlet would like to provide the community with an update on the polygon USDT comet over the past week.
Simple Summary
-
USDT Borrows increased 6.12%, from $5.51M to $5.85M.
-
USDT Supply has not changed, remaining at $6.03M.
-
USDT utilization increased 5.09%, from 91.43% to 96.08%.
-
The minimum USDT reserve growth was 6.70%, and the maximum was 12.91%. The average USDT reserve growth was 8.22%.
-
The comet accumulated $820.65 USDT reserves while distributing 7.46K COMP rewards for a weekly Net Protocol Profit of -6.64K.
Base Asset APR Trend
Reserve Analysis
COMP Rewards Analysis
| Chain |
CometRewards COMP token holdings |
Daily aggregate COMP token reward distributions |
Remaining days of rewards runway (not including existing claimable rewards) |
| polygon |
2.30K |
23.00 |
99.90 |
Collateral Asset Supply
This graph shows the total supply of all collateral assets over the past week.
To see updated statistics, please see the live version of this graph here.
Base Asset Borrows
This graph shows the total borrows of the base asset over the past week.
To see updated statistics, please see the live version of this graph here.
Utilization
This graph shows the utilization (borrow / supply) of the base asset over the past week.
Supply Cap Usage
This graph shows the supply cap usage (supply / supply cap) of all collateral assets over the past week.
1 Like
[Gauntlet] Polygon Ecosystem Update: (2024-12-23 through 2024-12-29)
polygon USDC.e Comet
Gauntlet would like to provide the community with an update on the polygon USDC.e comet over the past week.
Simple Summary
-
USDC.e Borrows decreased 2.92%, from $7.77M to $7.54M.
-
USDC.e Supply decreased 2.30%, from $8.21M to $8.02M.
-
USDC.e utilization did not change, remaining at 94.62%.
-
The minimum USDC.e reserve growth was 6.70%, and the maximum was 13.22%. The average USDC.e reserve growth was 10.35%.
-
The comet accumulated $986.28 USDC.e reserves while distributing 6.31K COMP rewards for a weekly Net Protocol Profit of -5.33K.
Base Asset APR Trend
Reserve Analysis
COMP Rewards Analysis
| Chain |
CometRewards COMP token holdings |
Daily aggregate COMP token reward distributions |
Remaining days of rewards runway (not including existing claimable rewards) |
| polygon |
2.19K |
23.00 |
95.20 |
Collateral Asset Supply
This graph shows the total supply of all collateral assets over the past week.
To see updated statistics, please see the live version of this graph here.
Base Asset Borrows
This graph shows the total borrows of the base asset over the past week.
To see updated statistics, please see the live version of this graph here.
Utilization
This graph shows the utilization (borrow / supply) of the base asset over the past week.
Supply Cap Usage
This graph shows the supply cap usage (supply / supply cap) of all collateral assets over the past week.
polygon USDT Comet
Gauntlet would like to provide the community with an update on the polygon USDT comet over the past week.
Simple Summary
-
USDT Borrows have not changed, remaining at $5.85M.
-
USDT Supply increased 7.37%, from $6.09M to $6.54M.
-
USDT utilization decreased 6.08%, from 96.05% to 90.21%.
-
The minimum USDT reserve growth was 6.80%, and the maximum was 13.23%. The average USDT reserve growth was 9.01%.
-
The comet accumulated $777.08 USDT reserves while distributing 6.89K COMP rewards for a weekly Net Protocol Profit of -6.11K.
Base Asset APR Trend
Reserve Analysis
COMP Rewards Analysis
| Chain |
CometRewards COMP token holdings |
Daily aggregate COMP token reward distributions |
Remaining days of rewards runway (not including existing claimable rewards) |
| polygon |
2.19K |
23.00 |
95.20 |
Collateral Asset Supply
This graph shows the total supply of all collateral assets over the past week.
To see updated statistics, please see the live version of this graph here.
Base Asset Borrows
This graph shows the total borrows of the base asset over the past week.
To see updated statistics, please see the live version of this graph here.
Utilization
This graph shows the utilization (borrow / supply) of the base asset over the past week.
Supply Cap Usage
This graph shows the supply cap usage (supply / supply cap) of all collateral assets over the past week.
1 Like
[Gauntlet] Polygon Ecosystem Update: (2024-12-30 through 2025-01-05)
polygon USDC.e Comet
Gauntlet would like to provide the community with an update on the polygon USDC.e comet over the past week.
Simple Summary
-
USDC.e Borrows decreased 2.40%, from $7.54M to $7.36M.
-
USDC.e Supply has not changed, remaining at $7.78M.
-
USDC.e utilization decreased 1.46%, from 96.90% to 95.49%.
-
The minimum USDC.e reserve growth was 6.70%, and the maximum was 13.25%. The average USDC.e reserve growth was 8.75%.
-
The comet accumulated $1.54K USDC.e reserves while distributing 6.17K COMP rewards for a weekly Net Protocol Profit of -4.63K.
Base Asset APR Trend
Reserve Analysis
COMP Rewards Analysis
| Chain |
CometRewards COMP token holdings |
Daily aggregate COMP token reward distributions |
Remaining days of rewards runway (not including existing claimable rewards) |
| polygon |
2.08K |
23.00 |
90.50 |
Collateral Asset Supply
This graph shows the total supply of all collateral assets over the past week.
To see updated statistics, please see the live version of this graph here.
Base Asset Borrows
This graph shows the total borrows of the base asset over the past week.
To see updated statistics, please see the live version of this graph here.
Utilization
This graph shows the utilization (borrow / supply) of the base asset over the past week.
Supply Cap Usage
This graph shows the supply cap usage (supply / supply cap) of all collateral assets over the past week.
polygon USDT Comet
Gauntlet would like to provide the community with an update on the polygon USDT comet over the past week.
Simple Summary
-
USDT Borrows decreased 13.29%, from $5.90M to $5.11M.
-
USDT Supply decreased 13.26%, from $6.49M to $5.63M.
-
USDT utilization did not change, remaining at 90.91%.
-
The minimum USDT reserve growth was 6.70%, and the maximum was 13.25%. The average USDT reserve growth was 9.99%.
-
The comet accumulated $672.82 USDT reserves while distributing 6.73K COMP rewards for a weekly Net Protocol Profit of -6.06K.
Base Asset APR Trend
Reserve Analysis
COMP Rewards Analysis
| Chain |
CometRewards COMP token holdings |
Daily aggregate COMP token reward distributions |
Remaining days of rewards runway (not including existing claimable rewards) |
| polygon |
2.08K |
23.00 |
90.50 |
Collateral Asset Supply
This graph shows the total supply of all collateral assets over the past week.
To see updated statistics, please see the live version of this graph here.
Base Asset Borrows
This graph shows the total borrows of the base asset over the past week.
To see updated statistics, please see the live version of this graph here.
Utilization
This graph shows the utilization (borrow / supply) of the base asset over the past week.
Supply Cap Usage
This graph shows the supply cap usage (supply / supply cap) of all collateral assets over the past week.
1 Like
[Gauntlet] Polygon Ecosystem Update: (2025-01-06 through 2025-01-12)
polygon USDC.e Comet
Gauntlet would like to provide the community with an update on the polygon USDC.e comet over the past week.
Simple Summary
-
USDC.e Borrows increased 1.67%, from $7.36M to $7.48M.
-
USDC.e Supply has not changed, remaining at $7.73M.
-
USDC.e utilization increased 1.06%, from 95.27% to 96.28%.
-
The minimum USDC.e reserve growth was 6.70%, and the maximum was 13.24%. The average USDC.e reserve growth was 9.46%.
-
The comet accumulated $1.45K USDC.e reserves while distributing 5.93K COMP rewards for a weekly Net Protocol Profit of -4.48K.
Base Asset APR Trend
Reserve Analysis
COMP Rewards Analysis
| Chain |
CometRewards COMP token holdings |
Daily aggregate COMP token reward distributions |
Remaining days of rewards runway (not including existing claimable rewards) |
| polygon |
1.99K |
23.00 |
86.70 |
Collateral Asset Supply
This graph shows the total supply of all collateral assets over the past week.
To see updated statistics, please see the live version of this graph here.
Base Asset Borrows
This graph shows the total borrows of the base asset over the past week.
To see updated statistics, please see the live version of this graph here.
Utilization
This graph shows the utilization (borrow / supply) of the base asset over the past week.
Supply Cap Usage
This graph shows the supply cap usage (supply / supply cap) of all collateral assets over the past week.
polygon USDT Comet
Gauntlet would like to provide the community with an update on the polygon USDT comet over the past week.
Simple Summary
-
USDT Borrows have not changed, remaining at $5.11M.
-
USDT Supply increased 1.18%, from $5.63M to $5.69M.
-
USDT utilization did not change, remaining at 90.86%.
-
The minimum USDT reserve growth was 6.77%, and the maximum was 13.25%. The average USDT reserve growth was 9.54%.
-
The comet accumulated $628.13 USDT reserves while distributing 6.47K COMP rewards for a weekly Net Protocol Profit of -5.84K.
Base Asset APR Trend
Reserve Analysis
COMP Rewards Analysis
| Chain |
CometRewards COMP token holdings |
Daily aggregate COMP token reward distributions |
Remaining days of rewards runway (not including existing claimable rewards) |
| polygon |
1.99K |
23.00 |
86.70 |
Collateral Asset Supply
This graph shows the total supply of all collateral assets over the past week.
To see updated statistics, please see the live version of this graph here.
Base Asset Borrows
This graph shows the total borrows of the base asset over the past week.
To see updated statistics, please see the live version of this graph here.
Utilization
This graph shows the utilization (borrow / supply) of the base asset over the past week.
Supply Cap Usage
This graph shows the supply cap usage (supply / supply cap) of all collateral assets over the past week.
1 Like
[Gauntlet] Polygon Ecosystem Update: (2025-01-13 through 2025-01-19)
polygon USDC.e Comet
Gauntlet would like to provide the community with an update on the polygon USDC.e comet over the past week.
Simple Summary
-
USDC.e Borrows have not changed, remaining at $7.48M.
-
USDC.e Supply decreased 2.83%, from $7.88M to $7.66M.
-
USDC.e utilization increased 2.44%, from 94.96% to 97.27%.
-
The minimum USDC.e reserve growth was 6.70%, and the maximum was 13.07%. The average USDC.e reserve growth was 7.61%.
-
The comet accumulated $1.41K USDC.e reserves while distributing 6.24K COMP rewards for a weekly Net Protocol Profit of -4.83K.
Base Asset APR Trend
Reserve Analysis
COMP Rewards Analysis
| Chain |
CometRewards COMP token holdings |
Daily aggregate COMP token reward distributions |
Remaining days of rewards runway (not including existing claimable rewards) |
| polygon |
1.91K |
23.00 |
82.90 |
Collateral Asset Supply
This graph shows the total supply of all collateral assets over the past week.
To see updated statistics, please see the live version of this graph here.
Base Asset Borrows
This graph shows the total borrows of the base asset over the past week.
To see updated statistics, please see the live version of this graph here.
Utilization
This graph shows the utilization (borrow / supply) of the base asset over the past week.
Supply Cap Usage
This graph shows the supply cap usage (supply / supply cap) of all collateral assets over the past week.
polygon USDT Comet
Gauntlet would like to provide the community with an update on the polygon USDT comet over the past week.
Simple Summary
-
USDT Borrows increased 3.78%, from $5.16M to $5.35M.
-
USDT Supply increased 2.59%, from $5.69M to $5.84M.
-
USDT utilization increased 1.16%, from 90.56% to 91.61%.
-
The minimum USDT reserve growth was 6.78%, and the maximum was 13.25%. The average USDT reserve growth was 9.94%.
-
The comet accumulated $666.04 USDT reserves while distributing 6.81K COMP rewards for a weekly Net Protocol Profit of -6.14K.
Base Asset APR Trend
Reserve Analysis
COMP Rewards Analysis
| Chain |
CometRewards COMP token holdings |
Daily aggregate COMP token reward distributions |
Remaining days of rewards runway (not including existing claimable rewards) |
| polygon |
1.91K |
23.00 |
82.90 |
Collateral Asset Supply
This graph shows the total supply of all collateral assets over the past week.
To see updated statistics, please see the live version of this graph here.
Base Asset Borrows
This graph shows the total borrows of the base asset over the past week.
To see updated statistics, please see the live version of this graph here.
Utilization
This graph shows the utilization (borrow / supply) of the base asset over the past week.
Supply Cap Usage
This graph shows the supply cap usage (supply / supply cap) of all collateral assets over the past week.
1 Like
[Gauntlet] Polygon Ecosystem Update: (2025-01-20 through 2025-01-26)
polygon USDC.e Comet
Gauntlet would like to provide the community with an update on the polygon USDC.e comet over the past week.
Simple Summary
-
USDC.e Borrows increased 2.37%, from $7.40M to $7.58M.
-
USDC.e Supply has not changed, remaining at $7.71M.
-
USDC.e utilization increased 1.43%, from 96.05% to 97.42%.
-
The minimum USDC.e reserve growth was 6.72%, and the maximum was 12.93%. The average USDC.e reserve growth was 9.31%.
-
The comet accumulated $1.18K USDC.e reserves while distributing 5.94K COMP rewards for a weekly Net Protocol Profit of -4.75K.
Base Asset APR Trend
Reserve Analysis
COMP Rewards Analysis
| Chain |
CometRewards COMP token holdings |
Daily aggregate COMP token reward distributions |
Remaining days of rewards runway (not including existing claimable rewards) |
| polygon |
1.77K |
23.00 |
76.80 |
Collateral Asset Supply
This graph shows the total supply of all collateral assets over the past week.
To see updated statistics, please see the live version of this graph here.
Base Asset Borrows
This graph shows the total borrows of the base asset over the past week.
To see updated statistics, please see the live version of this graph here.
Utilization
This graph shows the utilization (borrow / supply) of the base asset over the past week.
Supply Cap Usage
This graph shows the supply cap usage (supply / supply cap) of all collateral assets over the past week.
polygon USDT Comet
Gauntlet would like to provide the community with an update on the polygon USDT comet over the past week.
Simple Summary
-
USDT Borrows increased 6.19%, from $5.35M to $5.68M.
-
USDT Supply increased 8.18%, from $5.83M to $6.31M.
-
USDT utilization decreased 1.84%, from 91.79% to 90.10%.
-
The minimum USDT reserve growth was 6.70%, and the maximum was 13.25%. The average USDT reserve growth was 9.59%.
-
The comet accumulated $845.61 USDT reserves while distributing 6.47K COMP rewards for a weekly Net Protocol Profit of -5.63K.
Base Asset APR Trend
Reserve Analysis
COMP Rewards Analysis
| Chain |
CometRewards COMP token holdings |
Daily aggregate COMP token reward distributions |
Remaining days of rewards runway (not including existing claimable rewards) |
| polygon |
1.77K |
23.00 |
76.80 |
Collateral Asset Supply
This graph shows the total supply of all collateral assets over the past week.
To see updated statistics, please see the live version of this graph here.
Base Asset Borrows
This graph shows the total borrows of the base asset over the past week.
To see updated statistics, please see the live version of this graph here.
Utilization
This graph shows the utilization (borrow / supply) of the base asset over the past week.
Supply Cap Usage
This graph shows the supply cap usage (supply / supply cap) of all collateral assets over the past week.
1 Like
[Gauntlet] Polygon Ecosystem Update: (2025-01-27 through 2025-02-02)
polygon USDC.e Comet
Gauntlet would like to provide the community with an update on the polygon USDC.e comet over the past week.
Simple Summary
-
USDC.e Borrows decreased 10.67%, from $7.58M to $6.77M.
-
USDC.e Supply increased 7.41%, from $7.77M to $8.35M.
-
USDC.e utilization decreased 16.83%, from 97.47% to 81.07%.
-
The minimum USDC.e reserve growth was 0.97%, and the maximum was 12.95%. The average USDC.e reserve growth was 5.36%.
-
The comet accumulated $408.21 USDC.e reserves while distributing 5.15K COMP rewards for a weekly Net Protocol Profit of -4.74K.
Base Asset APR Trend
Reserve Analysis
COMP Rewards Analysis
| Chain |
CometRewards COMP token holdings |
Daily aggregate COMP token reward distributions |
Remaining days of rewards runway (not including existing claimable rewards) |
| polygon |
1.64K |
23.00 |
71.40 |
Collateral Asset Supply
This graph shows the total supply of all collateral assets over the past week.
To see updated statistics, please see the live version of this graph here.
Base Asset Borrows
This graph shows the total borrows of the base asset over the past week.
To see updated statistics, please see the live version of this graph here.
Utilization
This graph shows the utilization (borrow / supply) of the base asset over the past week.
Supply Cap Usage
This graph shows the supply cap usage (supply / supply cap) of all collateral assets over the past week.
polygon USDT Comet
Gauntlet would like to provide the community with an update on the polygon USDT comet over the past week.
Simple Summary
-
USDT Borrows increased 3.11%, from $5.68M to $5.86M.
-
USDT Supply decreased 3.49%, from $6.31M to $6.09M.
-
USDT utilization increased 6.84%, from 90.12% to 96.28%.
-
The minimum USDT reserve growth was 6.16%, and the maximum was 13.22%. The average USDT reserve growth was 8.87%.
-
The comet accumulated $812.78 USDT reserves while distributing 5.62K COMP rewards for a weekly Net Protocol Profit of -4.80K.
Base Asset APR Trend
Reserve Analysis
COMP Rewards Analysis
| Chain |
CometRewards COMP token holdings |
Daily aggregate COMP token reward distributions |
Remaining days of rewards runway (not including existing claimable rewards) |
| polygon |
1.64K |
23.00 |
71.40 |
Collateral Asset Supply
This graph shows the total supply of all collateral assets over the past week.
To see updated statistics, please see the live version of this graph here.
Base Asset Borrows
This graph shows the total borrows of the base asset over the past week.
To see updated statistics, please see the live version of this graph here.
Utilization
This graph shows the utilization (borrow / supply) of the base asset over the past week.
Supply Cap Usage
This graph shows the supply cap usage (supply / supply cap) of all collateral assets over the past week.
1 Like
[Gauntlet] Polygon Ecosystem Update: (2025-02-03 through 2025-02-09)
polygon USDC.e Comet
Gauntlet would like to provide the community with an update on the polygon USDC.e comet over the past week.
Simple Summary
-
USDC.e Borrows decreased 6.26%, from $6.77M to $6.35M.
-
USDC.e Supply decreased 4.96%, from $8.35M to $7.94M.
-
USDC.e utilization decreased 1.37%, from 81.06% to 79.96%.
-
The minimum USDC.e reserve growth was -8.42%, and the maximum was 6.97%. The average USDC.e reserve growth was -4.09%.
-
The comet accumulated $-252.78 USDC.e reserves while distributing 3.97K COMP rewards for a weekly Net Protocol Profit of -4.23K.
Base Asset APR Trend
Reserve Analysis
COMP Rewards Analysis
| Chain |
CometRewards COMP token holdings |
Daily aggregate COMP token reward distributions |
Remaining days of rewards runway (not including existing claimable rewards) |
| polygon |
1.57K |
23.00 |
68.50 |
Collateral Asset Supply
This graph shows the total supply of all collateral assets over the past week.
To see updated statistics, please see the live version of this graph here.
Base Asset Borrows
This graph shows the total borrows of the base asset over the past week.
To see updated statistics, please see the live version of this graph here.
Utilization
This graph shows the utilization (borrow / supply) of the base asset over the past week.
Supply Cap Usage
This graph shows the supply cap usage (supply / supply cap) of all collateral assets over the past week.
polygon USDT Comet
Gauntlet would like to provide the community with an update on the polygon USDT comet over the past week.
Simple Summary
-
USDT Borrows have not changed, remaining at $5.85M.
-
USDT Supply increased 7.51%, from $6.21M to $6.68M.
-
USDT utilization decreased 6.33%, from 94.25% to 88.29%.
-
The minimum USDT reserve growth was 5.89%, and the maximum was 10.00%. The average USDT reserve growth was 8.43%.
-
The comet accumulated $619.65 USDT reserves while distributing 4.34K COMP rewards for a weekly Net Protocol Profit of -3.72K.
Base Asset APR Trend
Reserve Analysis
COMP Rewards Analysis
| Chain |
CometRewards COMP token holdings |
Daily aggregate COMP token reward distributions |
Remaining days of rewards runway (not including existing claimable rewards) |
| polygon |
1.57K |
23.00 |
68.50 |
Collateral Asset Supply
This graph shows the total supply of all collateral assets over the past week.
To see updated statistics, please see the live version of this graph here.
Base Asset Borrows
This graph shows the total borrows of the base asset over the past week.
To see updated statistics, please see the live version of this graph here.
Utilization
This graph shows the utilization (borrow / supply) of the base asset over the past week.
Supply Cap Usage
This graph shows the supply cap usage (supply / supply cap) of all collateral assets over the past week.
1 Like
[Gauntlet] Polygon Ecosystem Update: (2025-02-11 through 2025-02-17)
polygon USDC.e Comet
Gauntlet would like to provide the community with an update on the polygon USDC.e comet over the past week.
Simple Summary
-
USDC.e Borrows have not changed, remaining at $6.36M.
-
USDC.e Supply has not changed, remaining at $8.72M.
-
USDC.e utilization did not change, remaining at 72.90%.
-
The minimum USDC.e reserve growth was -6.57%, and the maximum was -0.84%. The average USDC.e reserve growth was -4.26%.
-
The comet accumulated $-266.91 USDC.e reserves while distributing 4.36K COMP rewards for a weekly Net Protocol Profit of -4.63K.
Base Asset APR Trend
Reserve Analysis
COMP Rewards Analysis
| Chain |
CometRewards COMP token holdings |
Daily aggregate COMP token reward distributions |
Remaining days of rewards runway (not including existing claimable rewards) |
| polygon |
1.43K |
23.00 |
62.10 |
Collateral Asset Supply
This graph shows the total supply of all collateral assets over the past week.
To see updated statistics, please see the live version of this graph here.
Base Asset Borrows
This graph shows the total borrows of the base asset over the past week.
To see updated statistics, please see the live version of this graph here.
Utilization
This graph shows the utilization (borrow / supply) of the base asset over the past week.
Supply Cap Usage
This graph shows the supply cap usage (supply / supply cap) of all collateral assets over the past week.
polygon USDT Comet
Gauntlet would like to provide the community with an update on the polygon USDT comet over the past week.
Simple Summary
-
USDT Borrows have not changed, remaining at $6.01M.
-
USDT Supply increased 5.25%, from $6.75M to $7.10M.
-
USDT utilization decreased 5.82%, from 89.07% to 83.89%.
-
The minimum USDT reserve growth was 3.70%, and the maximum was 9.98%. The average USDT reserve growth was 6.56%.
-
The comet accumulated $466.69 USDT reserves while distributing 4.76K COMP rewards for a weekly Net Protocol Profit of -4.29K.
Base Asset APR Trend
Reserve Analysis
COMP Rewards Analysis
| Chain |
CometRewards COMP token holdings |
Daily aggregate COMP token reward distributions |
Remaining days of rewards runway (not including existing claimable rewards) |
| polygon |
1.43K |
23.00 |
62.10 |
Collateral Asset Supply
This graph shows the total supply of all collateral assets over the past week.
To see updated statistics, please see the live version of this graph here.
Base Asset Borrows
This graph shows the total borrows of the base asset over the past week.
To see updated statistics, please see the live version of this graph here.
Utilization
This graph shows the utilization (borrow / supply) of the base asset over the past week.
Supply Cap Usage
This graph shows the supply cap usage (supply / supply cap) of all collateral assets over the past week.
1 Like
[Gauntlet] Polygon Ecosystem Update: (2025-02-17 through 2025-02-23)
polygon USDC.e Comet
Gauntlet would like to provide the community with an update on the polygon USDC.e comet over the past week.
Simple Summary
-
USDC.e Borrows have not changed, remaining at $6.35M.
-
USDC.e Supply has not changed, remaining at $8.73M.
-
USDC.e utilization decreased 1.21%, from 72.76% to 71.89%.
-
The minimum USDC.e reserve growth was -6.37%, and the maximum was 0.55%. The average USDC.e reserve growth was -4.74%.
-
The comet accumulated $-295.82 USDC.e reserves while distributing 4.22K COMP rewards for a weekly Net Protocol Profit of -4.51K.
Base Asset APR Trend
Reserve Analysis
COMP Rewards Analysis
| Chain |
CometRewards COMP token holdings |
Daily aggregate COMP token reward distributions |
Remaining days of rewards runway (not including existing claimable rewards) |
| polygon |
1.35K |
23.00 |
58.60 |
Collateral Asset Supply
This graph shows the total supply of all collateral assets over the past week.
To see updated statistics, please see the live version of this graph here.
Base Asset Borrows
This graph shows the total borrows of the base asset over the past week.
To see updated statistics, please see the live version of this graph here.
Utilization
This graph shows the utilization (borrow / supply) of the base asset over the past week.
Supply Cap Usage
This graph shows the supply cap usage (supply / supply cap) of all collateral assets over the past week.
polygon USDT Comet
Gauntlet would like to provide the community with an update on the polygon USDT comet over the past week.
Simple Summary
-
USDT Borrows increased 3.97%, from $5.96M to $6.19M.
-
USDT Supply has not changed, remaining at $6.97M.
-
USDT utilization increased 3.39%, from 85.41% to 88.30%.
-
The minimum USDT reserve growth was 2.96%, and the maximum was 9.97%. The average USDT reserve growth was 6.94%.
-
The comet accumulated $528.57 USDT reserves while distributing 4.60K COMP rewards for a weekly Net Protocol Profit of -4.07K.
Base Asset APR Trend
Reserve Analysis
COMP Rewards Analysis
| Chain |
CometRewards COMP token holdings |
Daily aggregate COMP token reward distributions |
Remaining days of rewards runway (not including existing claimable rewards) |
| polygon |
1.35K |
23.00 |
58.60 |
Collateral Asset Supply
This graph shows the total supply of all collateral assets over the past week.
To see updated statistics, please see the live version of this graph here.
Base Asset Borrows
This graph shows the total borrows of the base asset over the past week.
To see updated statistics, please see the live version of this graph here.
Utilization
This graph shows the utilization (borrow / supply) of the base asset over the past week.
Supply Cap Usage
This graph shows the supply cap usage (supply / supply cap) of all collateral assets over the past week.
1 Like
[Gauntlet] Polygon Ecosystem Update: (2025-02-24 through 2025-03-02)
polygon USDC.e Comet
Gauntlet would like to provide the community with an update on the polygon USDC.e comet over the past week.
Simple Summary
-
USDC.e Borrows decreased 8.69%, from $6.34M to $5.79M.
-
USDC.e Supply decreased 2.36%, from $8.83M to $8.62M.
-
USDC.e utilization decreased 6.49%, from 71.79% to 67.13%.
-
The minimum USDC.e reserve growth was -13.11%, and the maximum was -2.24%. The average USDC.e reserve growth was -9.78%.
-
The comet accumulated $-542.09 USDC.e reserves while distributing 3.96K COMP rewards for a weekly Net Protocol Profit of -4.50K.
Base Asset APR Trend
Reserve Analysis
COMP Rewards Analysis
| Chain |
CometRewards COMP token holdings |
Daily aggregate COMP token reward distributions |
Remaining days of rewards runway (not including existing claimable rewards) |
| polygon |
1.15K |
23.00 |
50.10 |
Collateral Asset Supply
This graph shows the total supply of all collateral assets over the past week.
To see updated statistics, please see the live version of this graph here.
Base Asset Borrows
This graph shows the total borrows of the base asset over the past week.
To see updated statistics, please see the live version of this graph here.
Utilization
This graph shows the utilization (borrow / supply) of the base asset over the past week.
Supply Cap Usage
This graph shows the supply cap usage (supply / supply cap) of all collateral assets over the past week.
polygon USDT Comet
Gauntlet would like to provide the community with an update on the polygon USDT comet over the past week.
Simple Summary
-
USDT Borrows decreased 3.47%, from $6.19M to $5.98M.
-
USDT Supply increased 5.08%, from $7.01M to $7.37M.
-
USDT utilization decreased 8.14%, from 88.30% to 81.11%.
-
The minimum USDT reserve growth was -0.51%, and the maximum was 9.99%. The average USDT reserve growth was 4.74%.
-
The comet accumulated $328.73 USDT reserves while distributing 4.32K COMP rewards for a weekly Net Protocol Profit of -3.99K.
Base Asset APR Trend
Reserve Analysis
COMP Rewards Analysis
| Chain |
CometRewards COMP token holdings |
Daily aggregate COMP token reward distributions |
Remaining days of rewards runway (not including existing claimable rewards) |
| polygon |
1.15K |
23.00 |
50.10 |
Collateral Asset Supply
This graph shows the total supply of all collateral assets over the past week.
To see updated statistics, please see the live version of this graph here.
Base Asset Borrows
This graph shows the total borrows of the base asset over the past week.
To see updated statistics, please see the live version of this graph here.
Utilization
This graph shows the utilization (borrow / supply) of the base asset over the past week.
Supply Cap Usage
This graph shows the supply cap usage (supply / supply cap) of all collateral assets over the past week.
[Gauntlet] Polygon Ecosystem Update: (2025-03-03 through 2025-03-09)
polygon USDC.e Comet
Gauntlet would like to provide the community with an update on the polygon USDC.e comet over the past week.
Simple Summary
-
USDC.e Borrows have not changed, remaining at $5.79M.
-
USDC.e Supply increased 11.11%, from $8.14M to $9.05M.
-
USDC.e utilization decreased 9.12%, from 71.03% to 64.56%.
-
The minimum USDC.e reserve growth was -14.51%, and the maximum was -6.69%. The average USDC.e reserve growth was -12.29%.
-
The comet accumulated $-658.13 USDC.e reserves while distributing 3.74K COMP rewards for a weekly Net Protocol Profit of -4.39K.
Base Asset APR Trend
Reserve Analysis
COMP Rewards Analysis
| Chain |
CometRewards COMP token holdings |
Daily aggregate COMP token reward distributions |
Remaining days of rewards runway (not including existing claimable rewards) |
| polygon |
1.05K |
23.00 |
45.60 |
Collateral Asset Supply
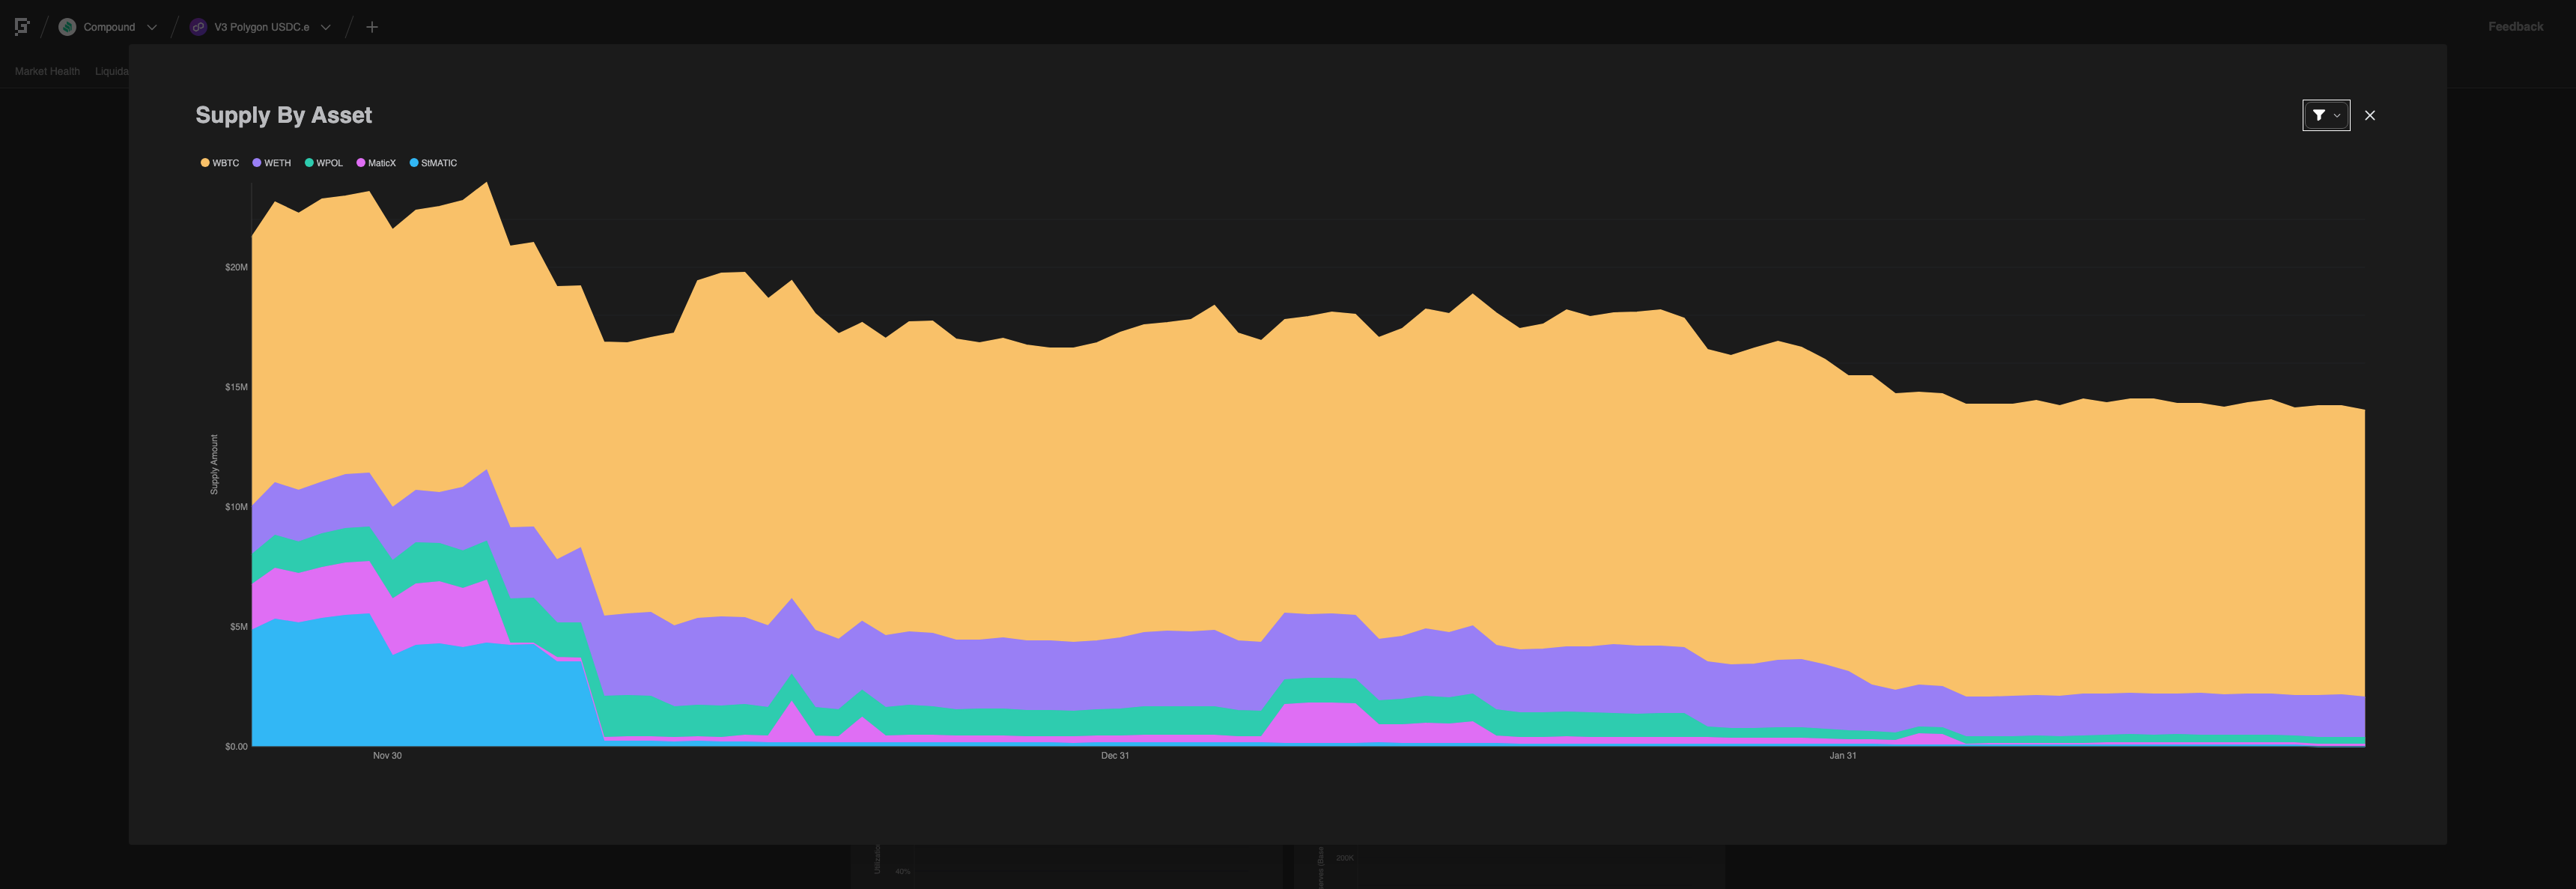
This graph shows the trend of total supply of all collateral assets.
To see updated statistics, please see the live version of this graph here.
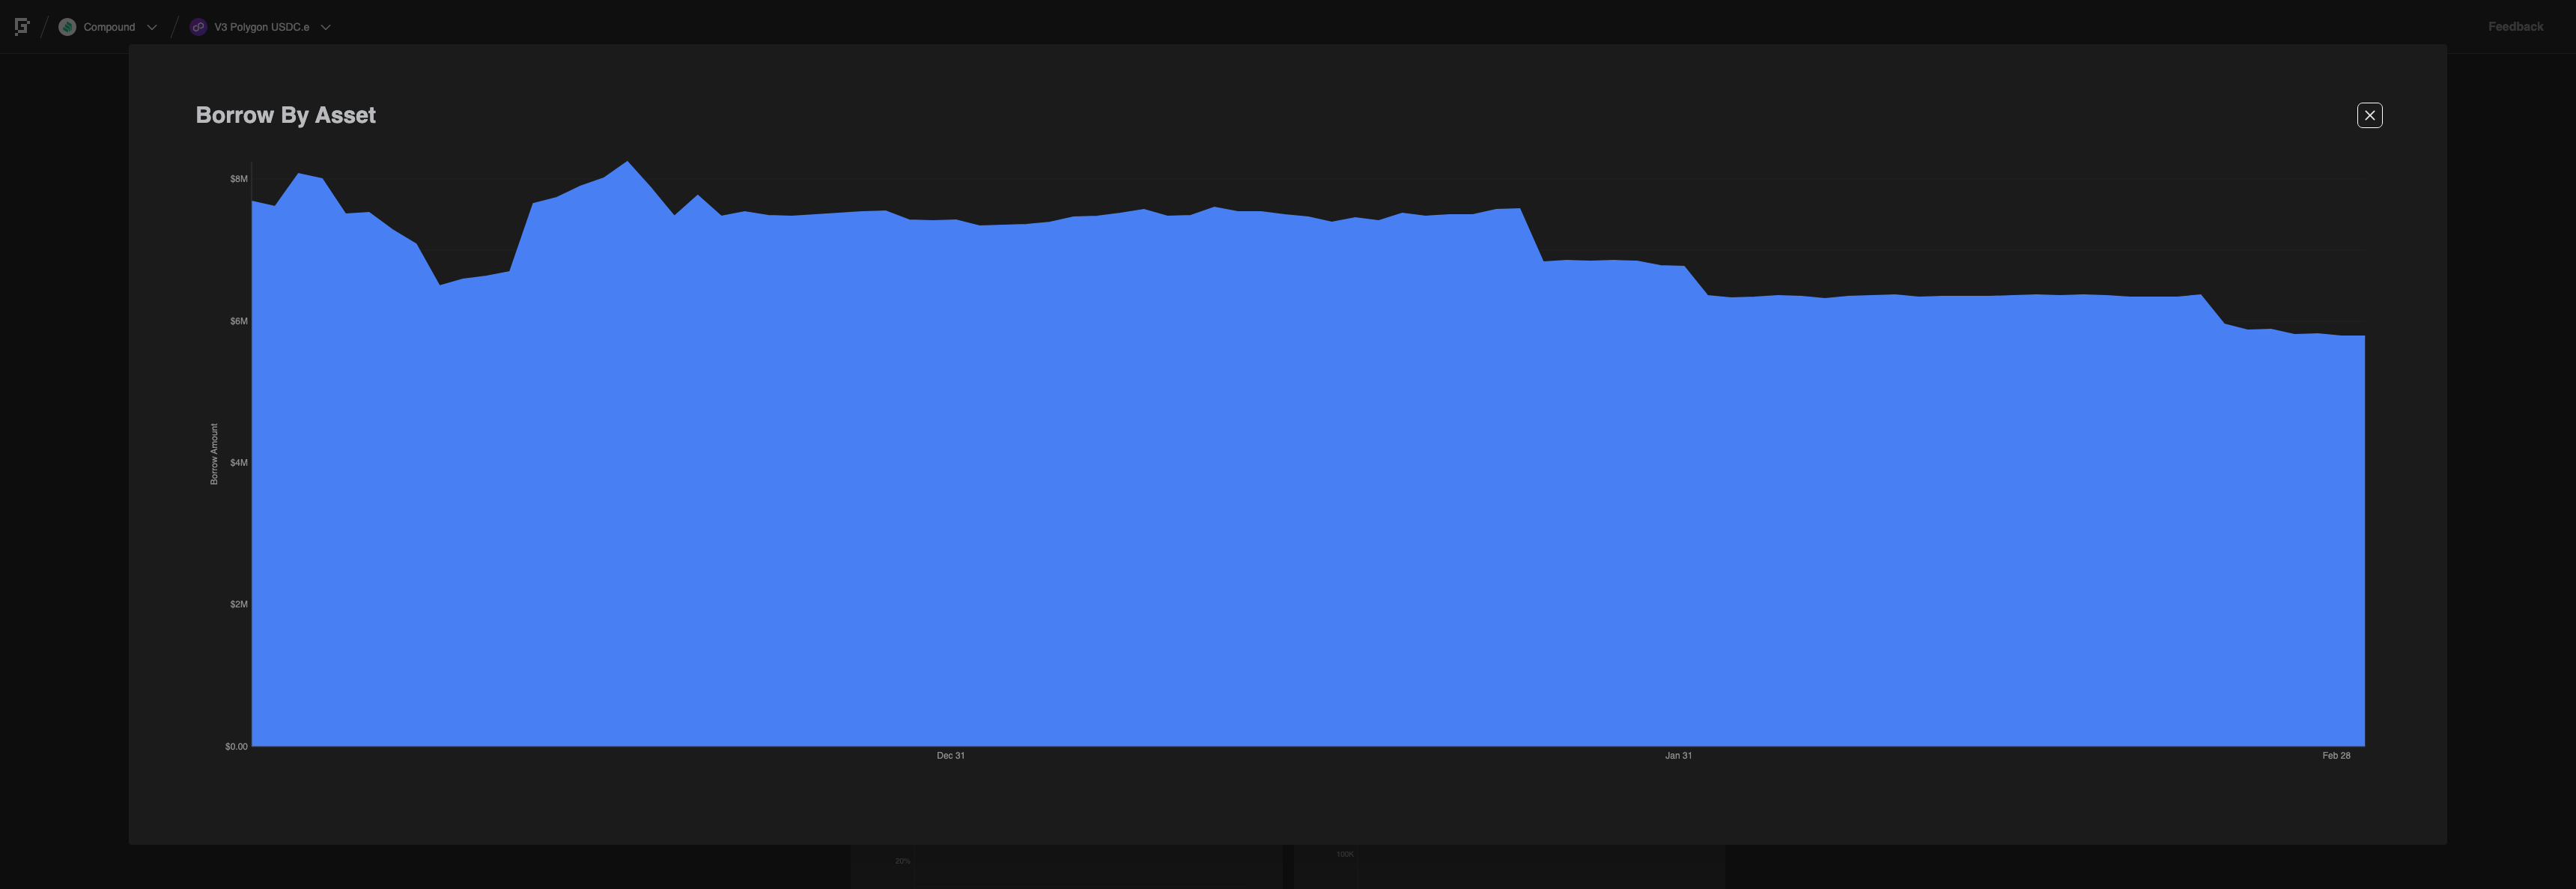
Base Asset Borrows
This graph shows the trend of total borrows of the base asset.
To see updated statistics, please see the live version of this graph here.
Utilization
This graph shows the utilization (borrow / supply) of the base asset over the past week.
Supply Cap Usage
This graph shows the supply cap usage (supply / supply cap) of all collateral assets over the past week.
polygon USDT Comet
Gauntlet would like to provide the community with an update on the polygon USDT comet over the past week.
Simple Summary
-
USDT Borrows decreased 2.14%, from $5.98M to $5.85M.
-
USDT Supply increased 4.87%, from $7.37M to $7.73M.
-
USDT utilization decreased 6.68%, from 81.11% to 75.69%.
-
The minimum USDT reserve growth was -4.38%, and the maximum was 3.23%. The average USDT reserve growth was -1.21%.
-
The comet accumulated $-68.84 USDT reserves while distributing 4.08K COMP rewards for a weekly Net Protocol Profit of -4.14K.
Base Asset APR Trend
Reserve Analysis
COMP Rewards Analysis
| Chain |
CometRewards COMP token holdings |
Daily aggregate COMP token reward distributions |
Remaining days of rewards runway (not including existing claimable rewards) |
| polygon |
1.05K |
23.00 |
45.60 |
Collateral Asset Supply
This graph shows the trend of total supply of all collateral assets.
To see updated statistics, please see the live version of this graph here.
Base Asset Borrows
This graph shows the trend of total borrows of the base asset.
To see updated statistics, please see the live version of this graph here.
Utilization
This graph shows the utilization (borrow / supply) of the base asset over the past week.
Supply Cap Usage
This graph shows the supply cap usage (supply / supply cap) of all collateral assets over the past week.