[Gauntlet] Weekly Market Update: (2025-03-10 through 2025-03-16)
Base Ecosystem Update
base USDC Comet
Simple Summary
-
USDC Borrows decreased 3.95%, from $16.03M to $15.40M.
-
USDC Supply increased 6.33%, from $20.21M to $21.49M.
-
USDC utilization decreased 9.67%, from 79.34% to 71.67%.
-
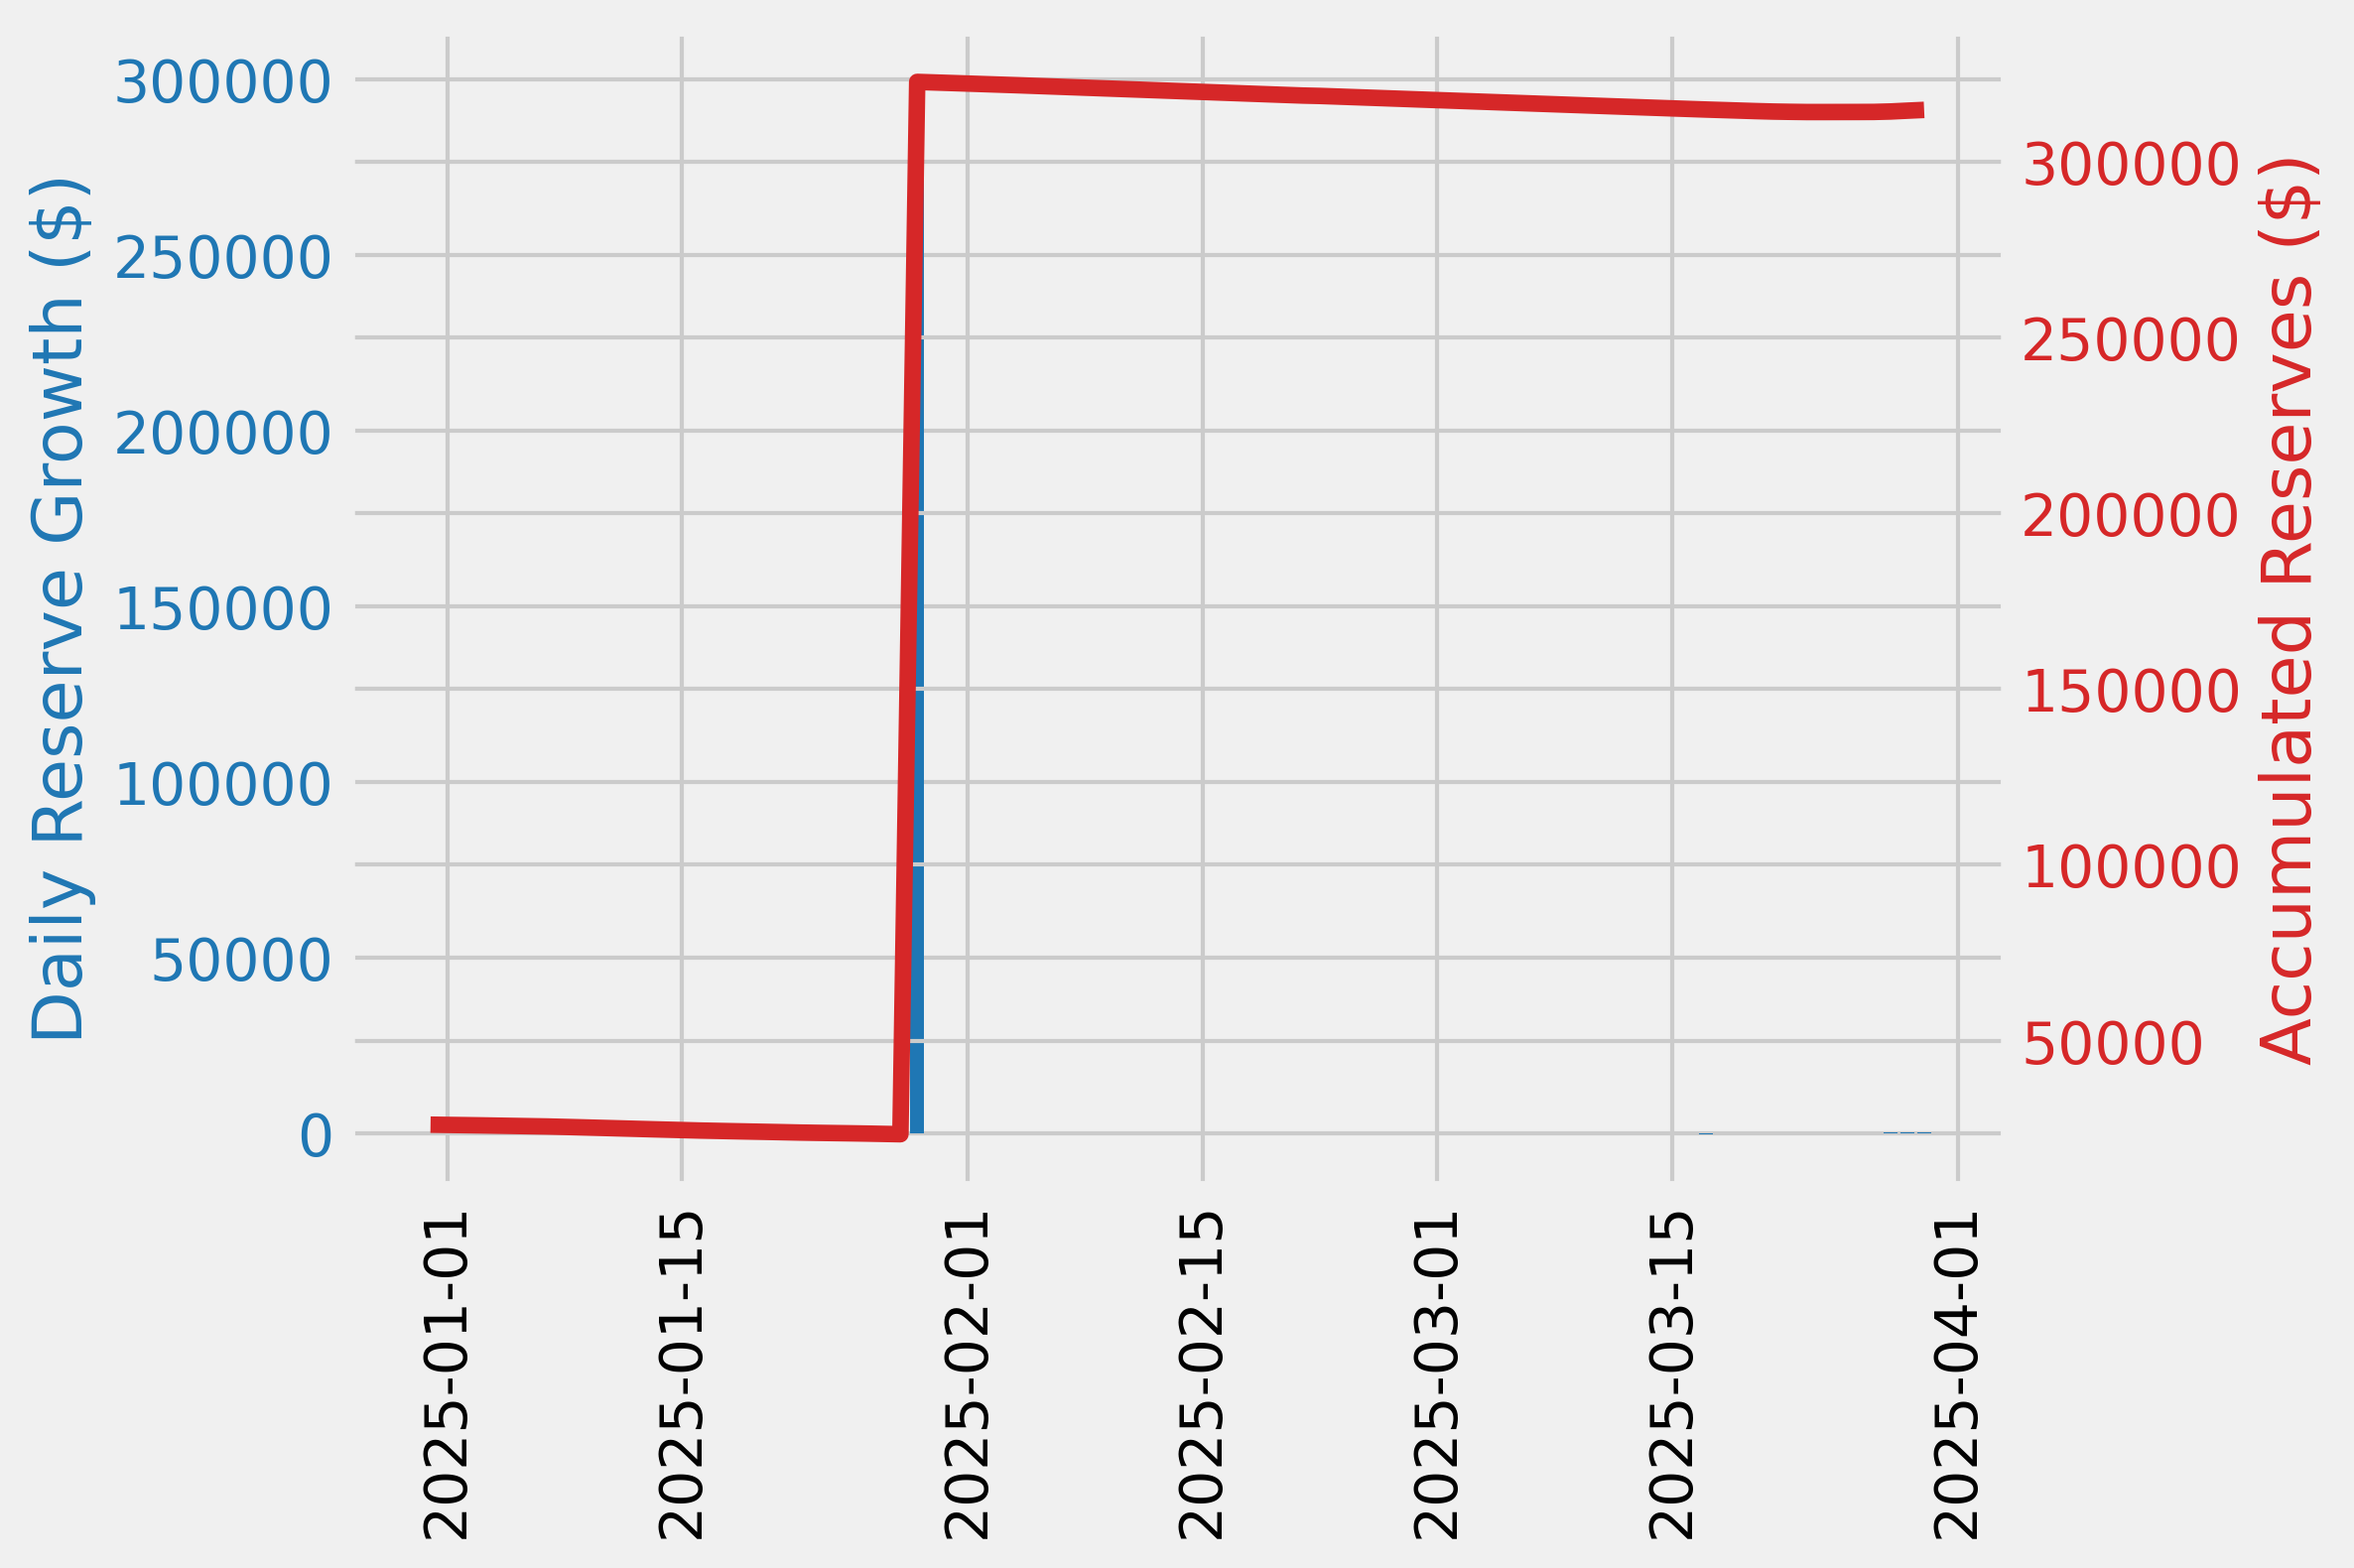
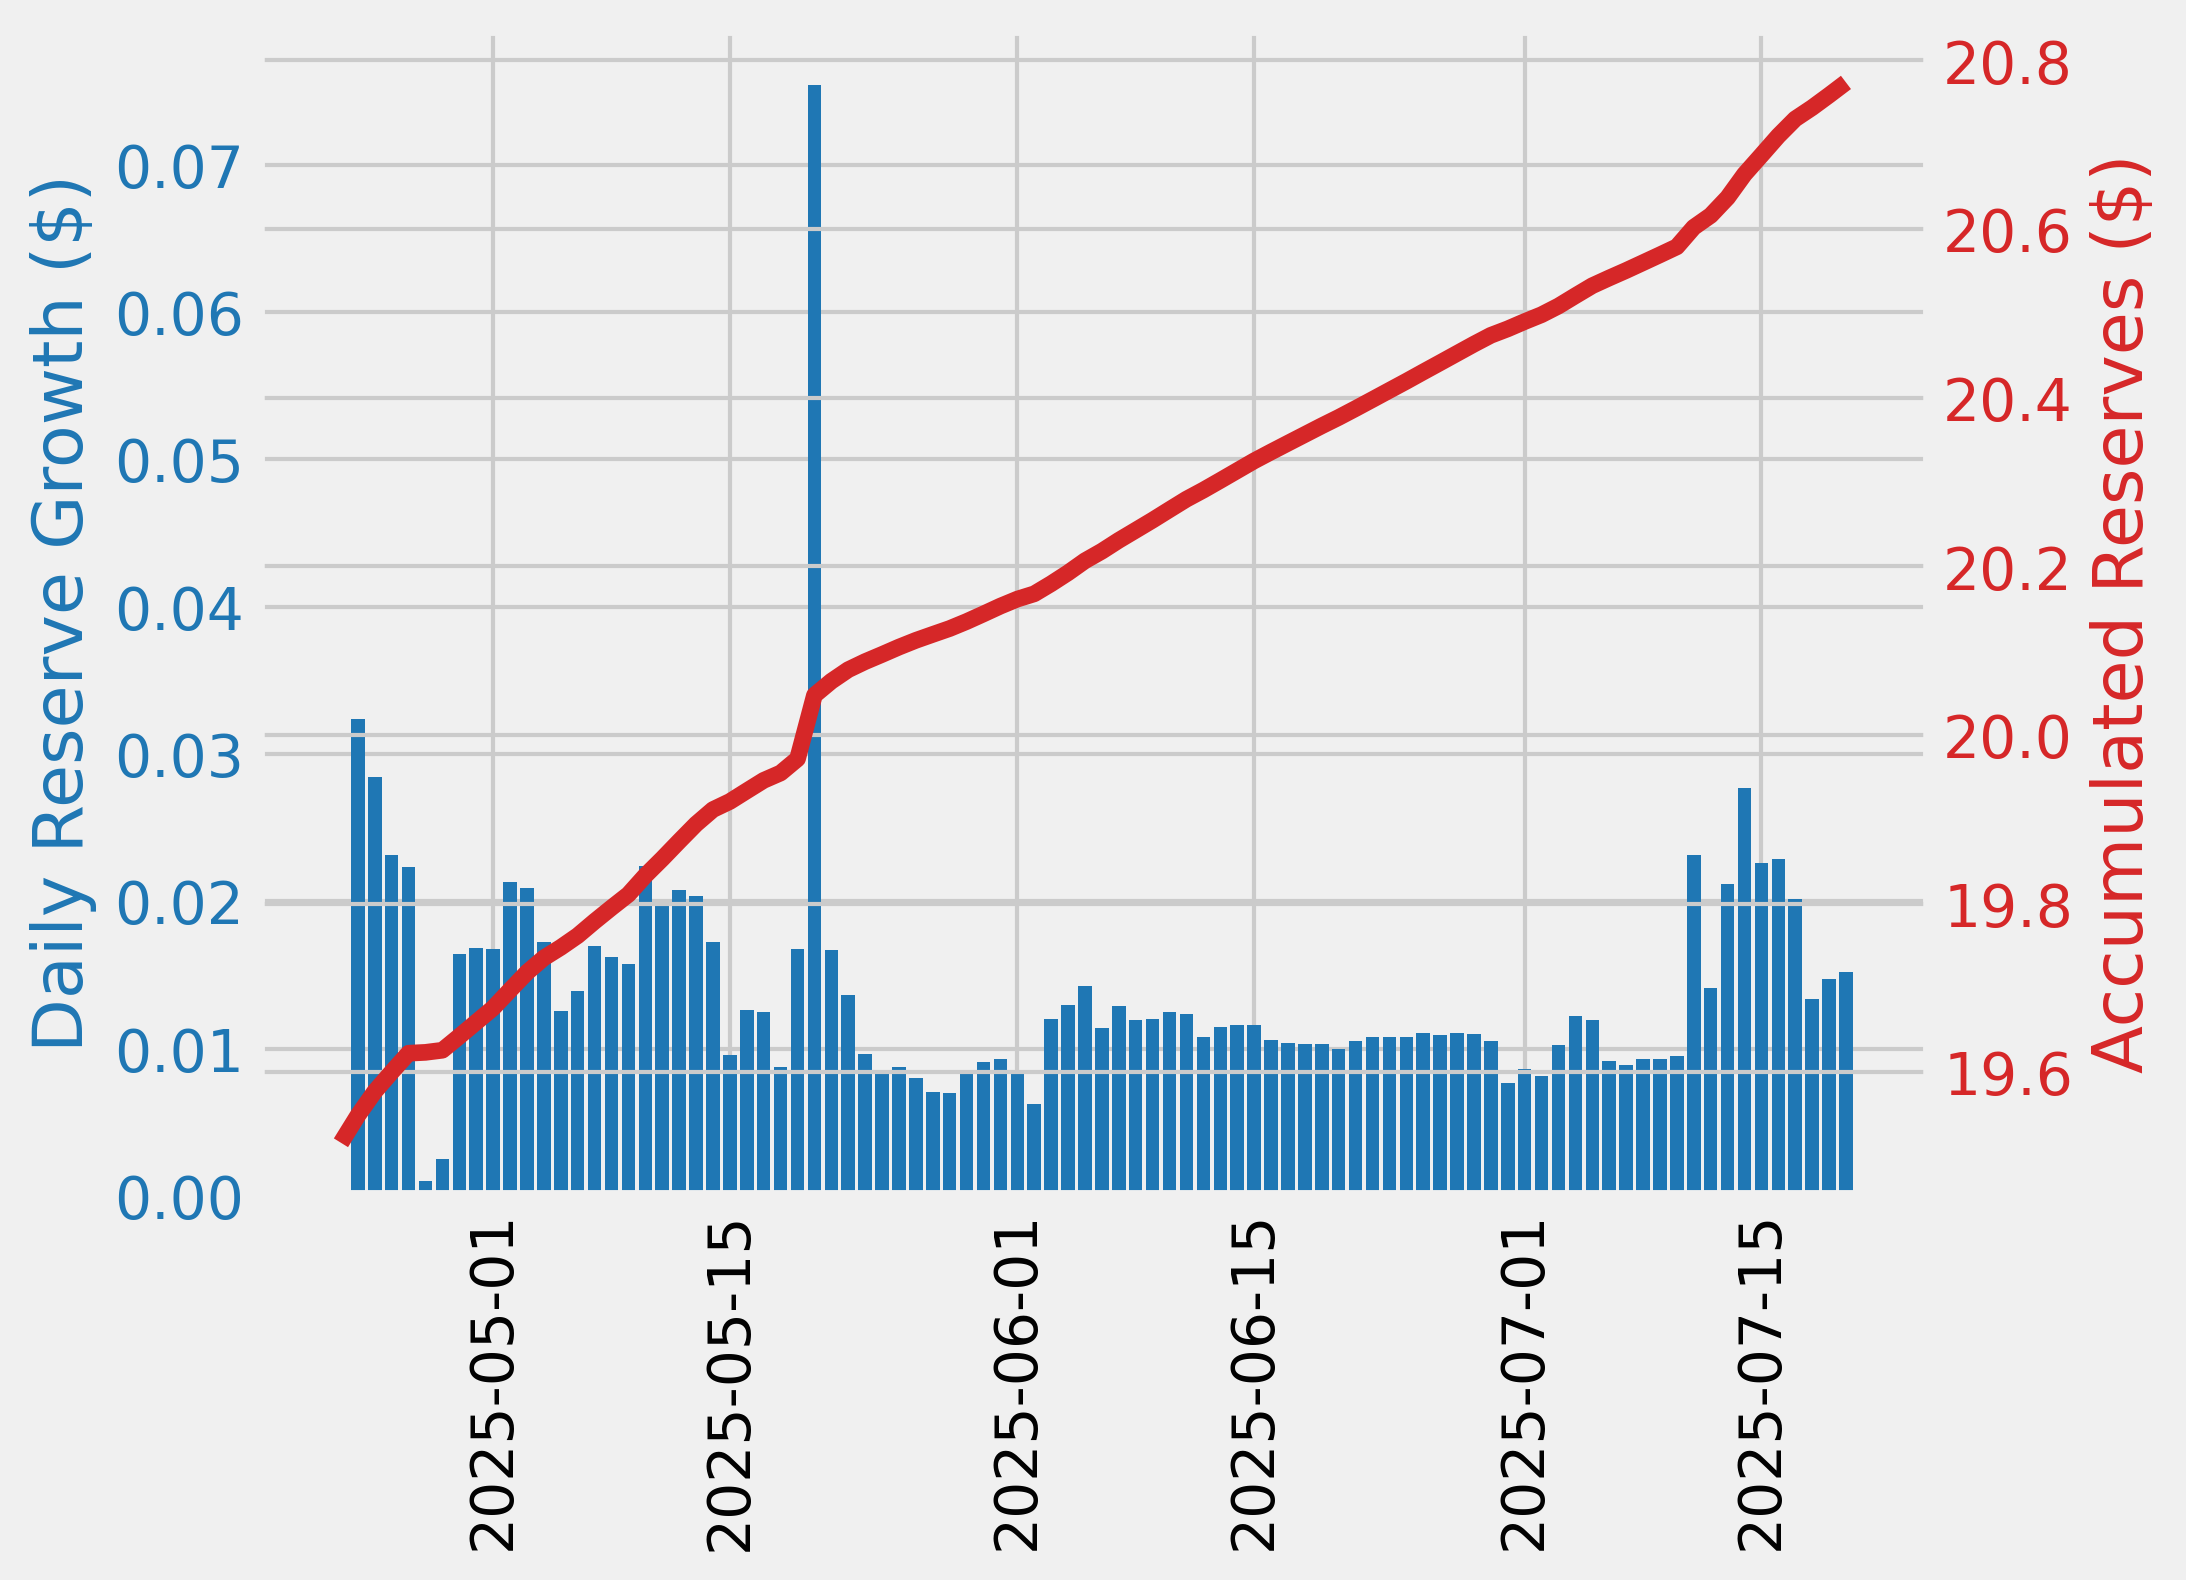
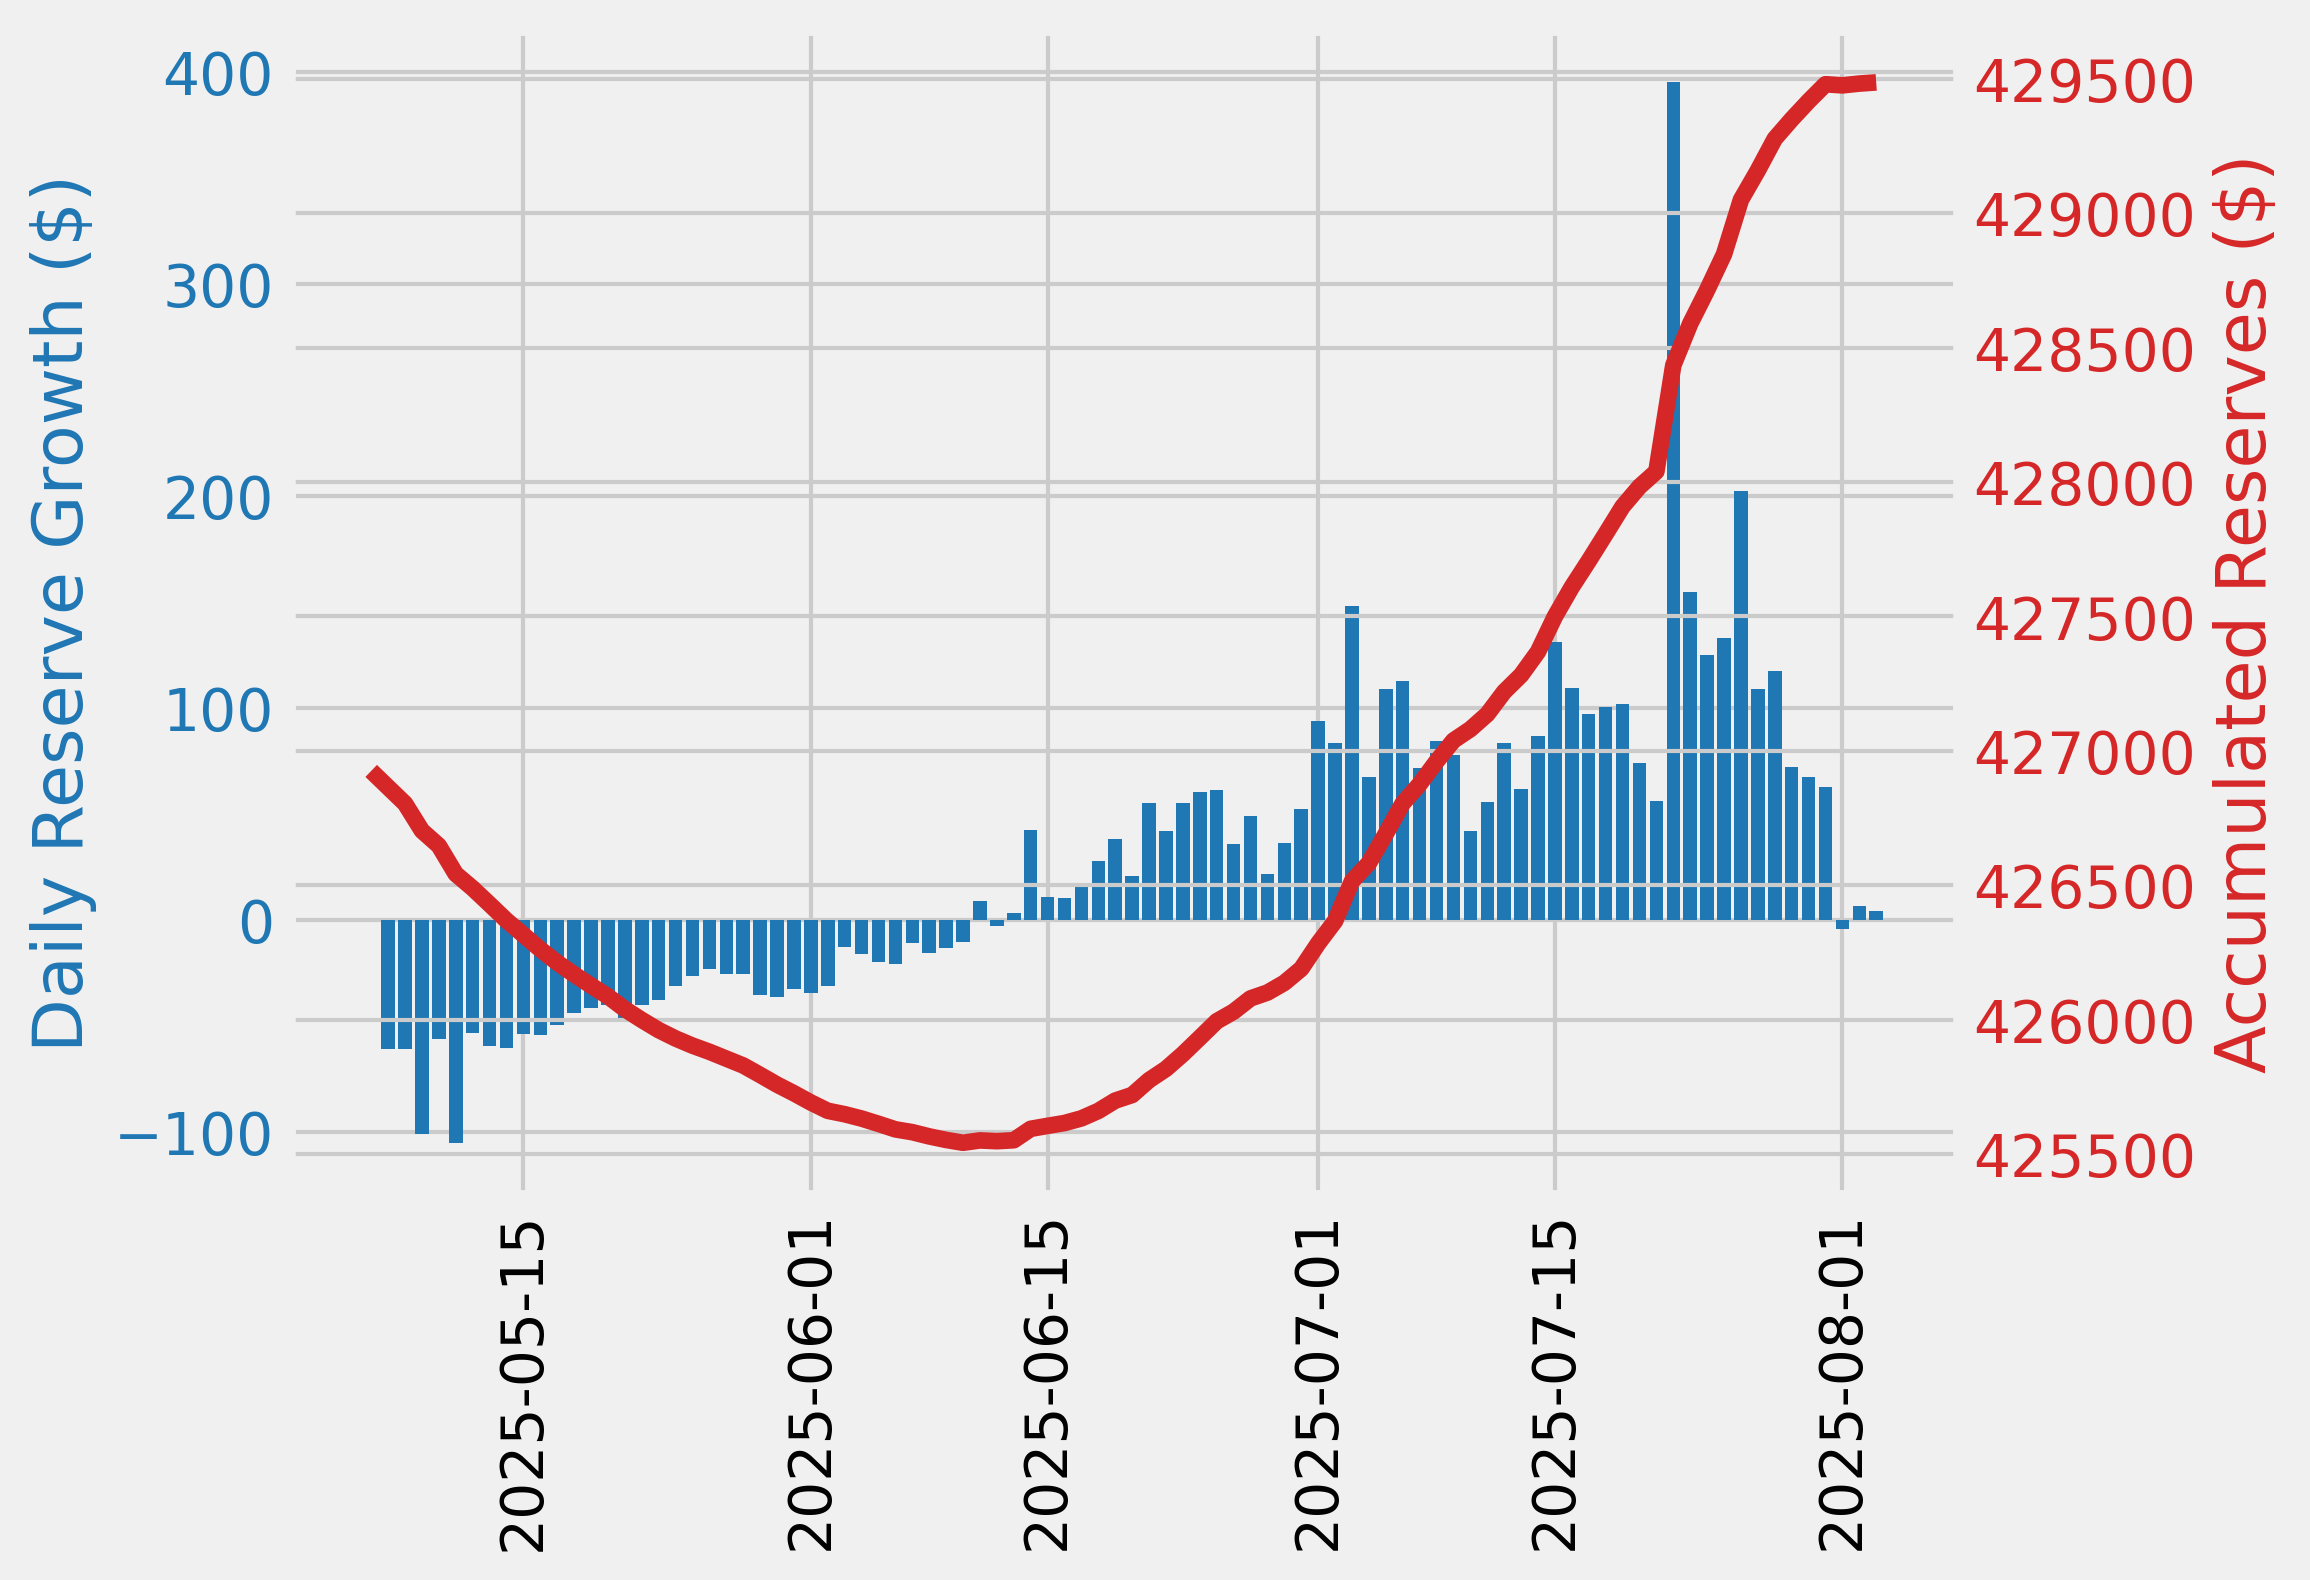
The minimum USDC reserve growth was -7.90%, and the maximum was 7.50%. The average USDC reserve growth was -2.28%.
-
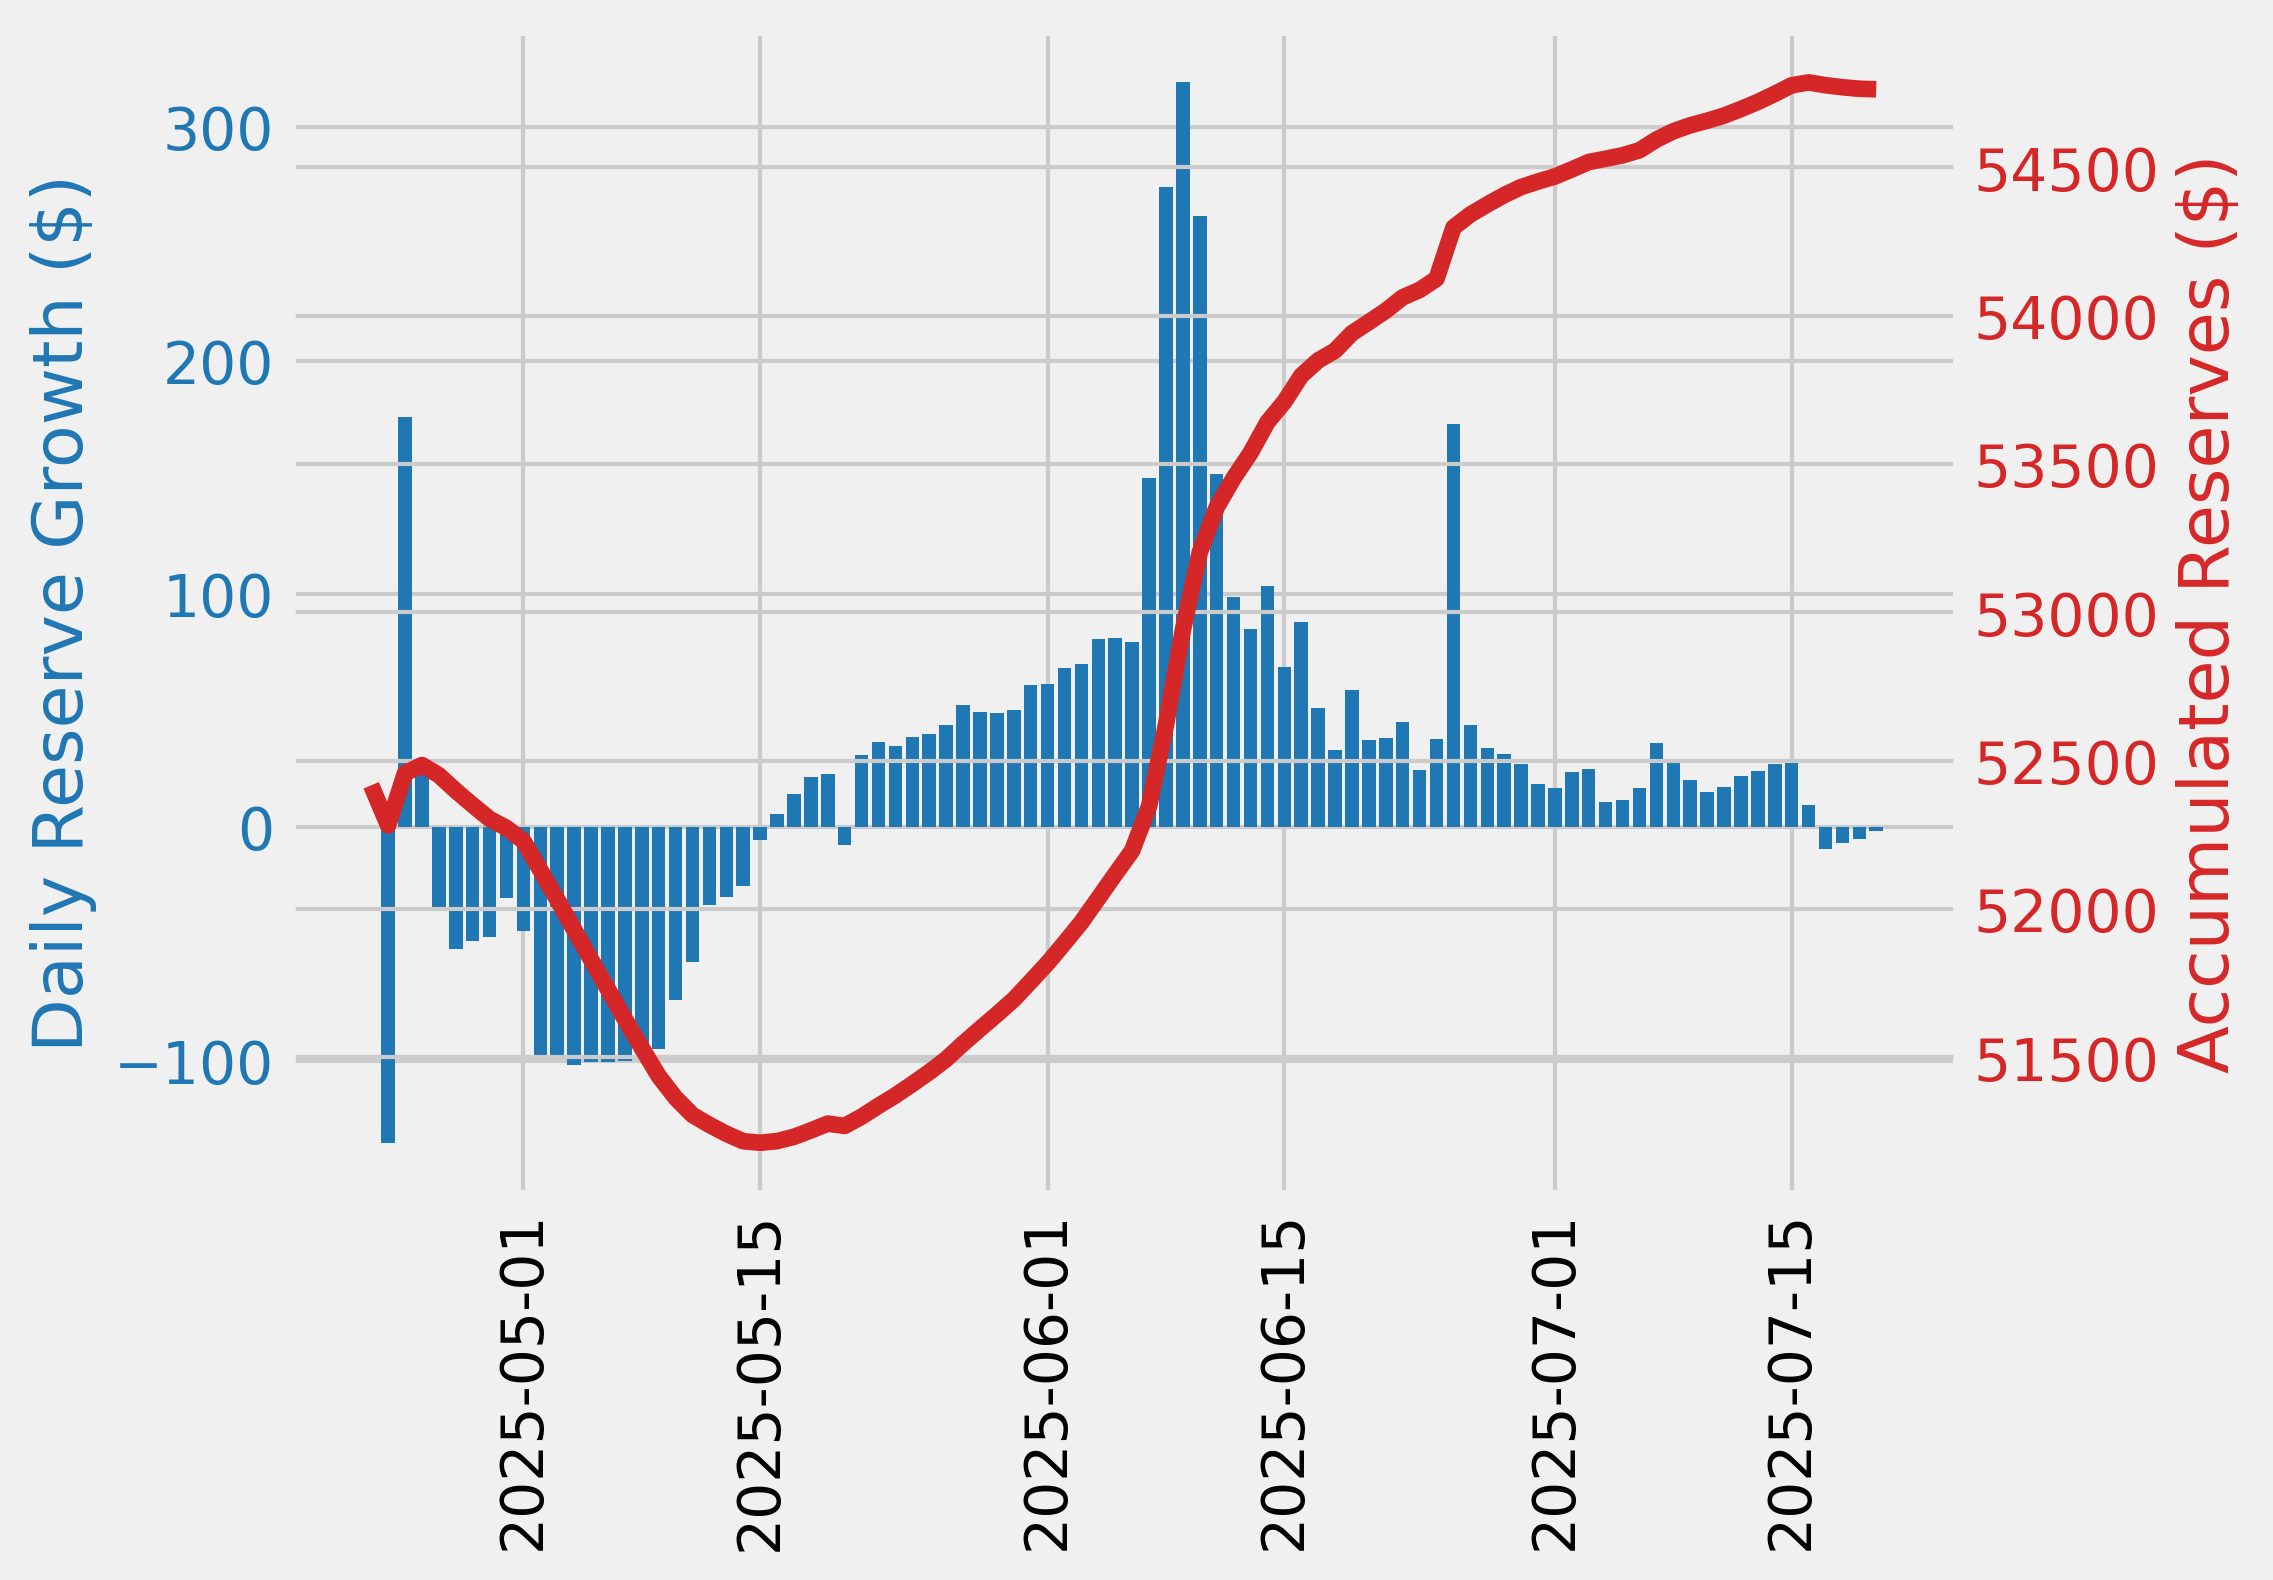
The comet accumulated $-331.22 USDC reserves while distributing 5.20K COMP rewards for a weekly Net Protocol Profit of -5.53K.
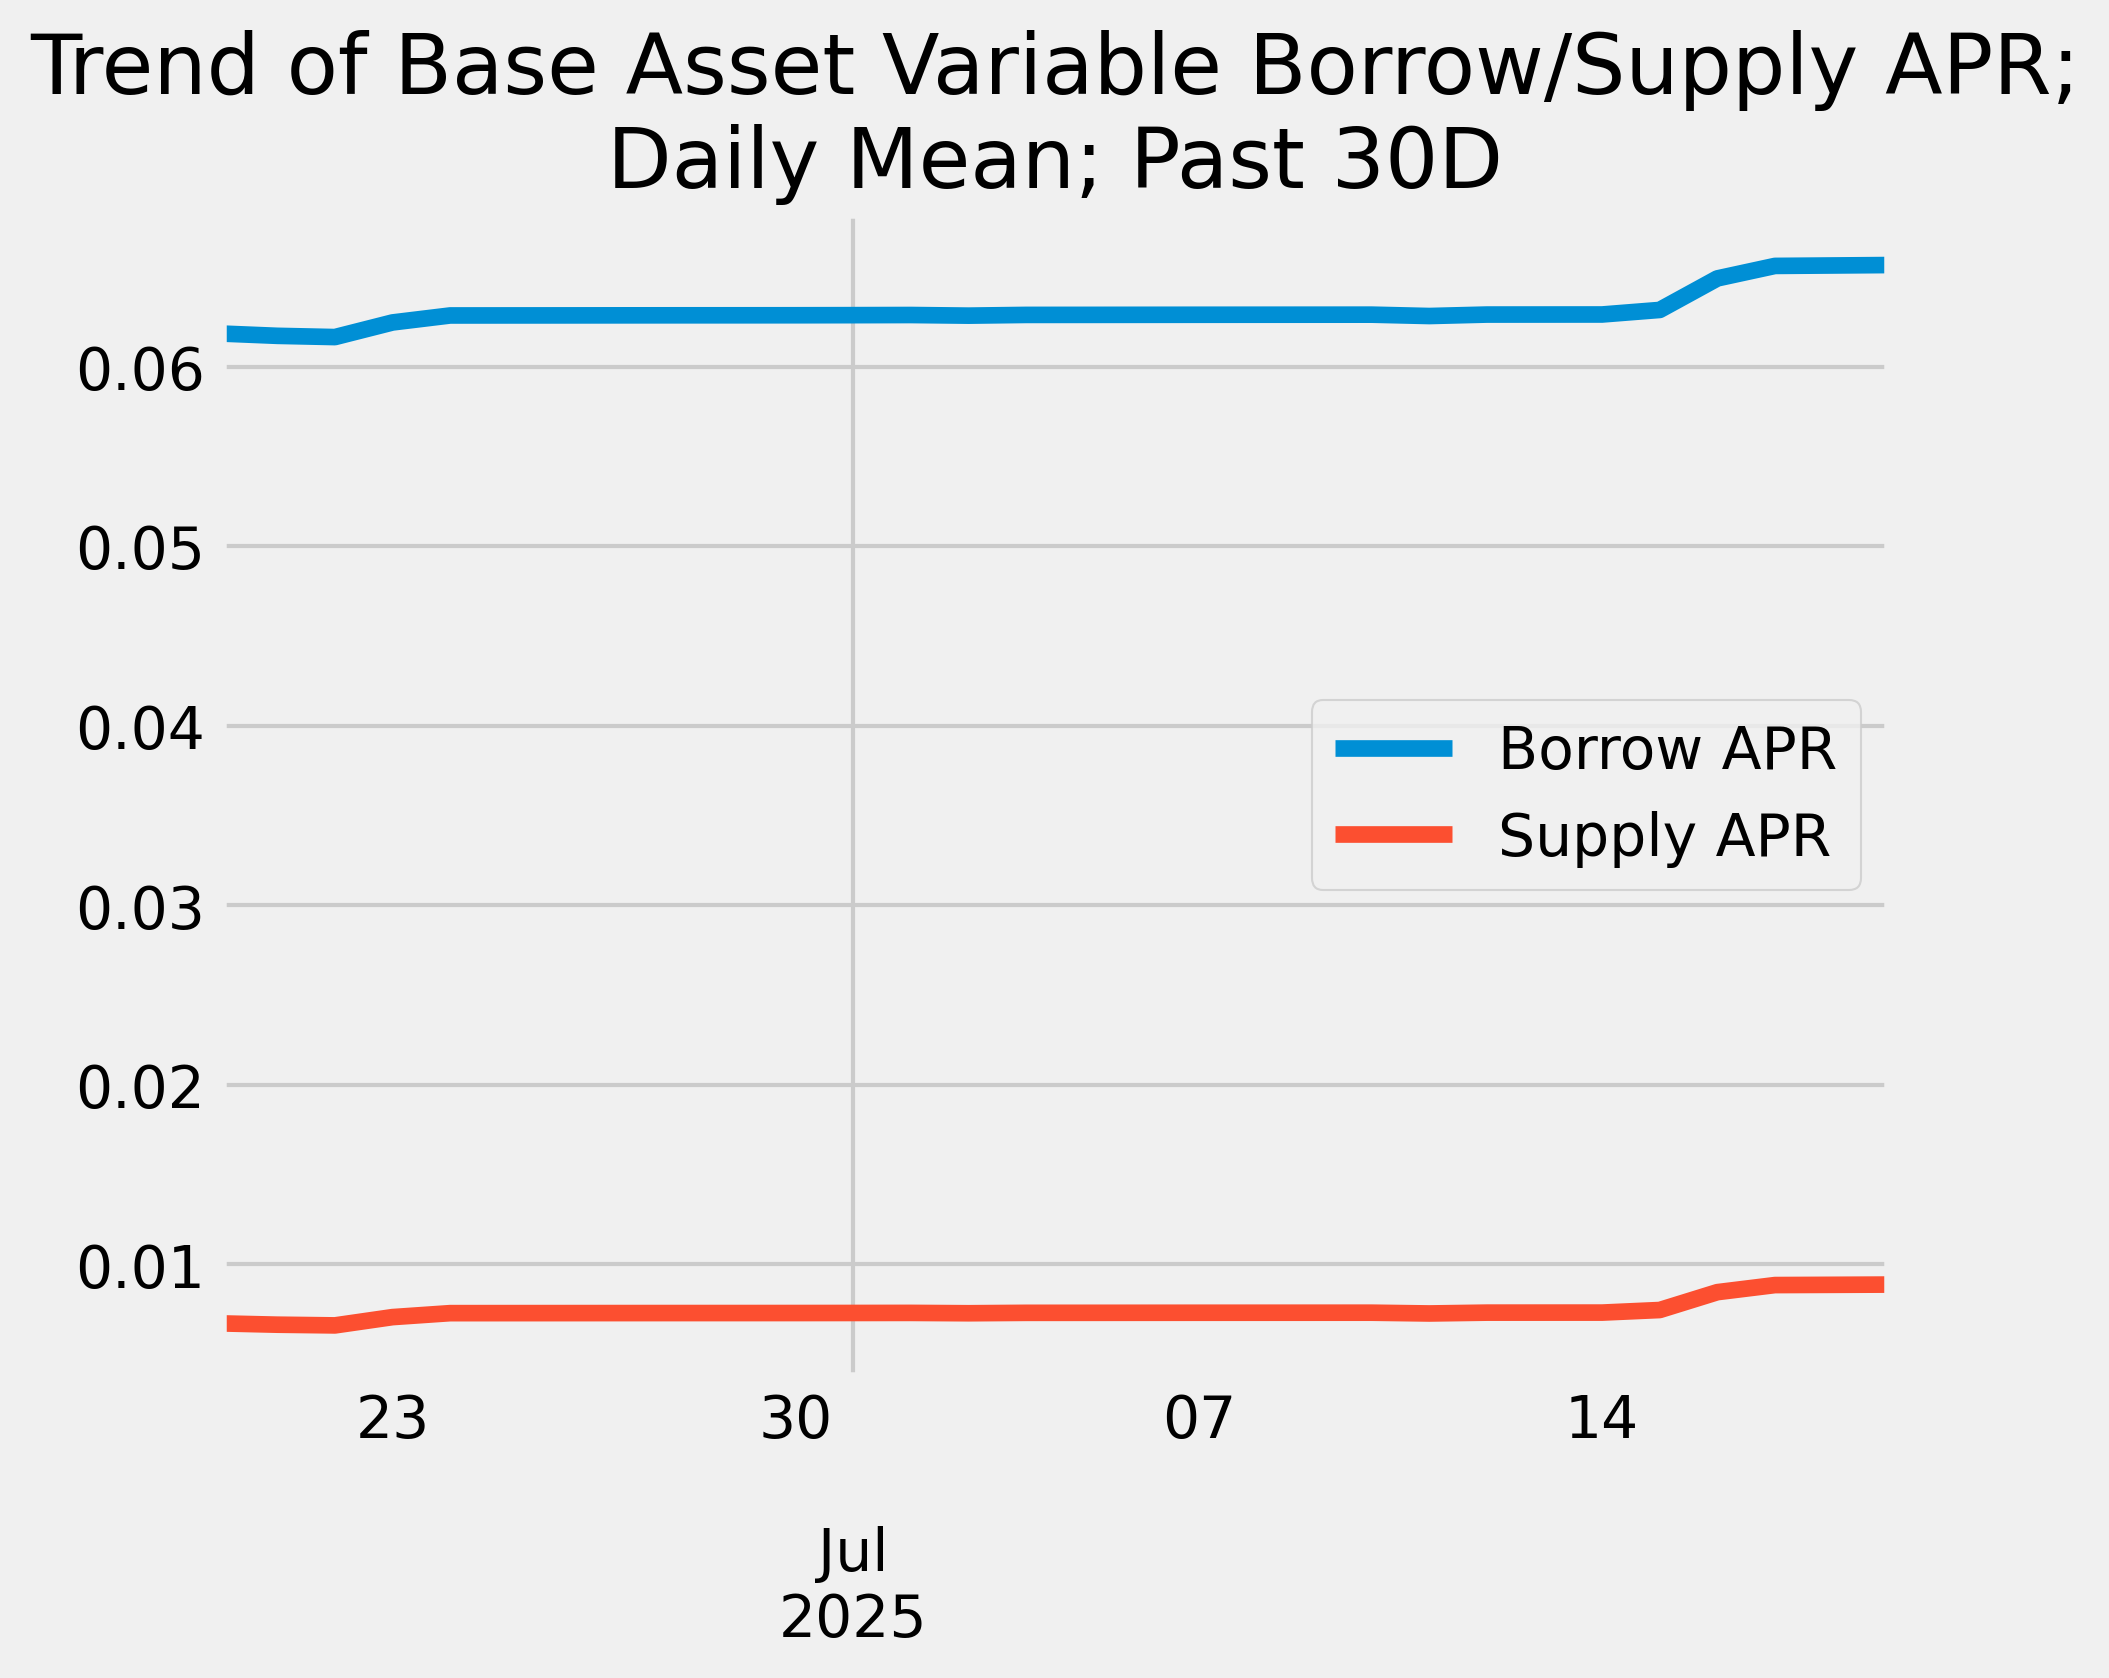
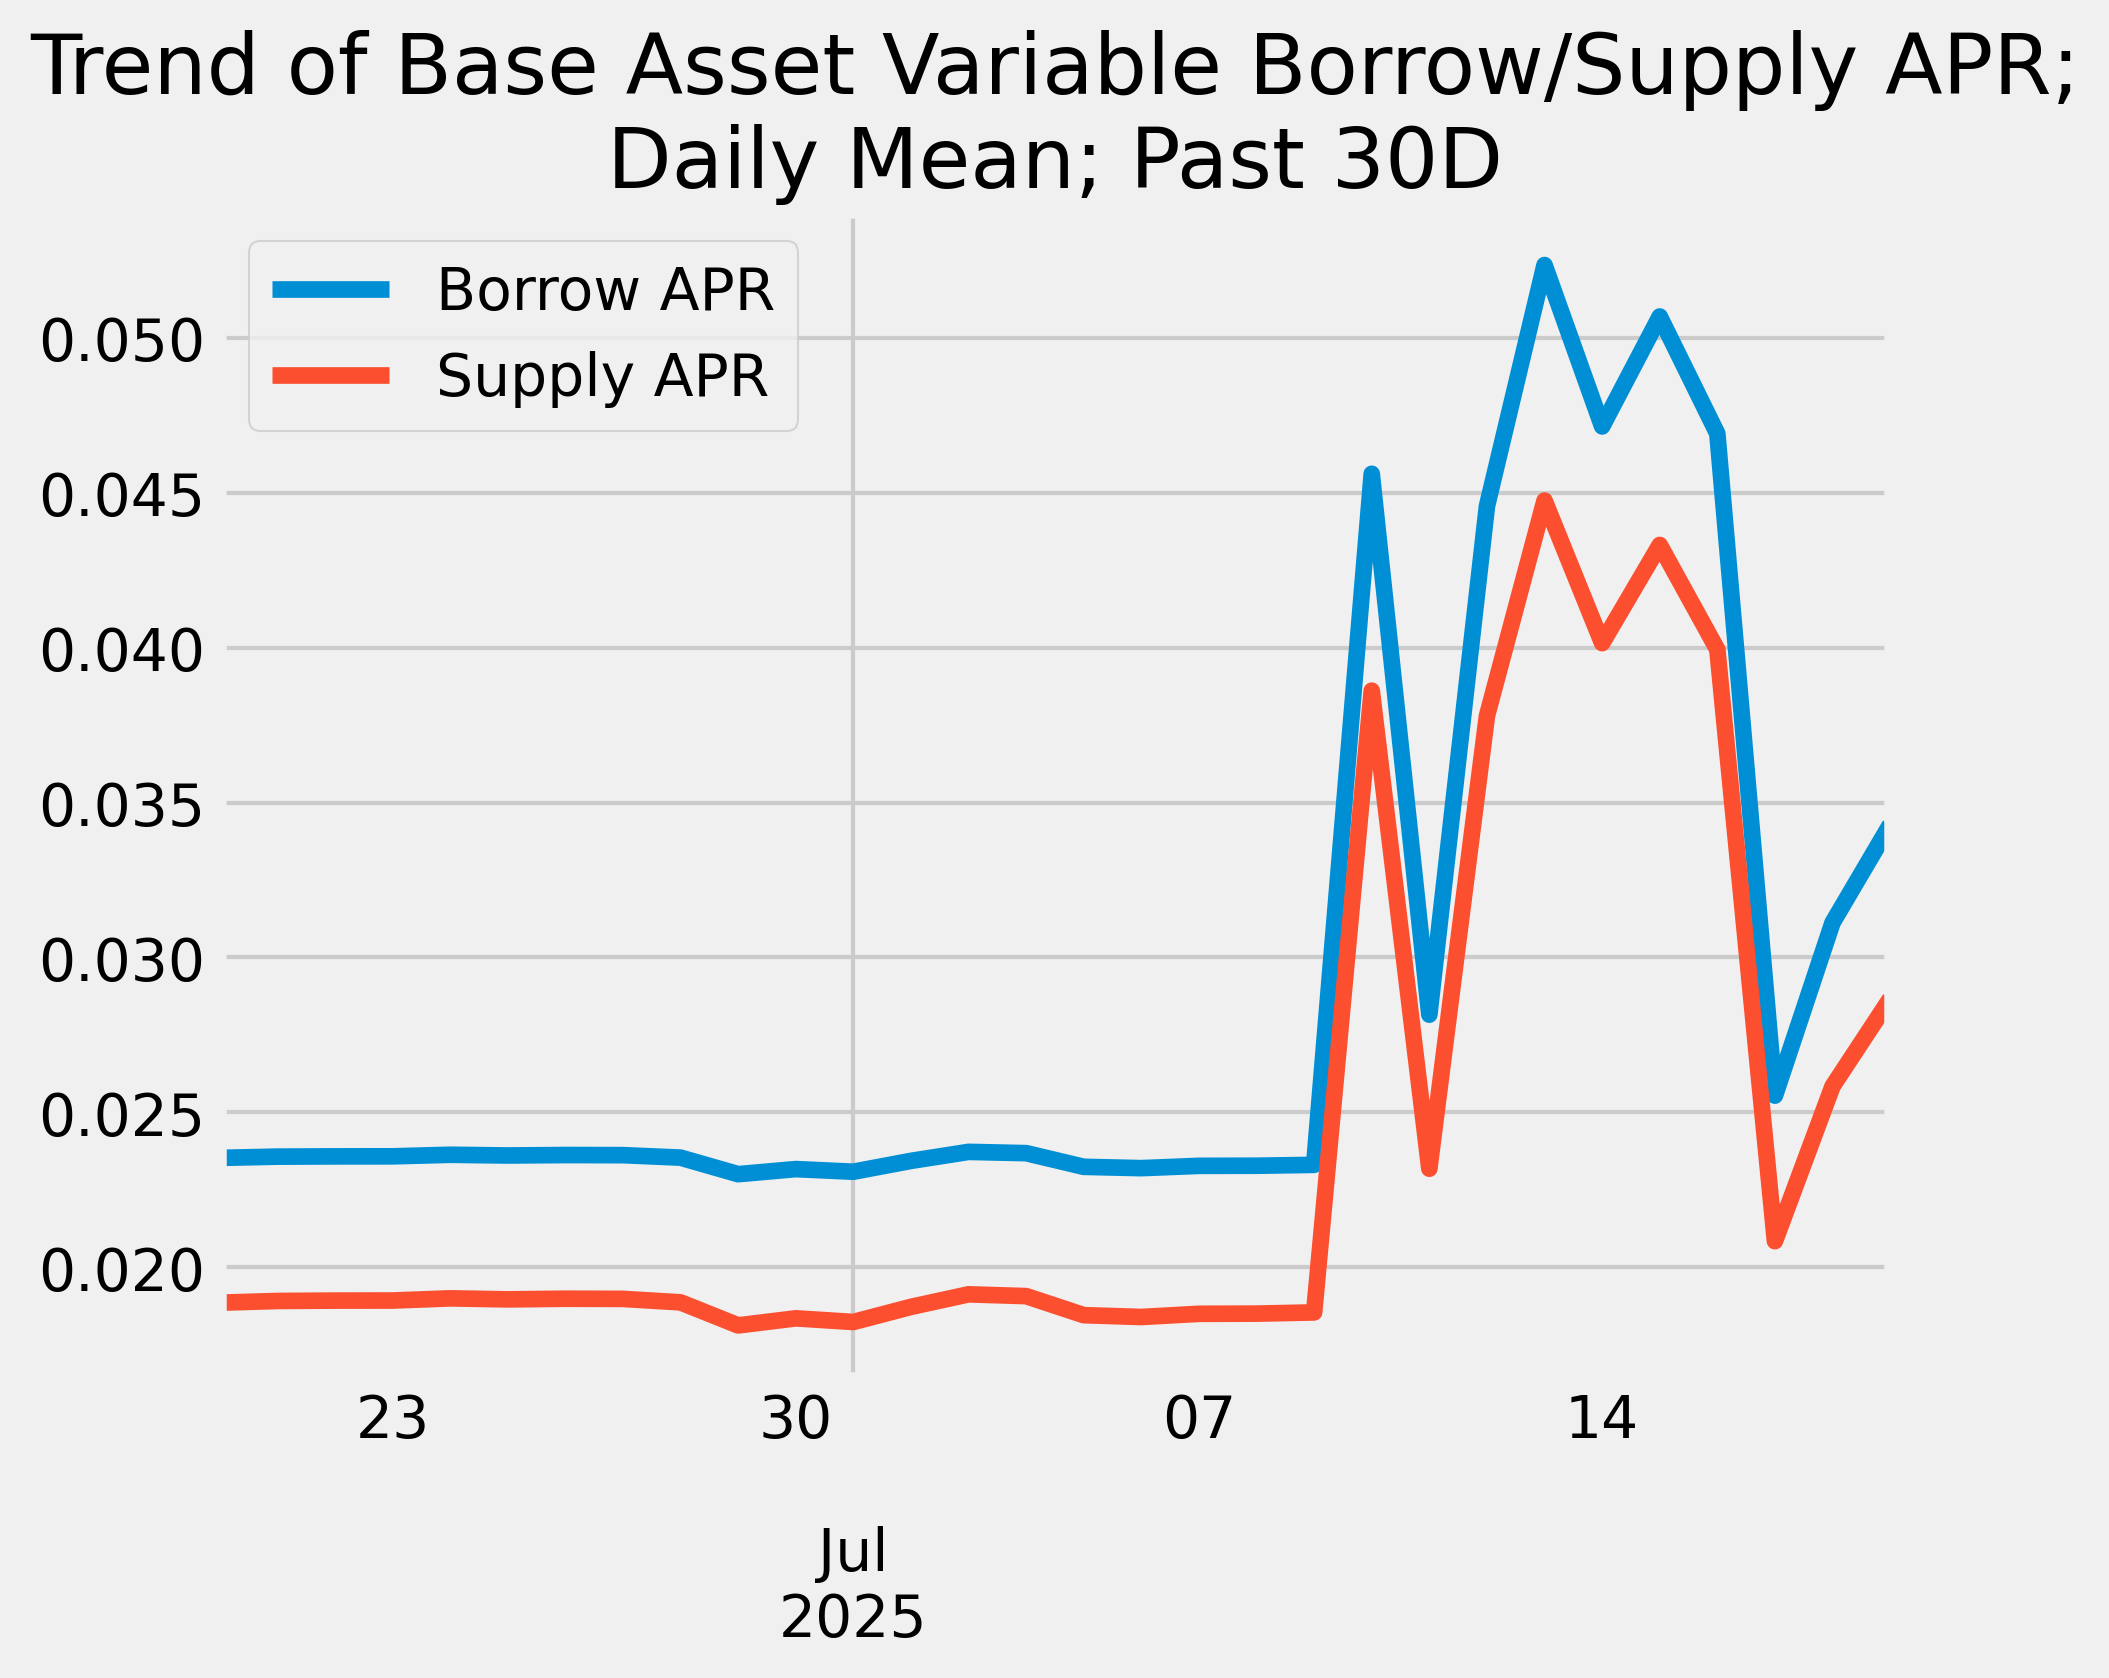
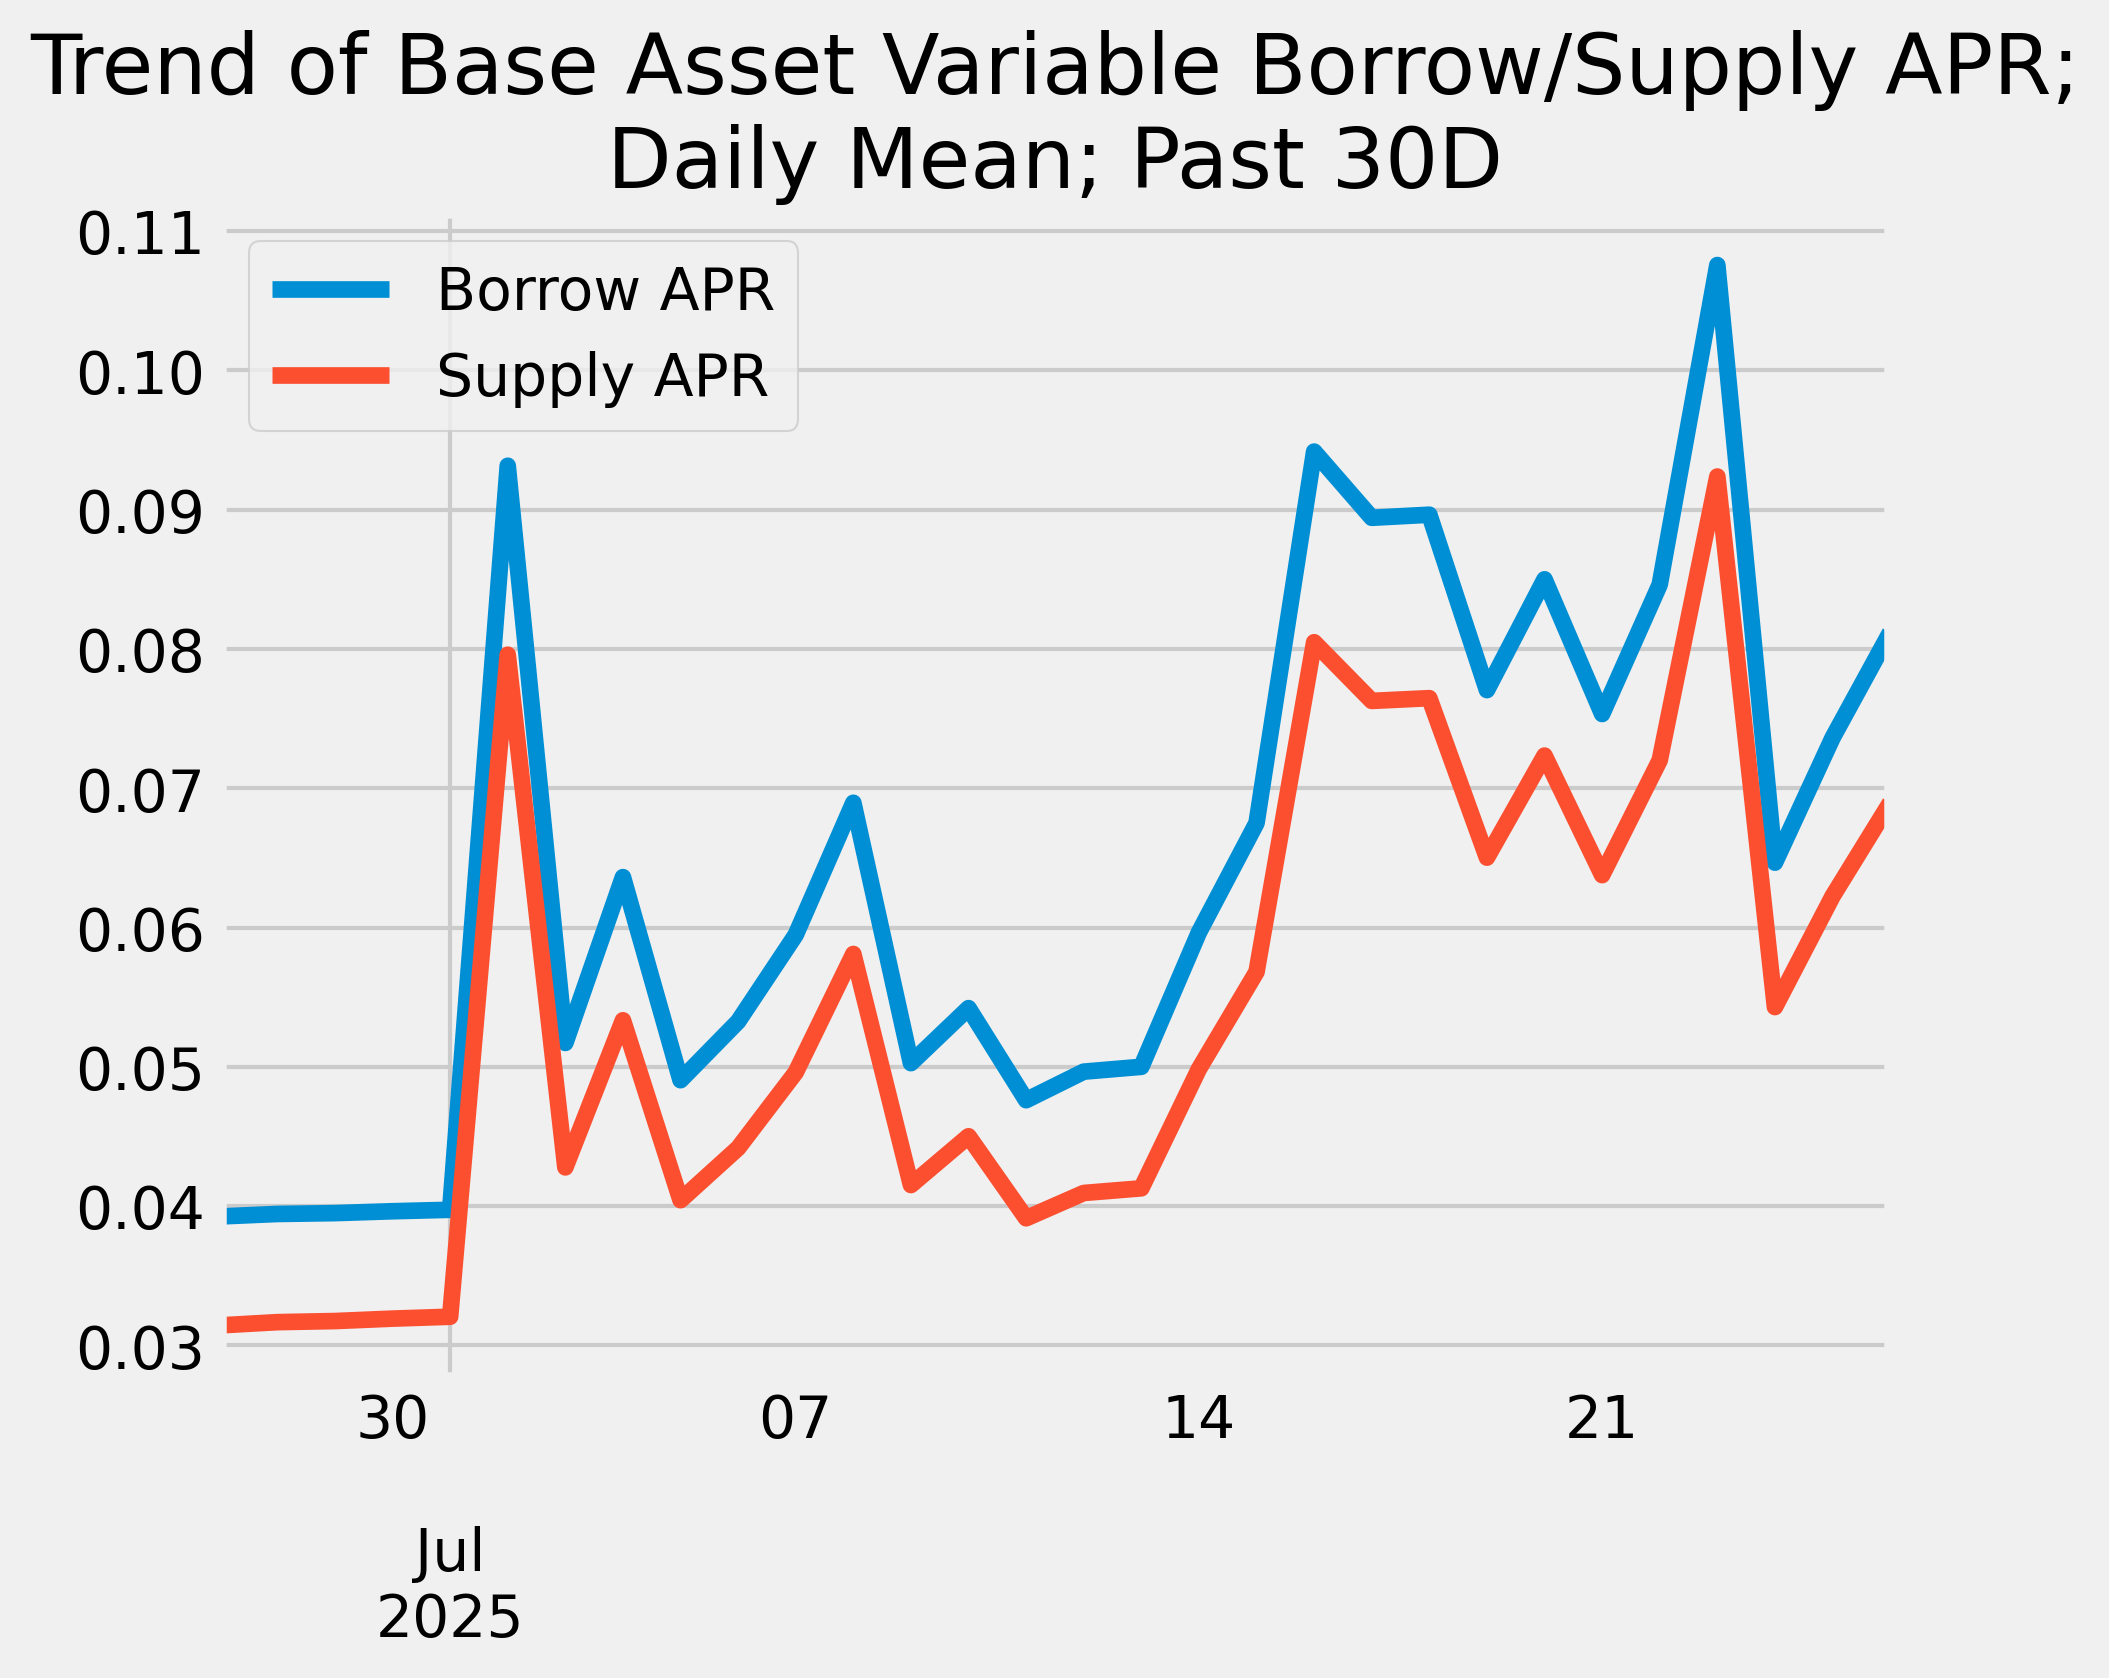
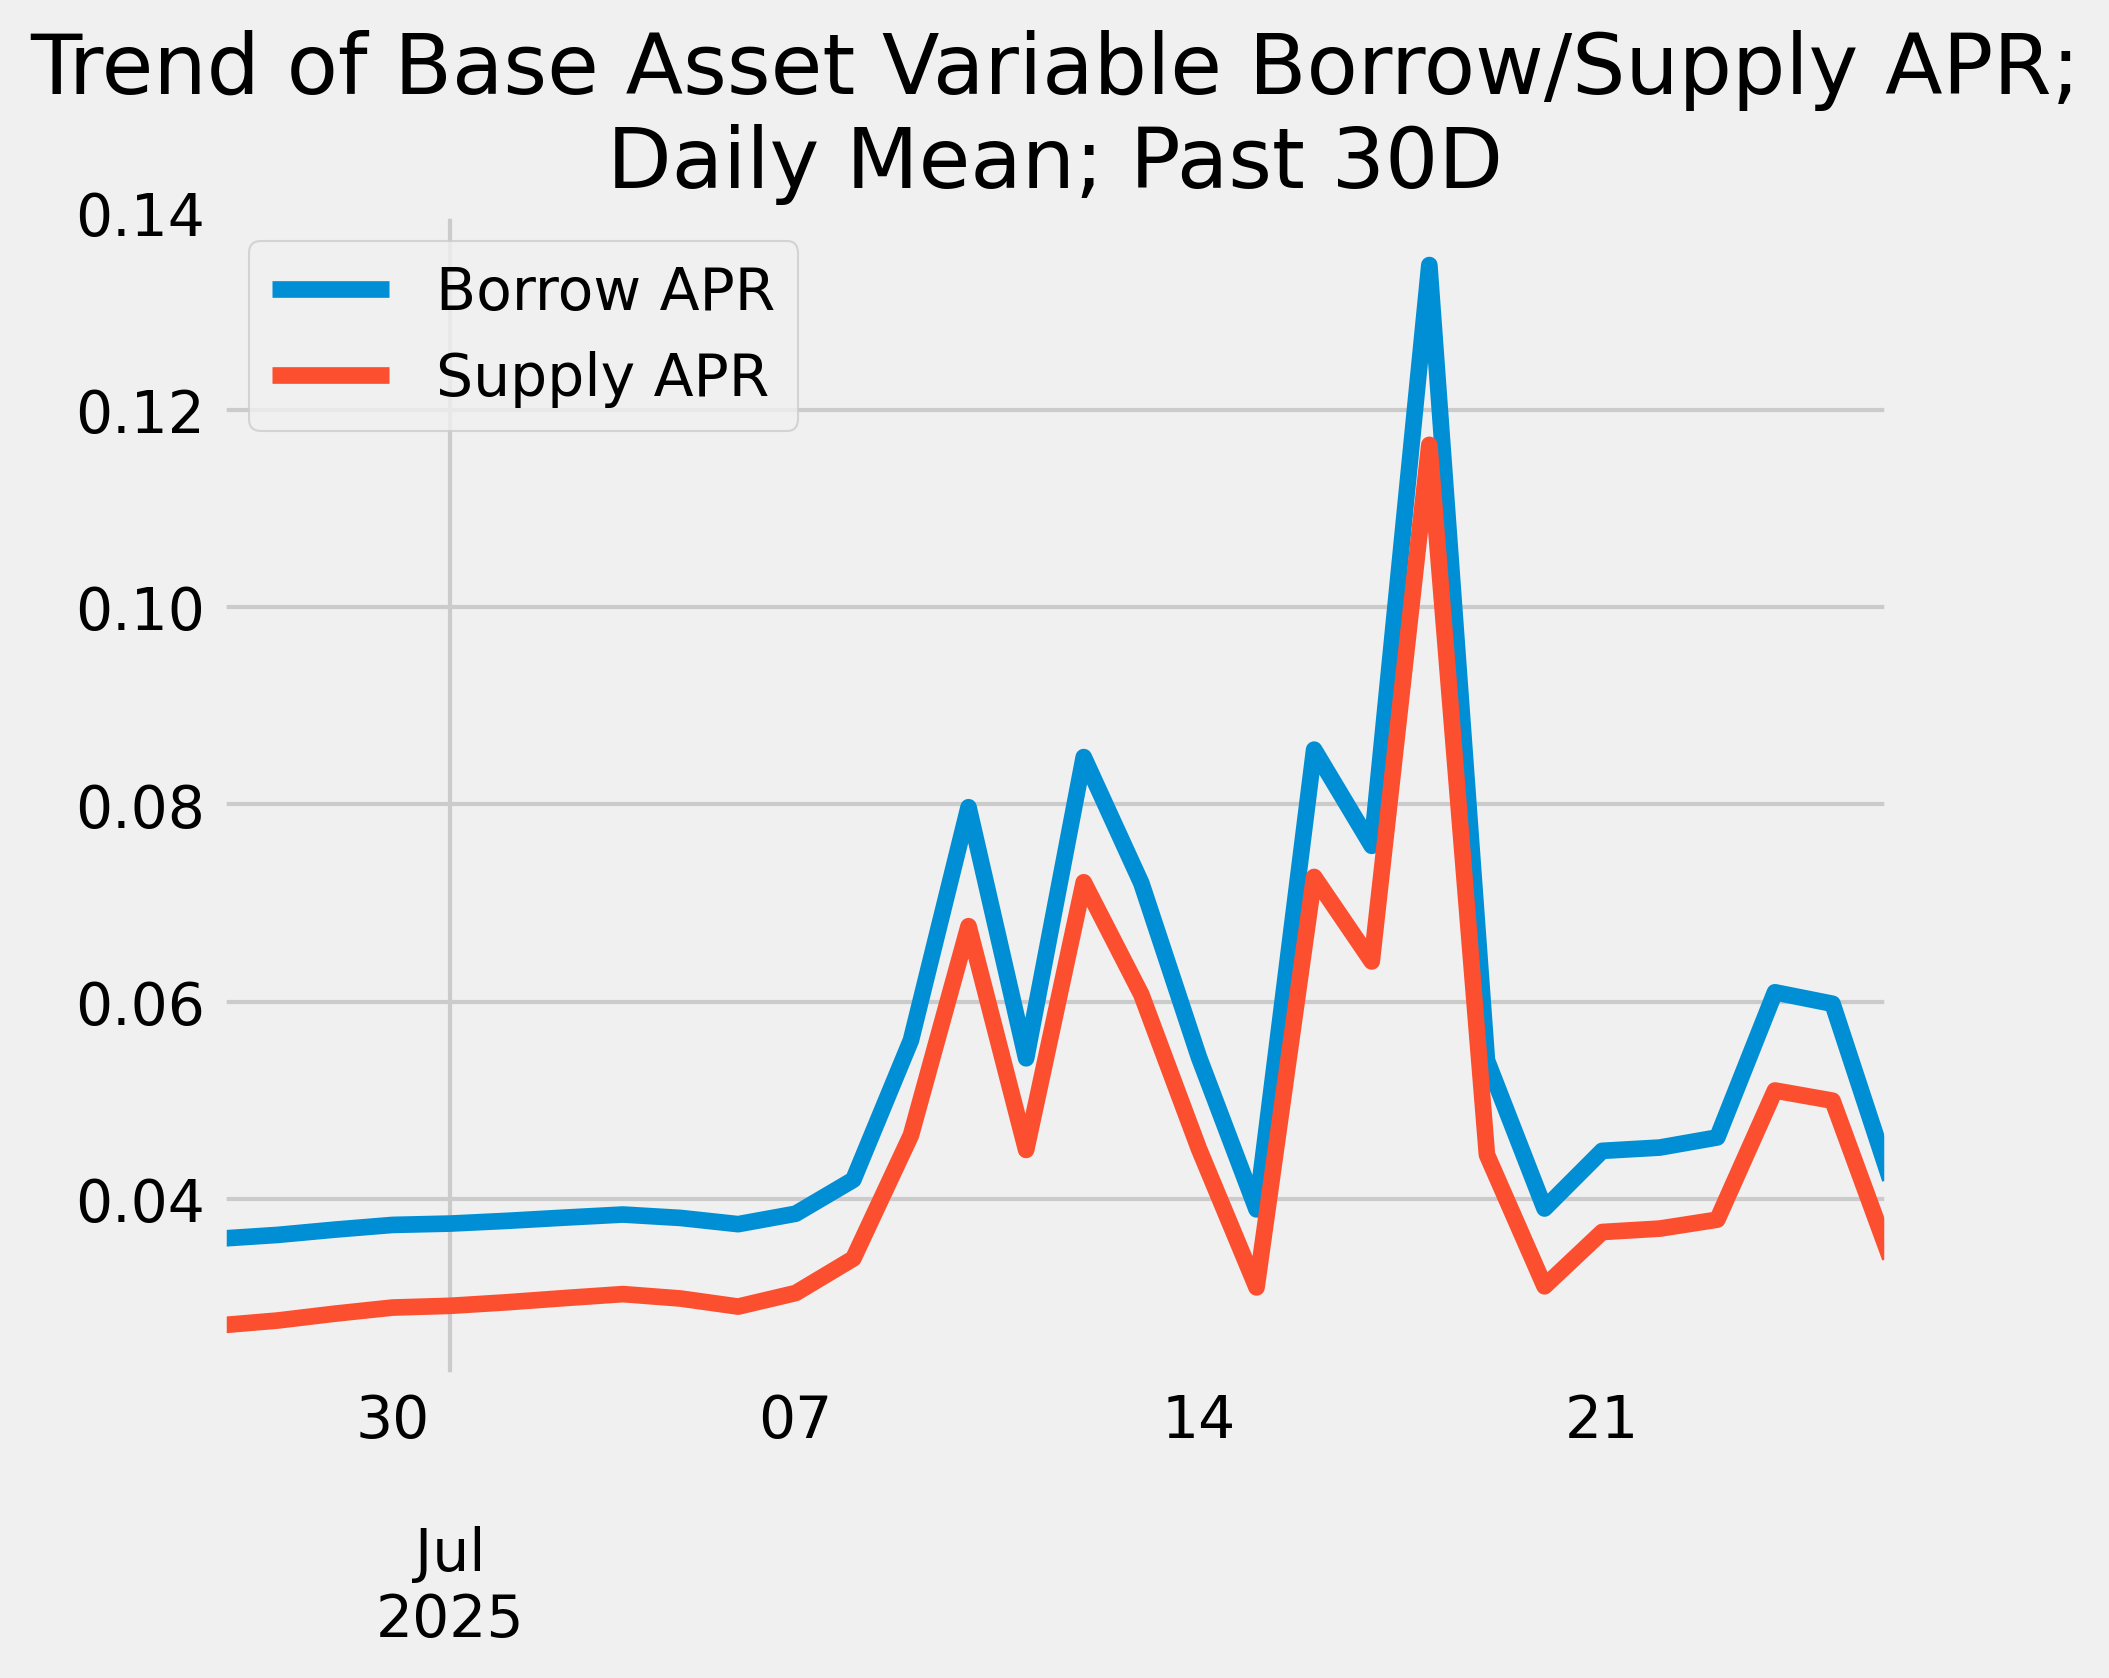
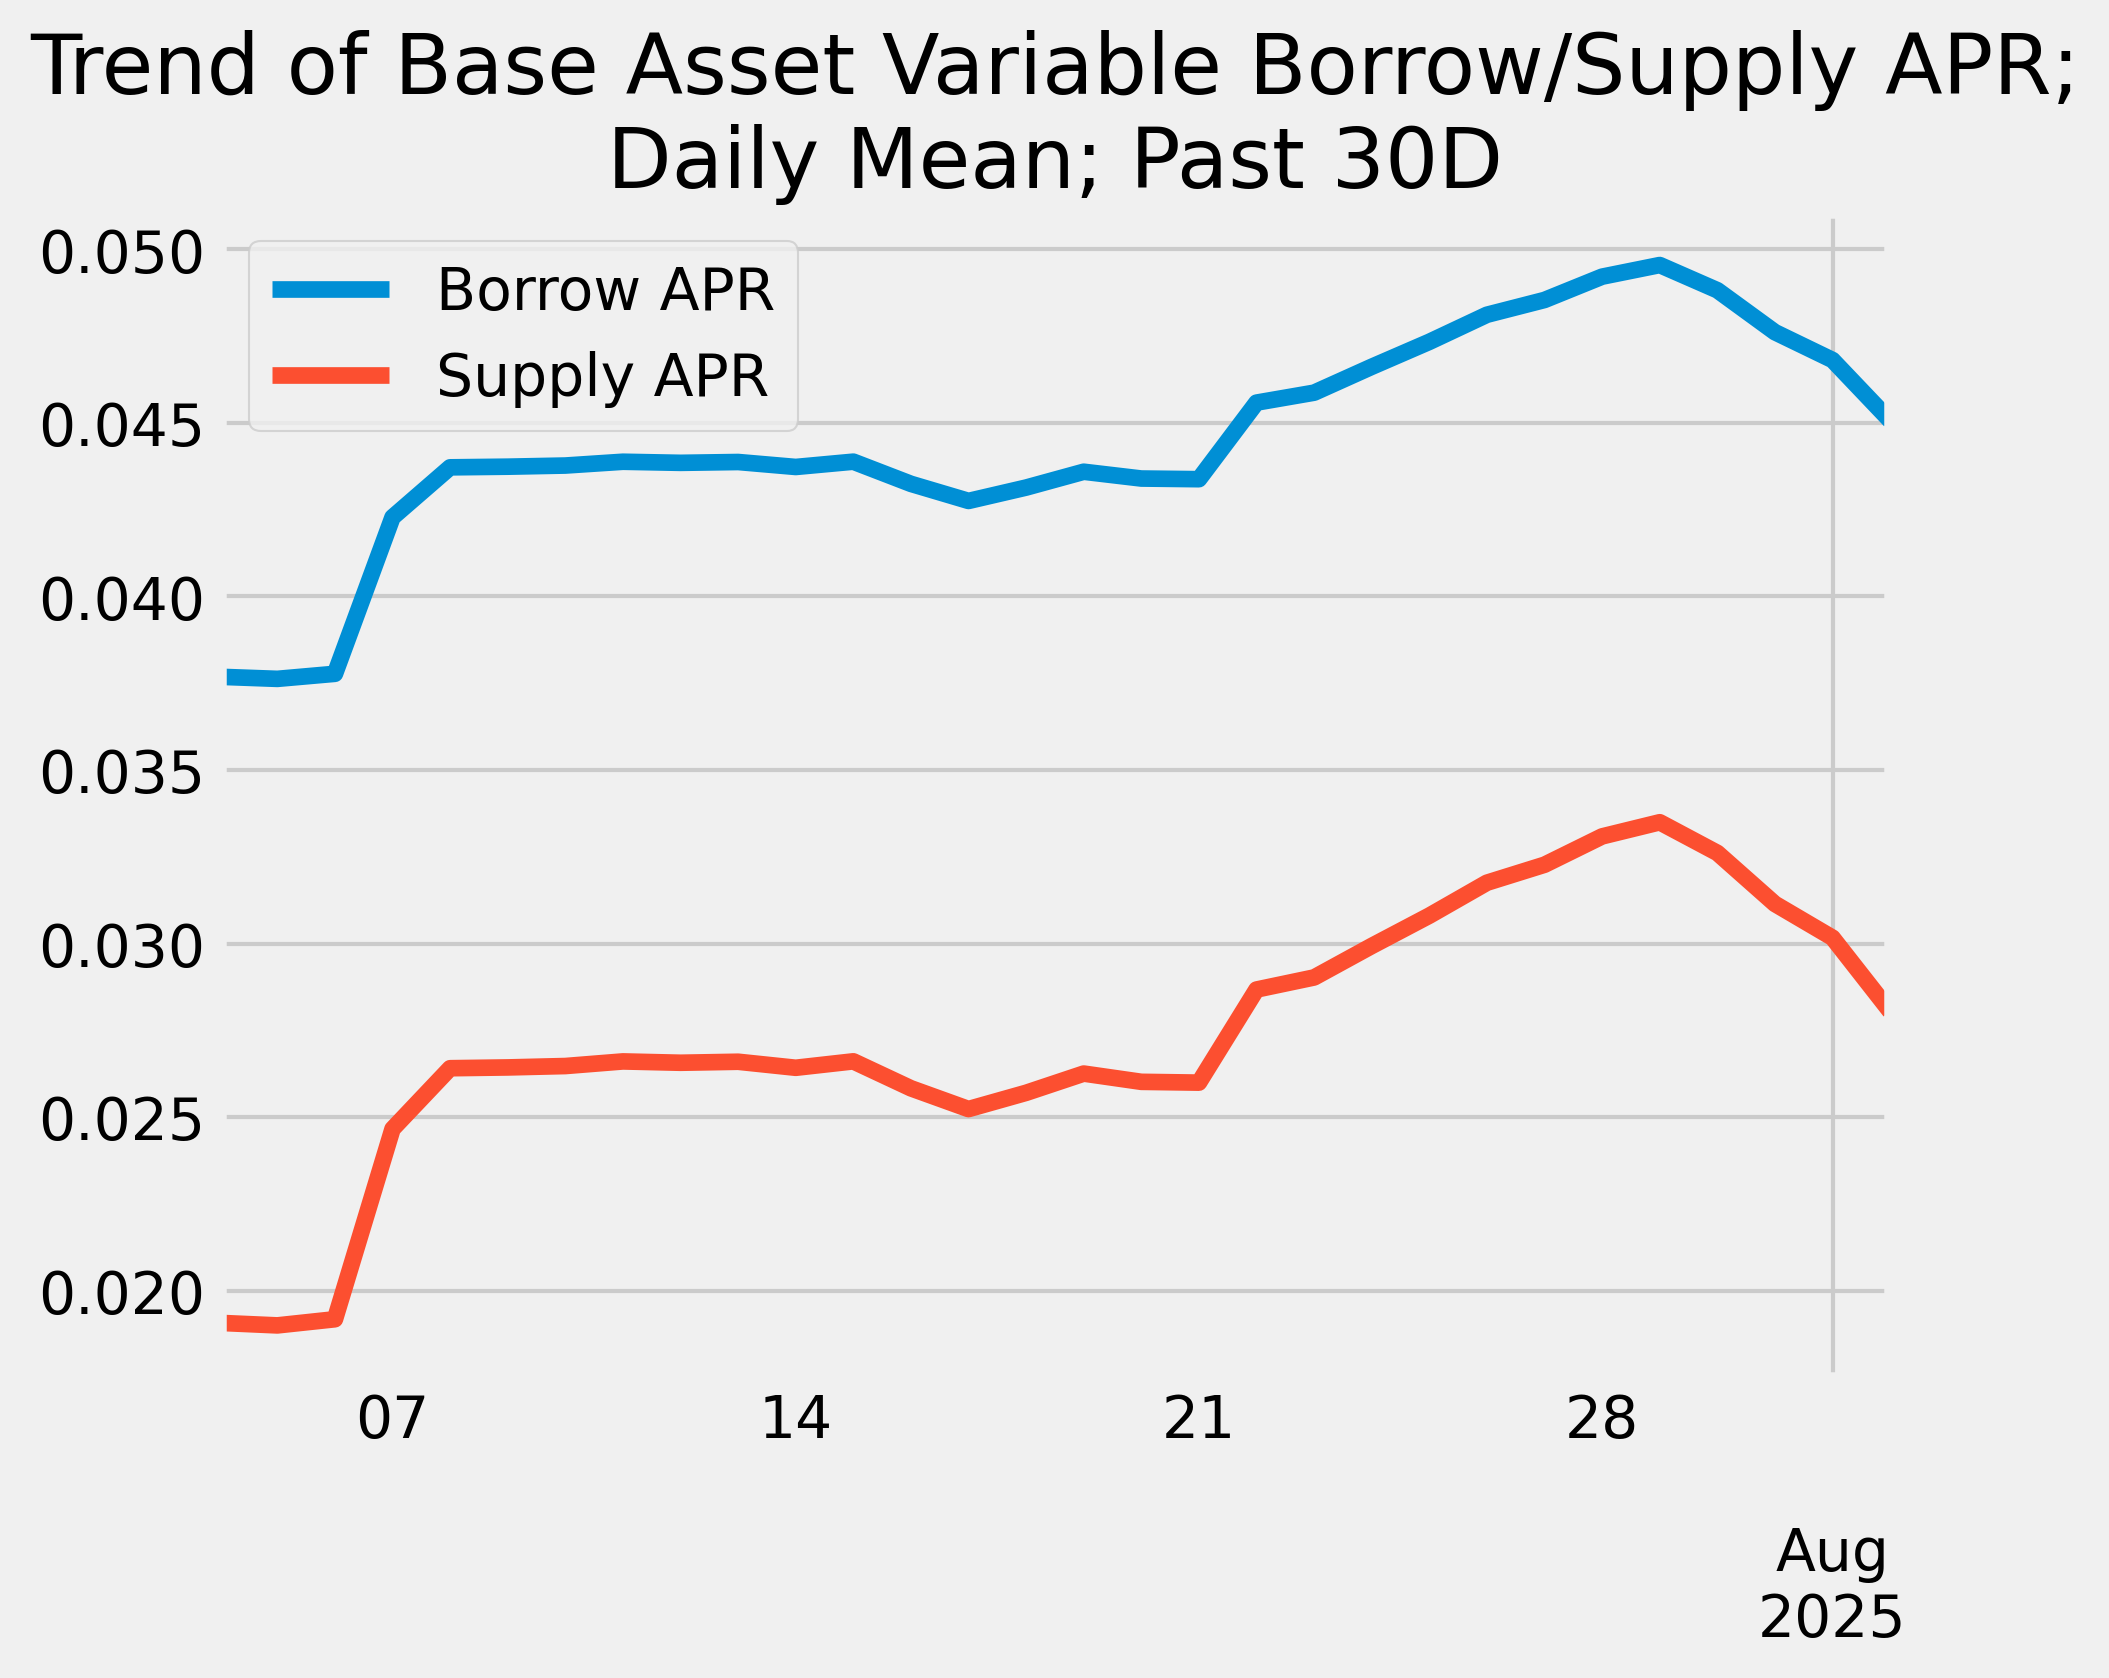
Base Asset APR Trend

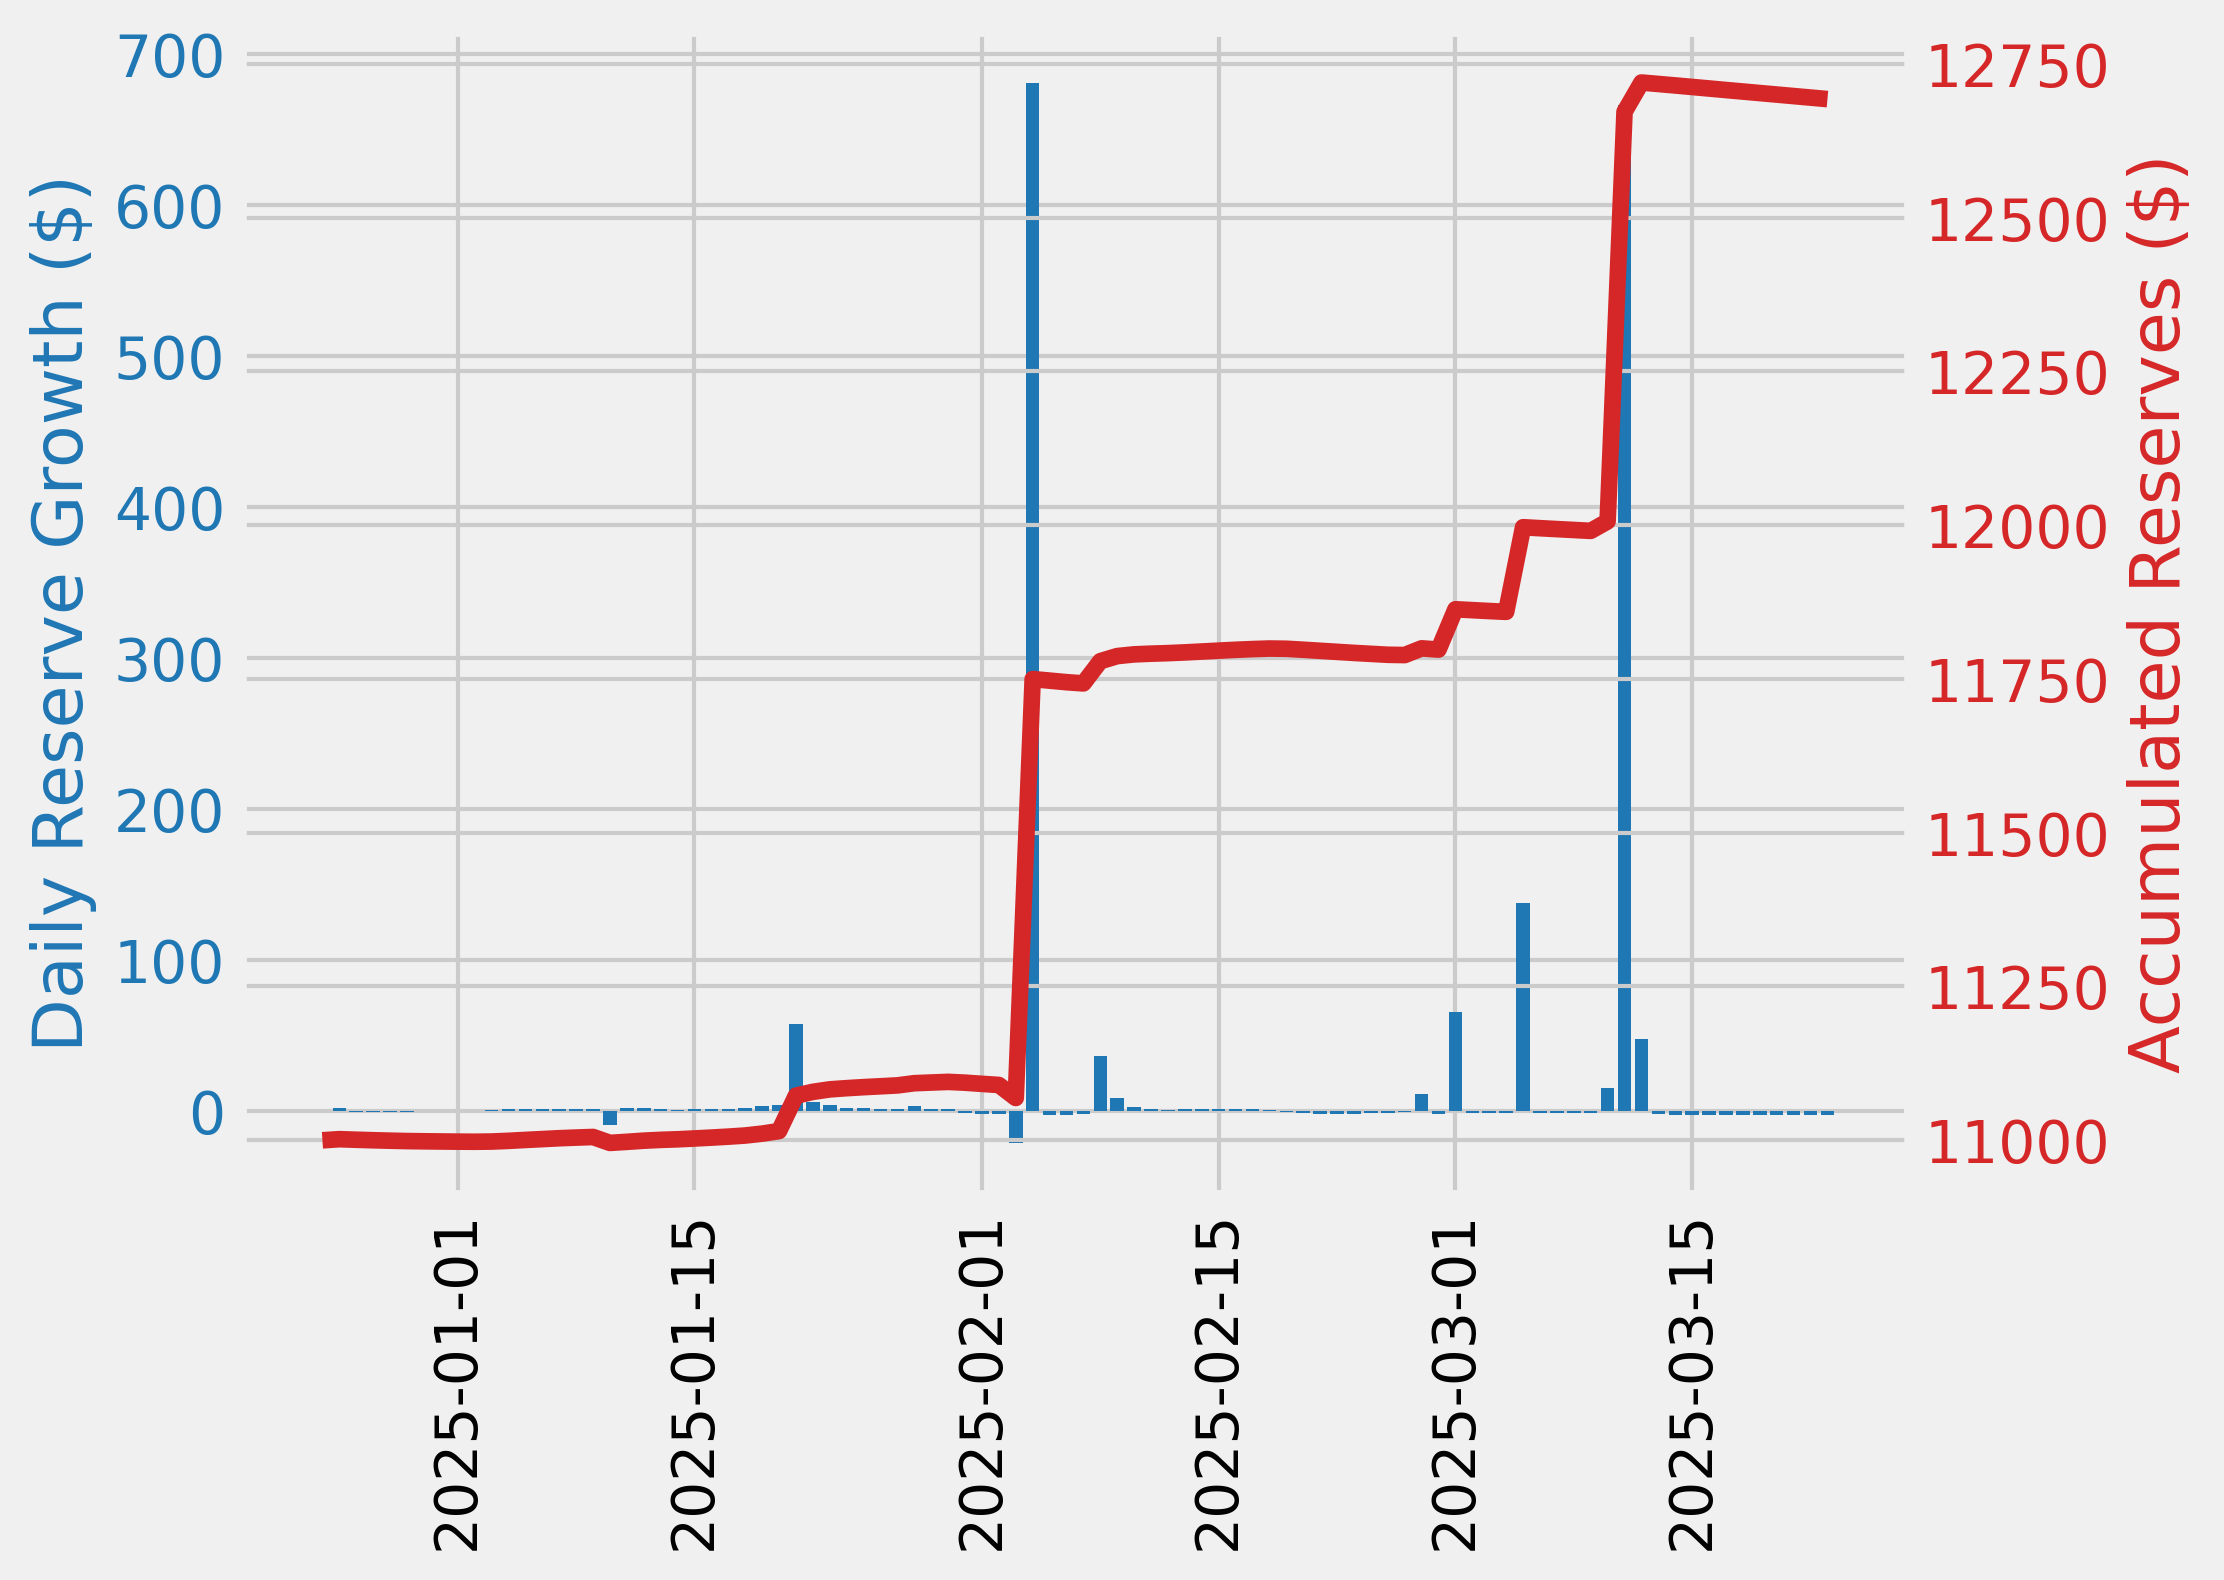
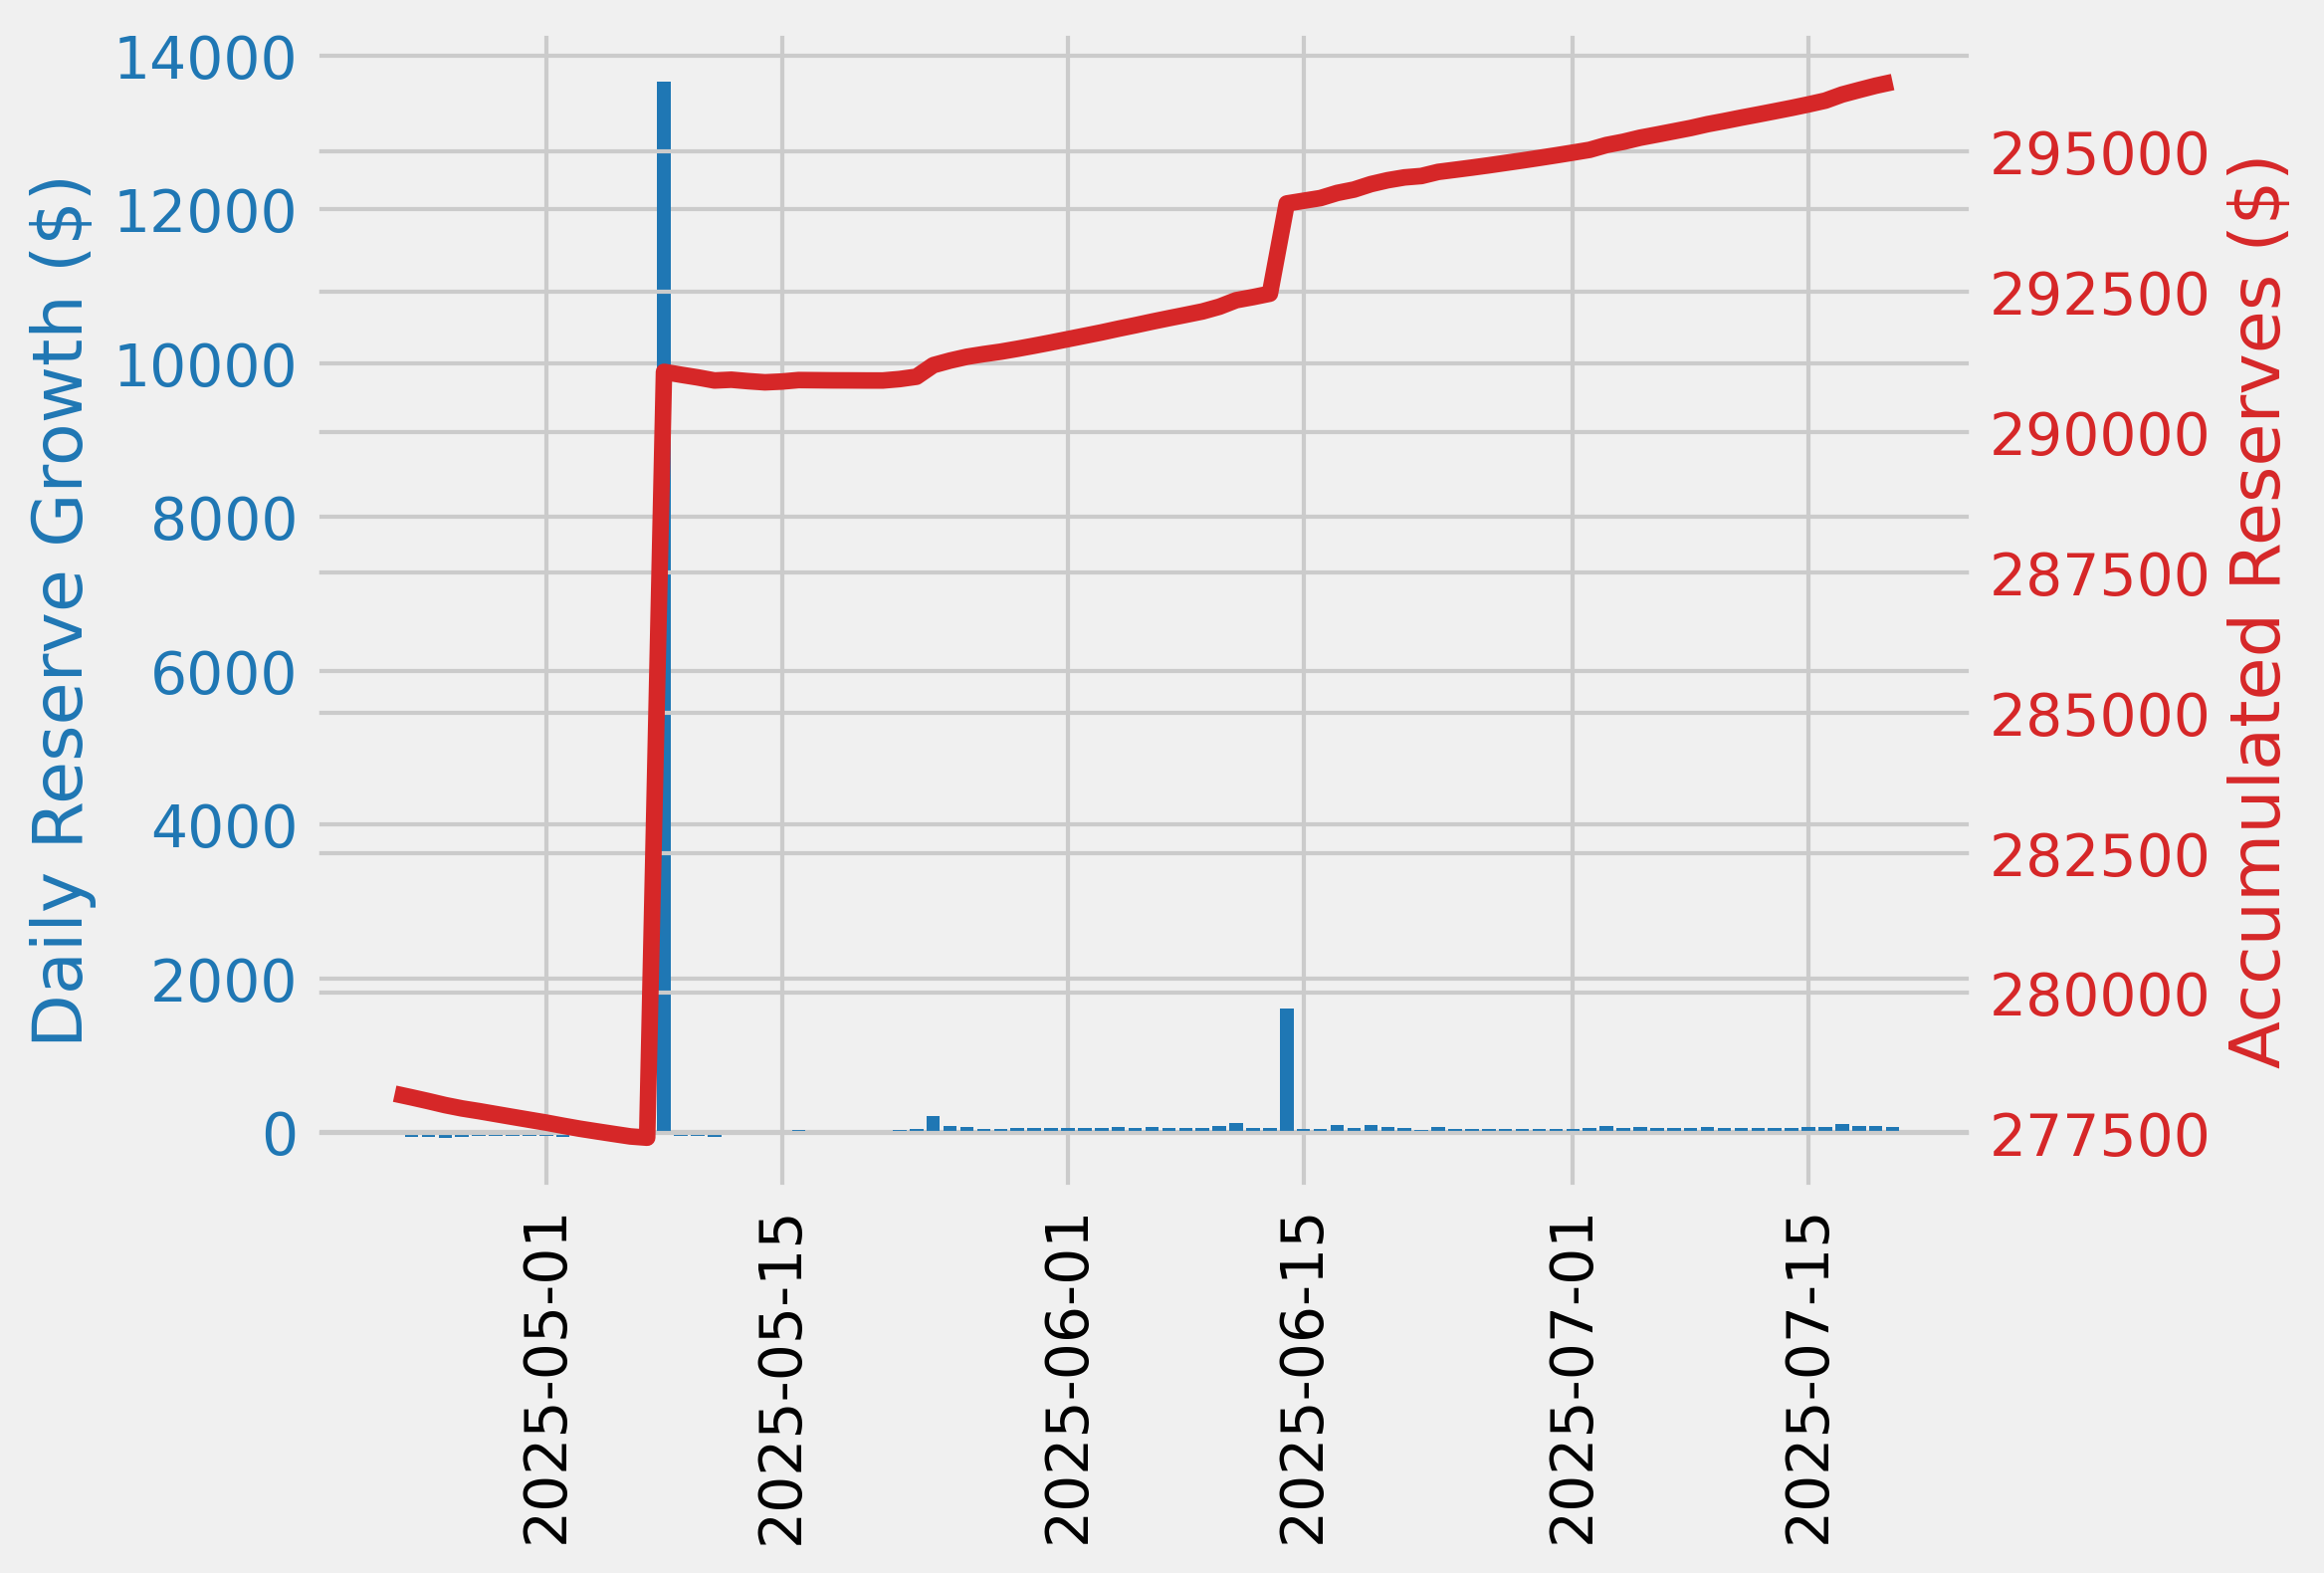
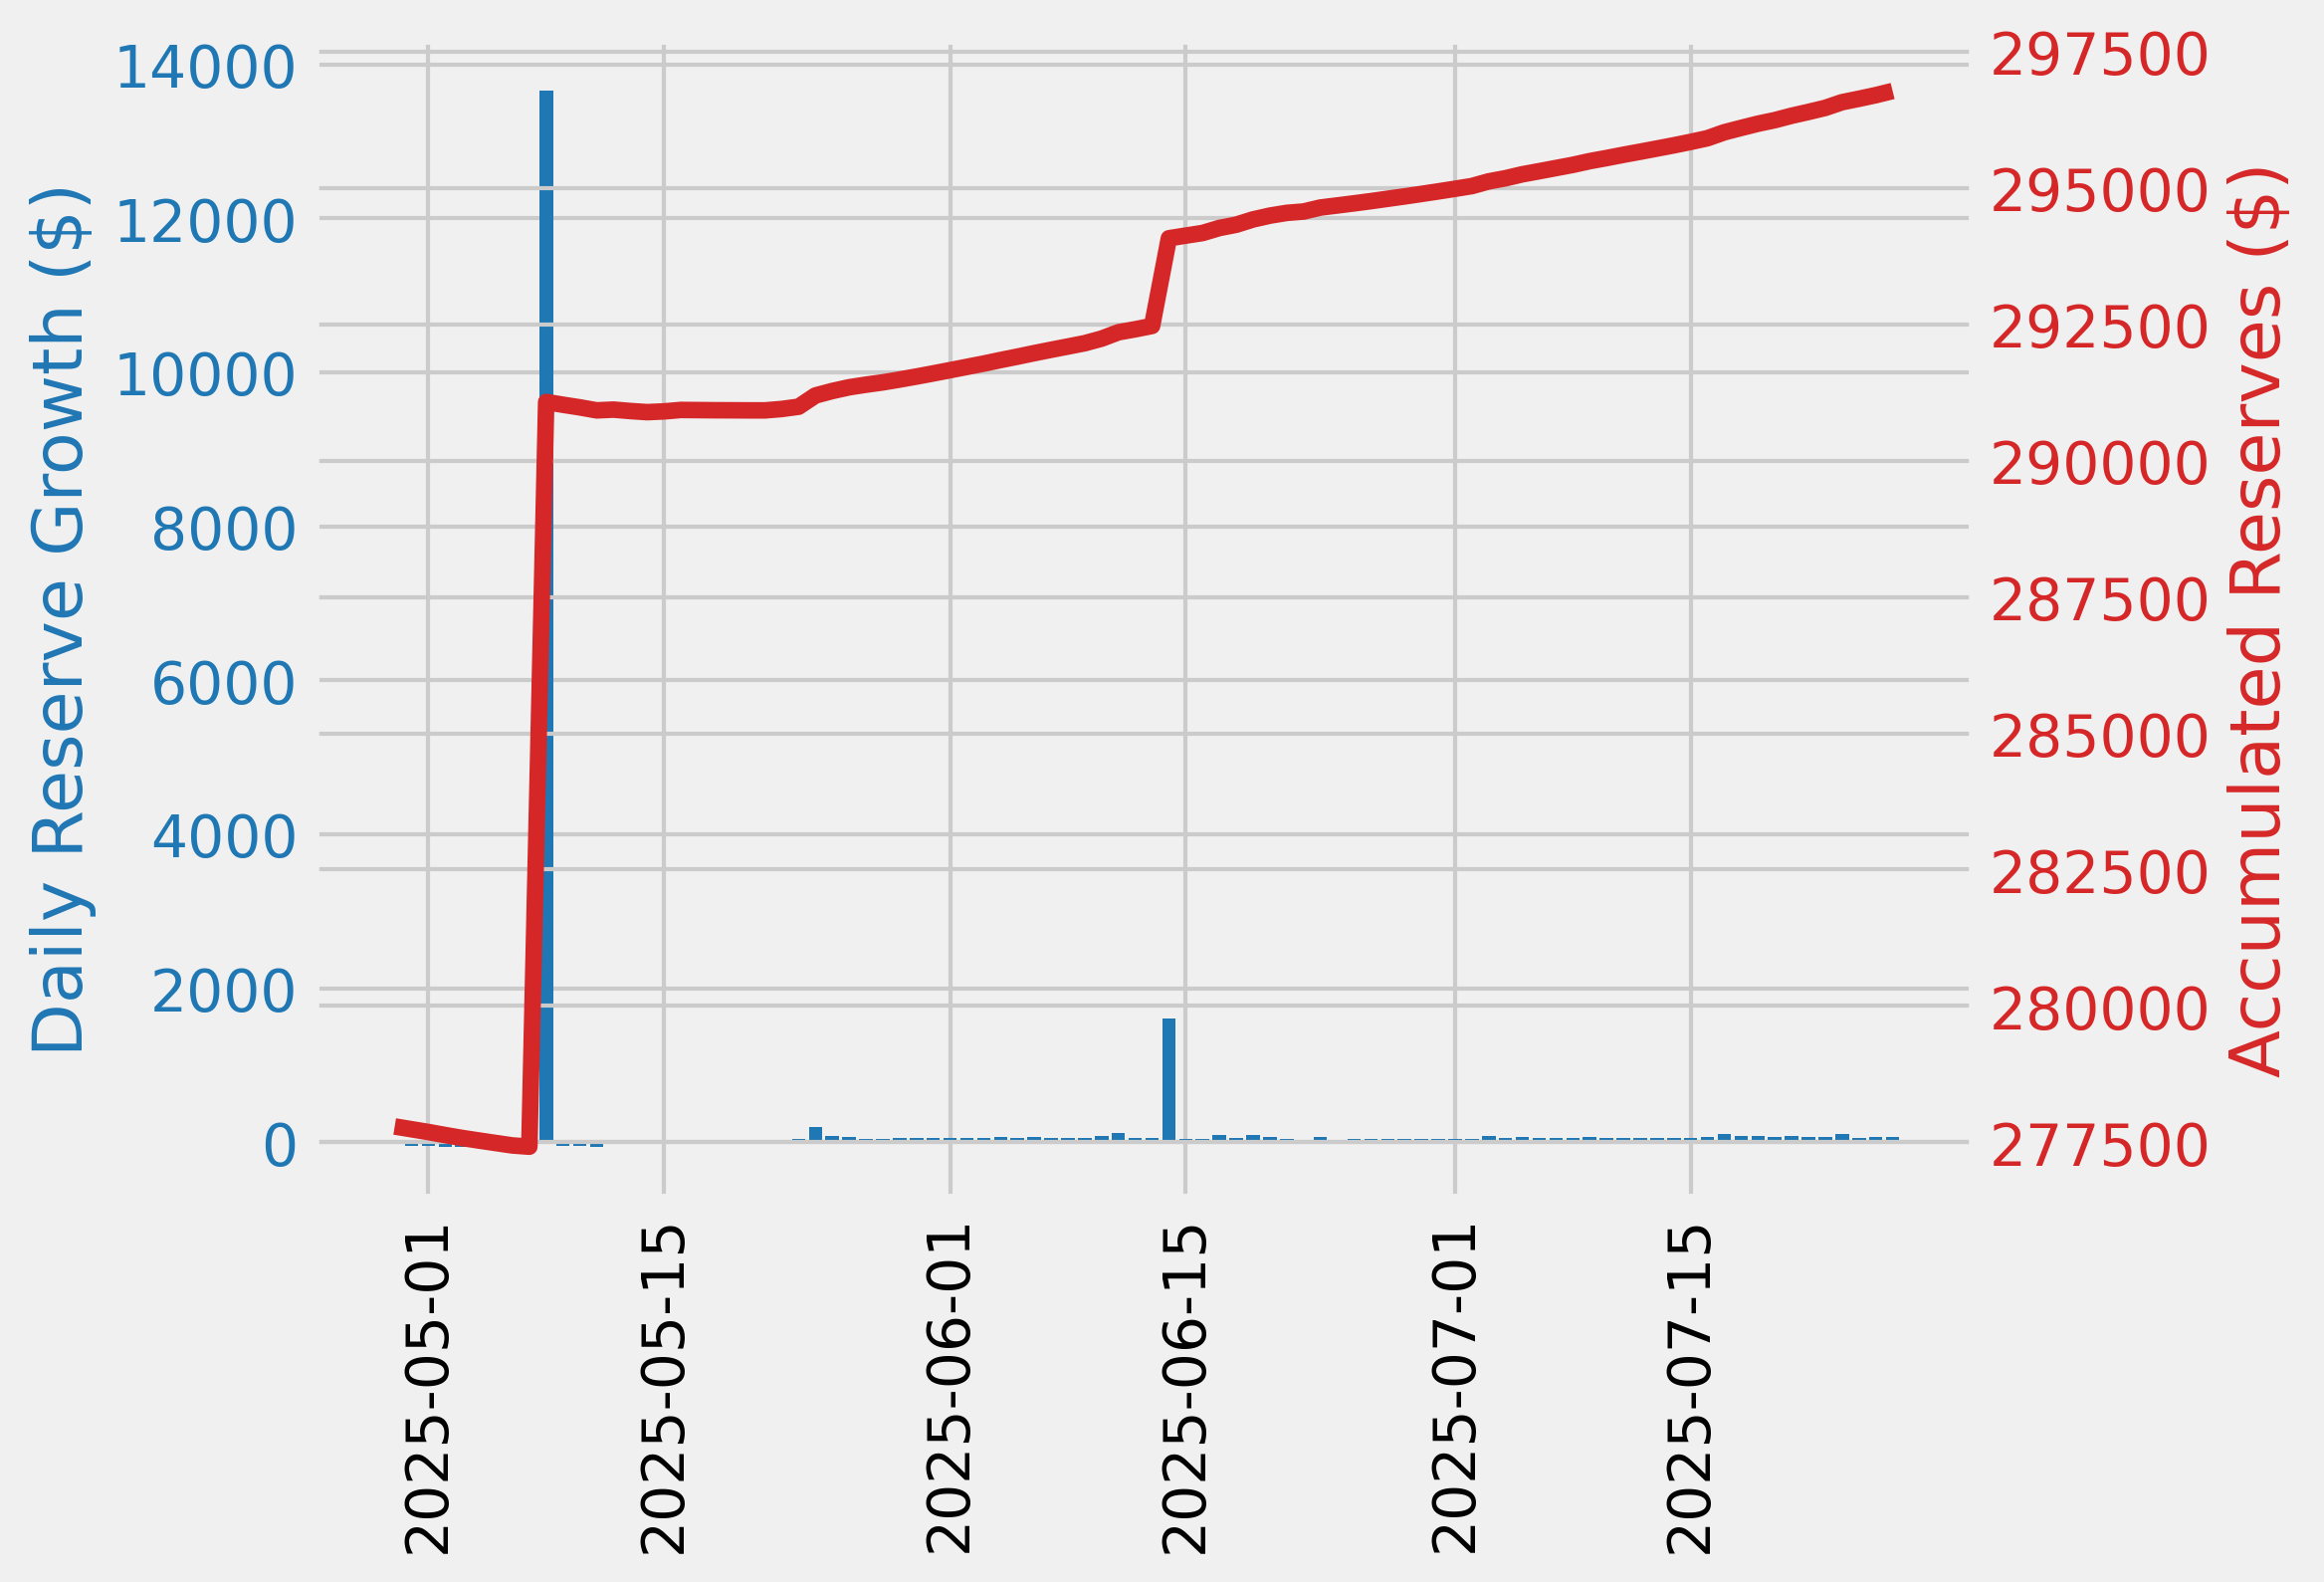
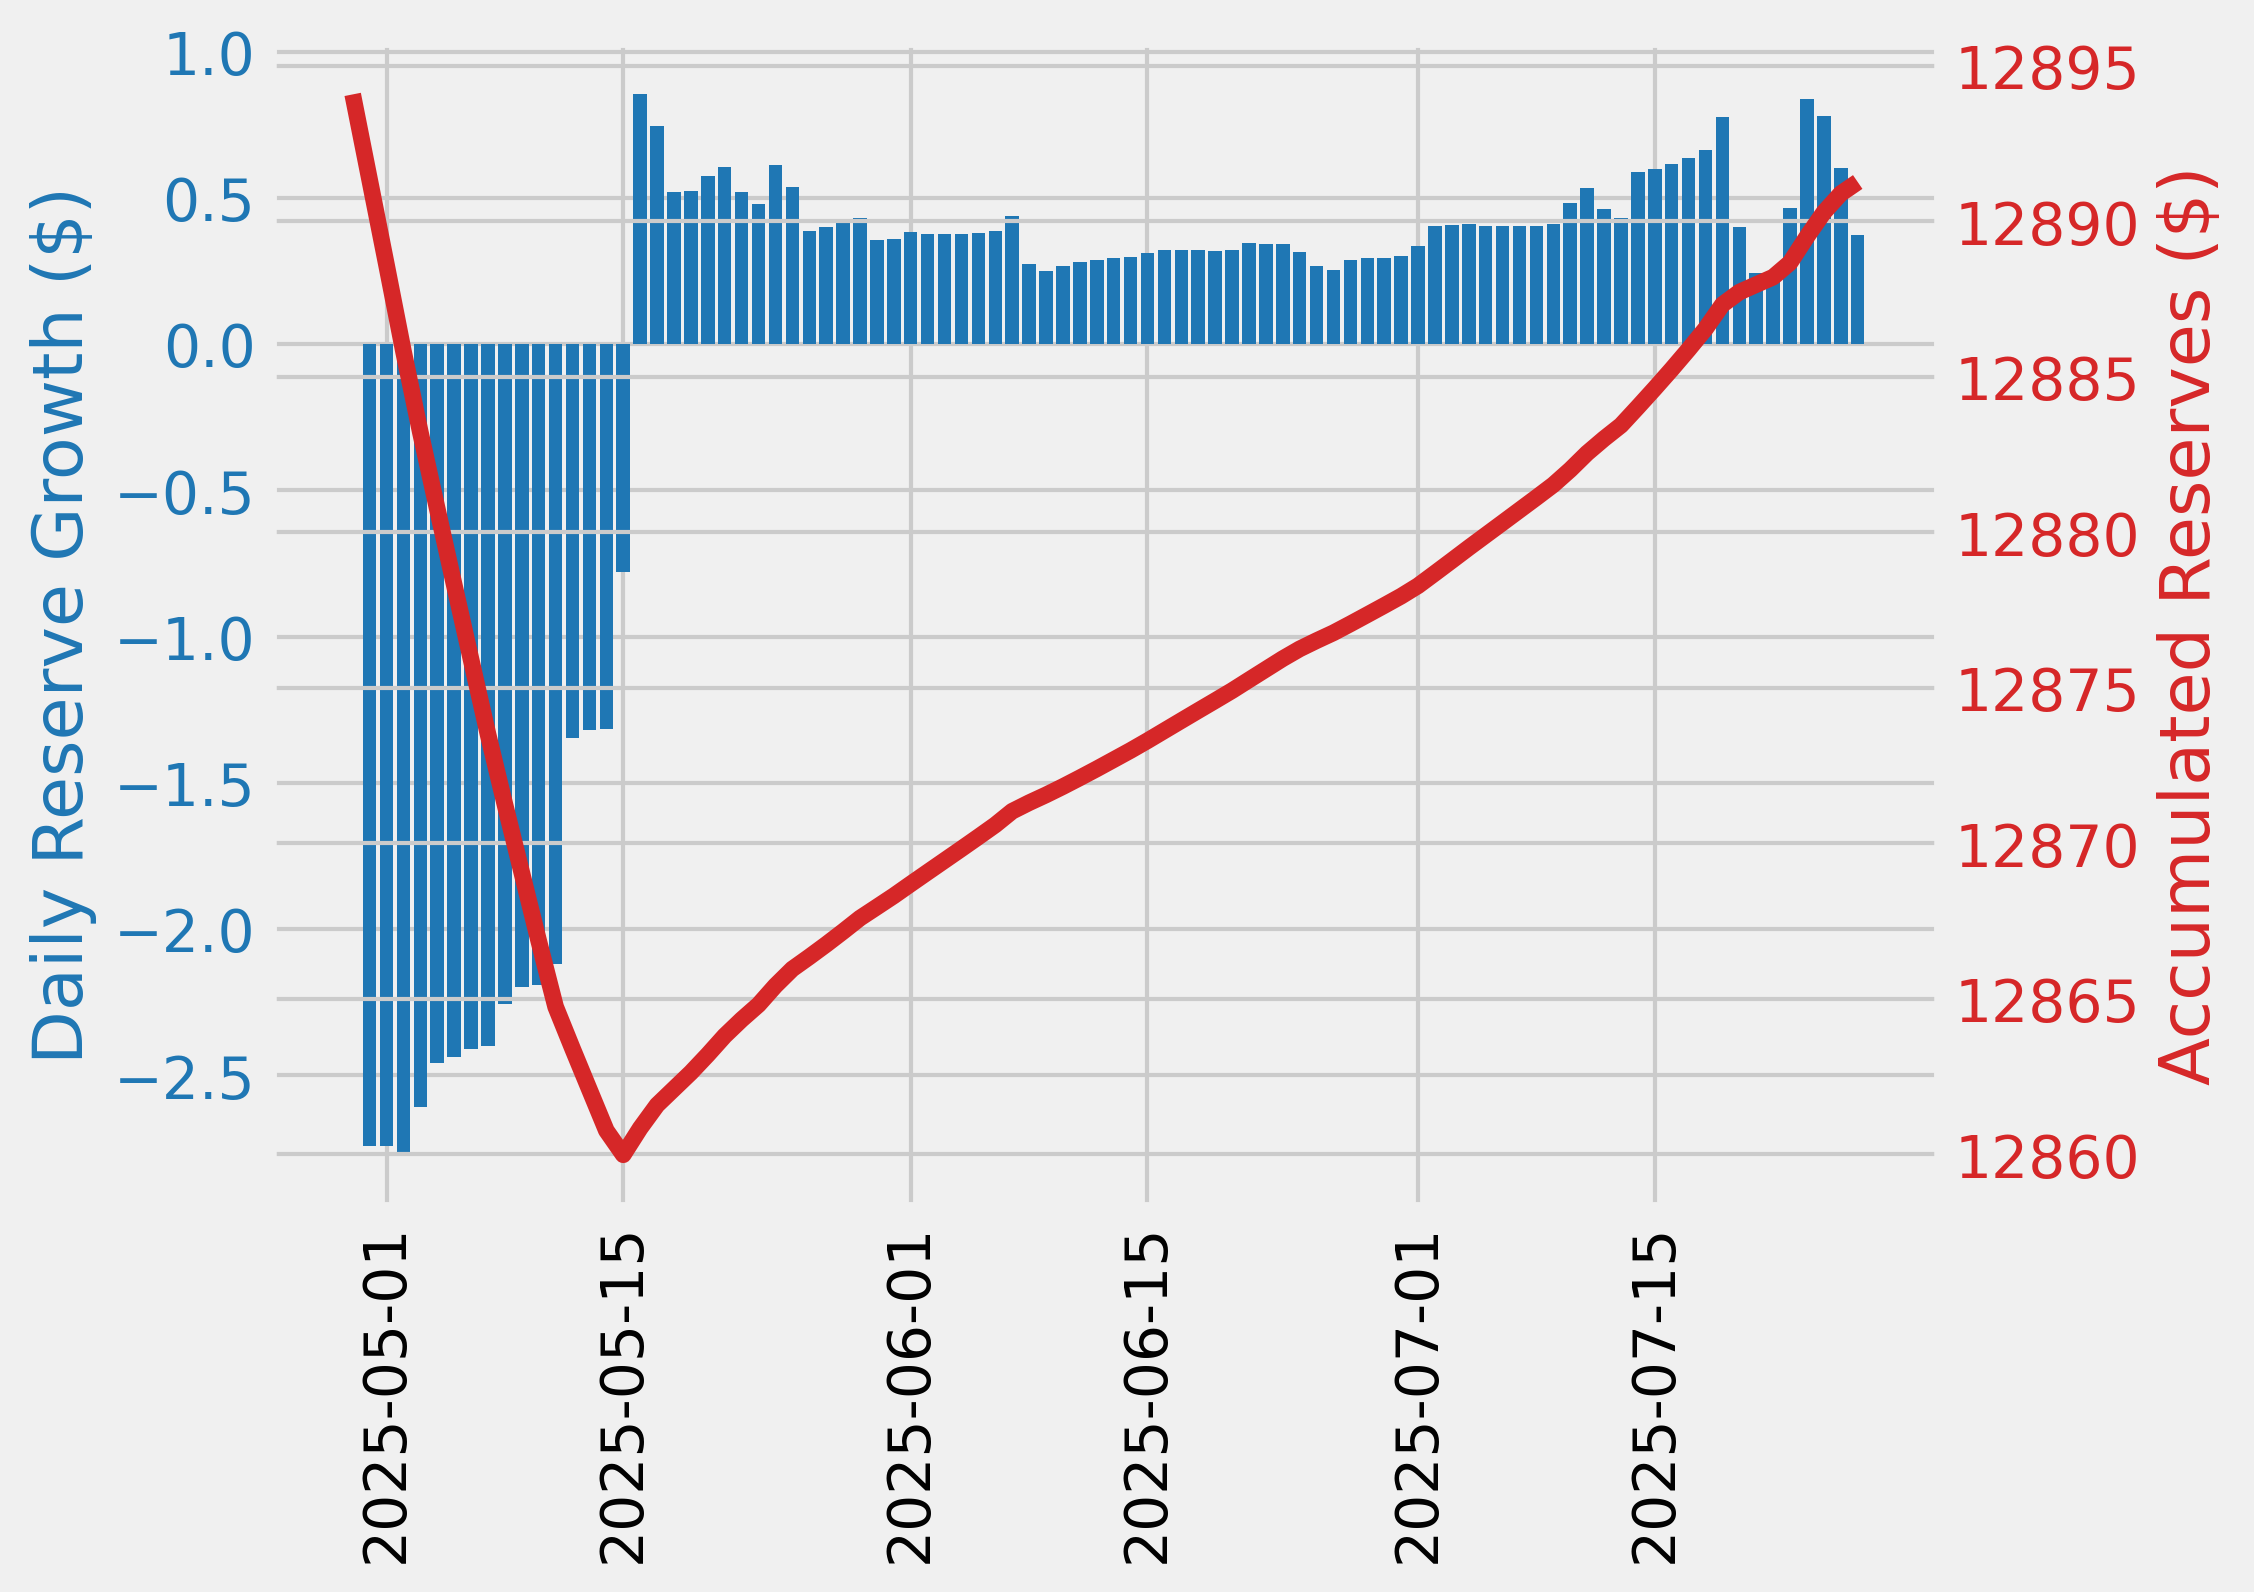
Reserve Analysis

COMP Rewards Analysis
| Chain | CometRewards COMP token holdings | Daily aggregate COMP token reward distributions | Remaining days of rewards runway (not including existing claimable rewards) |
|---|---|---|---|
| base | 0.00 | 90.00 | 0.00 |
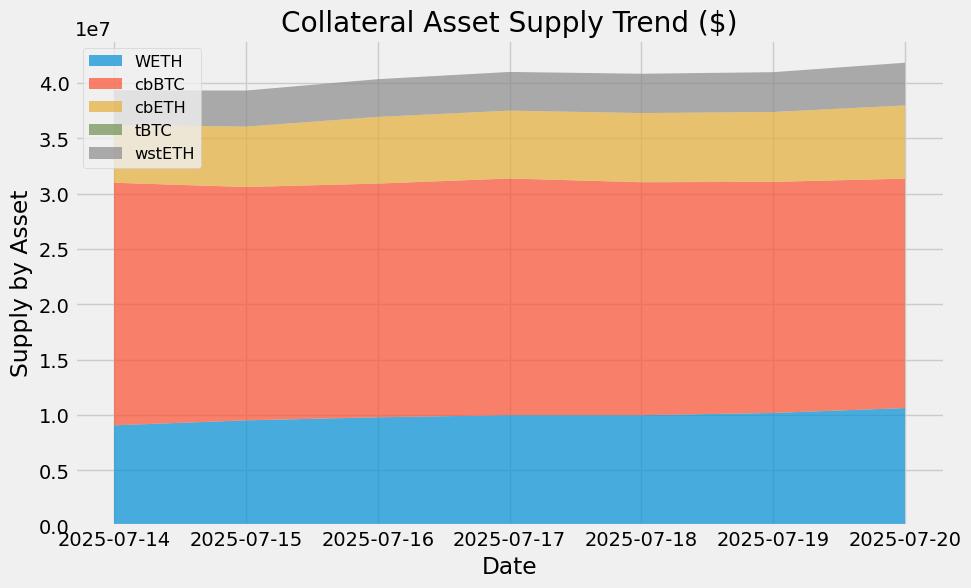
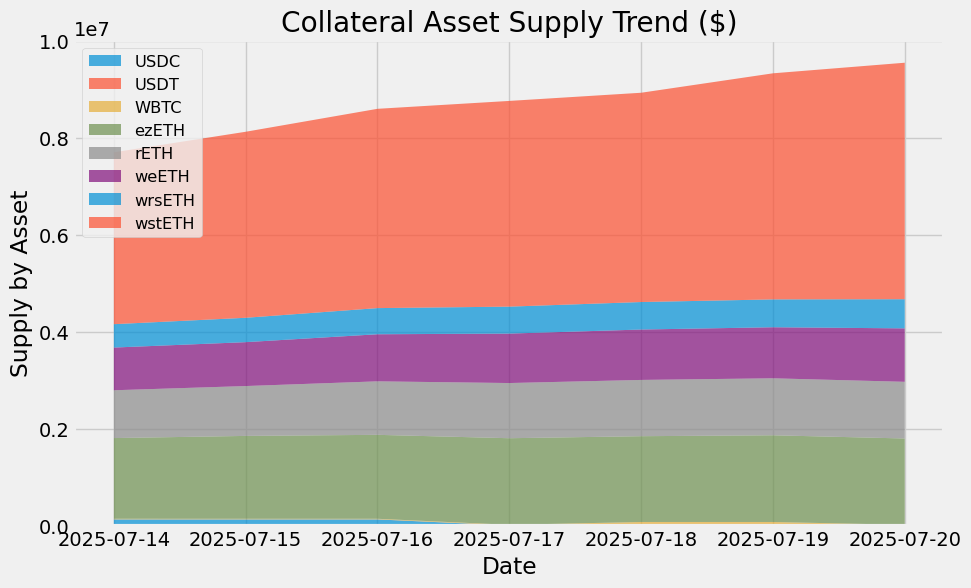
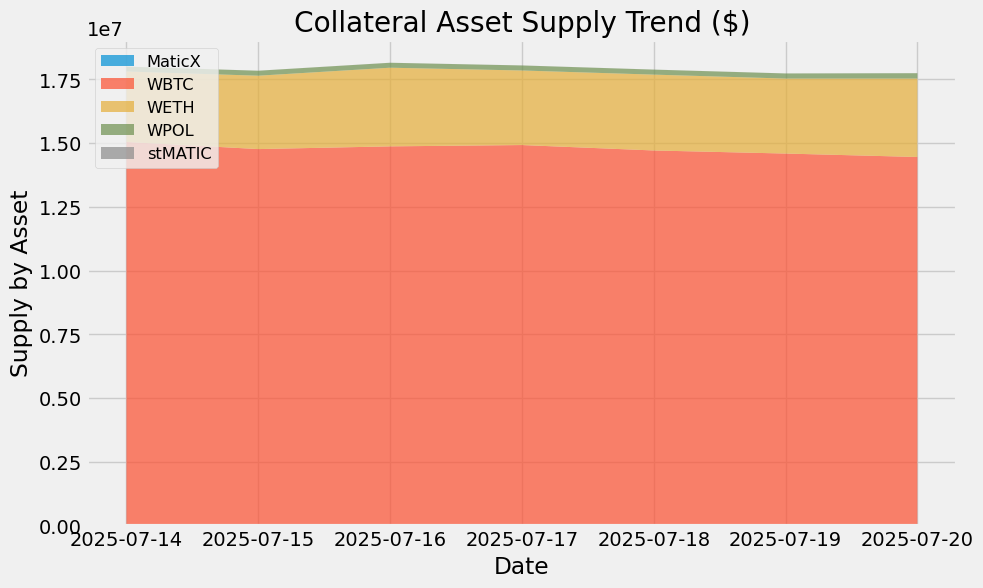
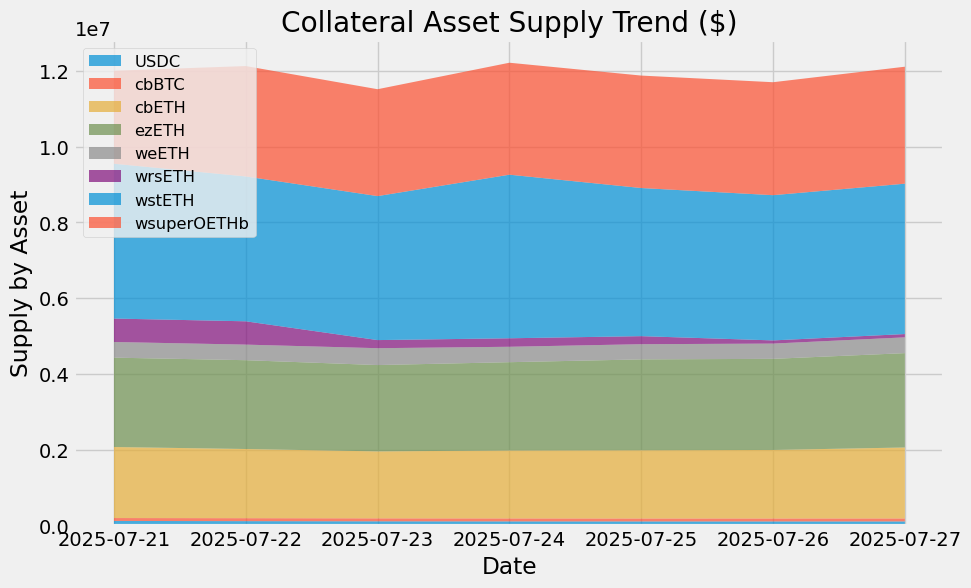
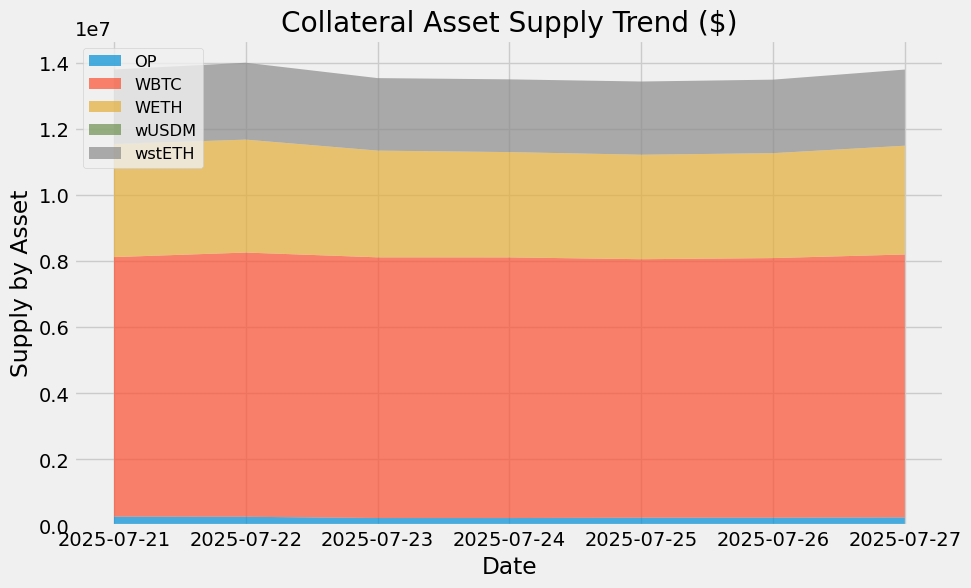
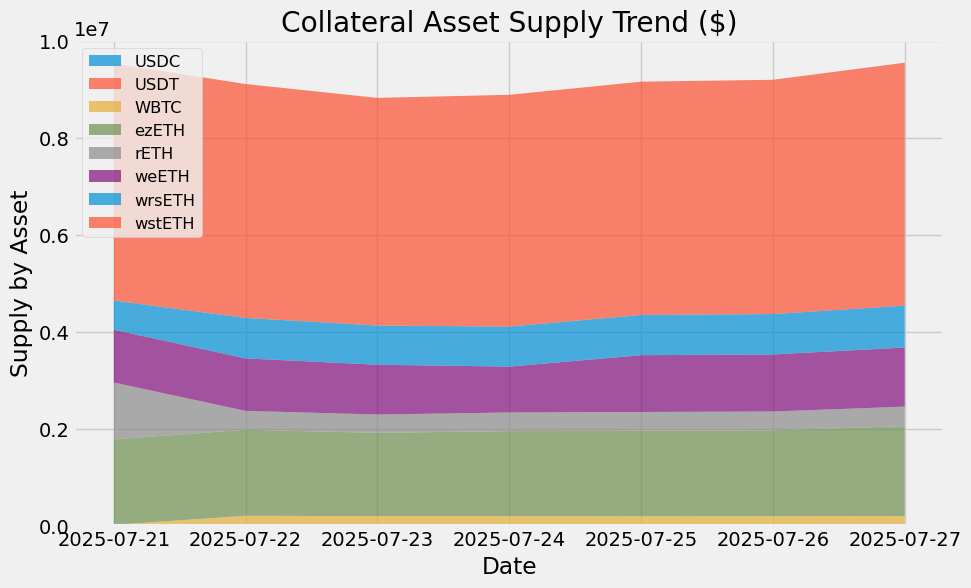
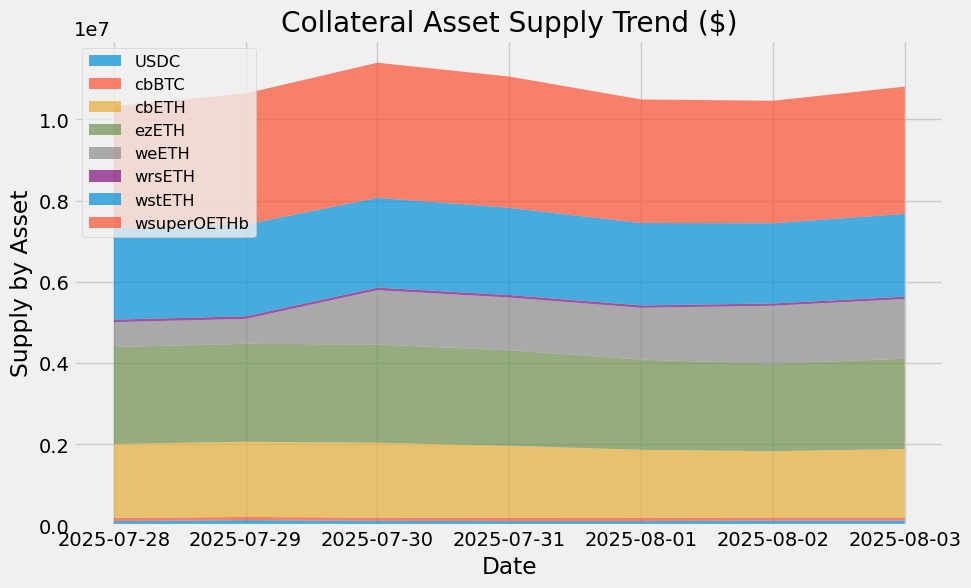
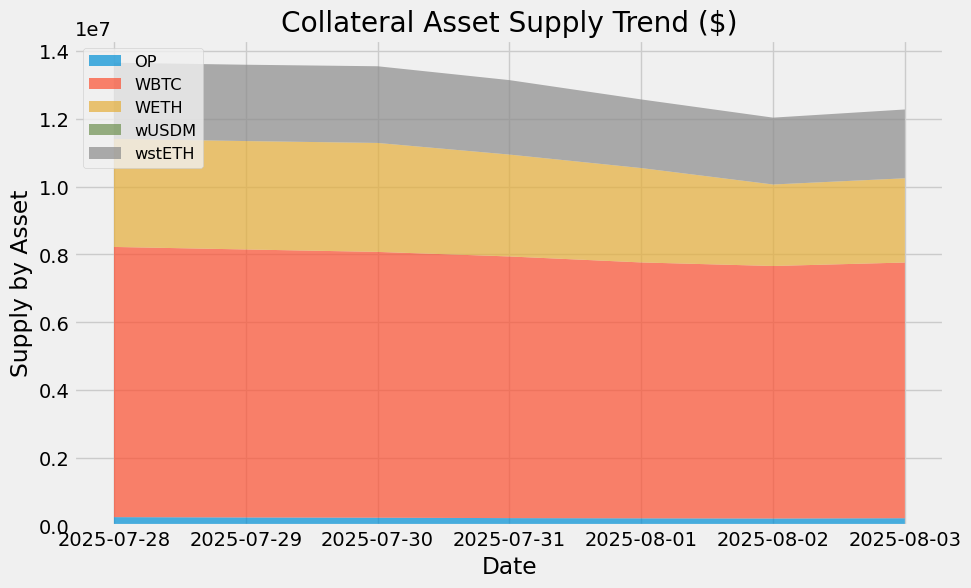
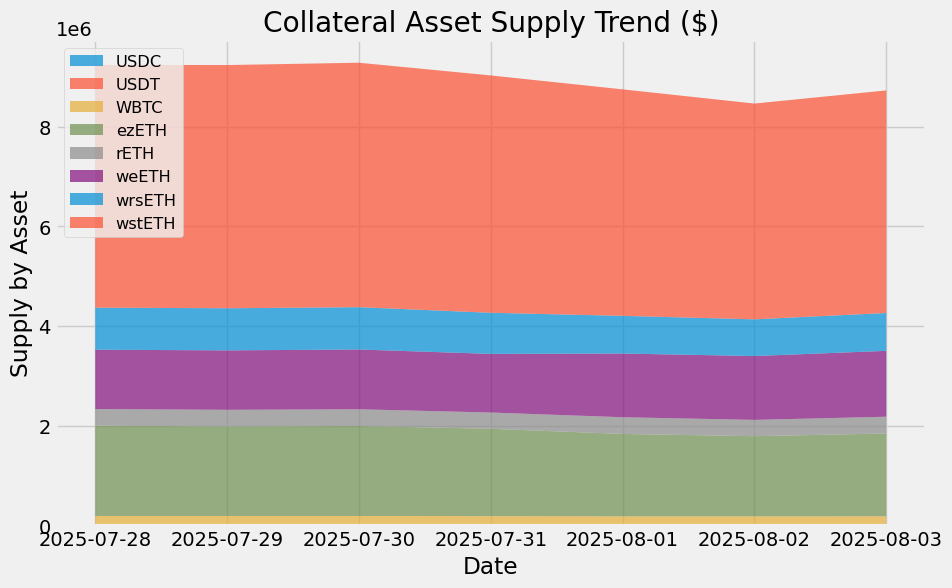
Collateral Asset Supply
This graph shows the trend of total supply of all collateral assets.

To see updated statistics, please see the live version of this graph here.
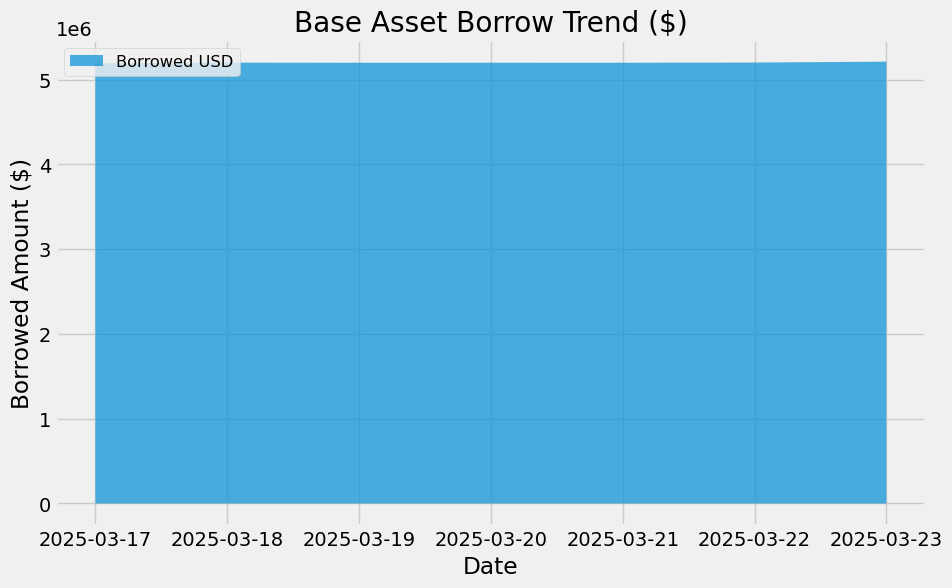
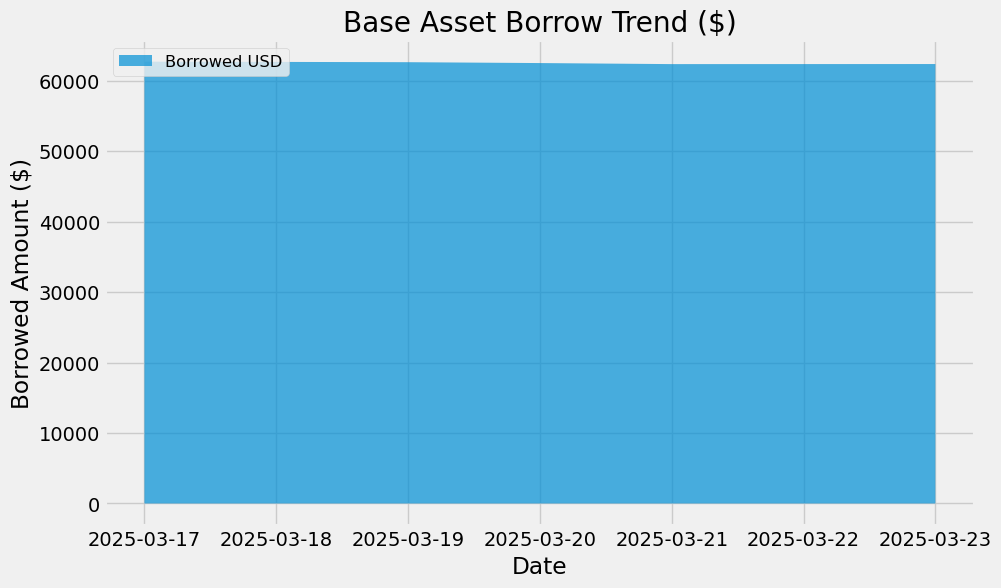
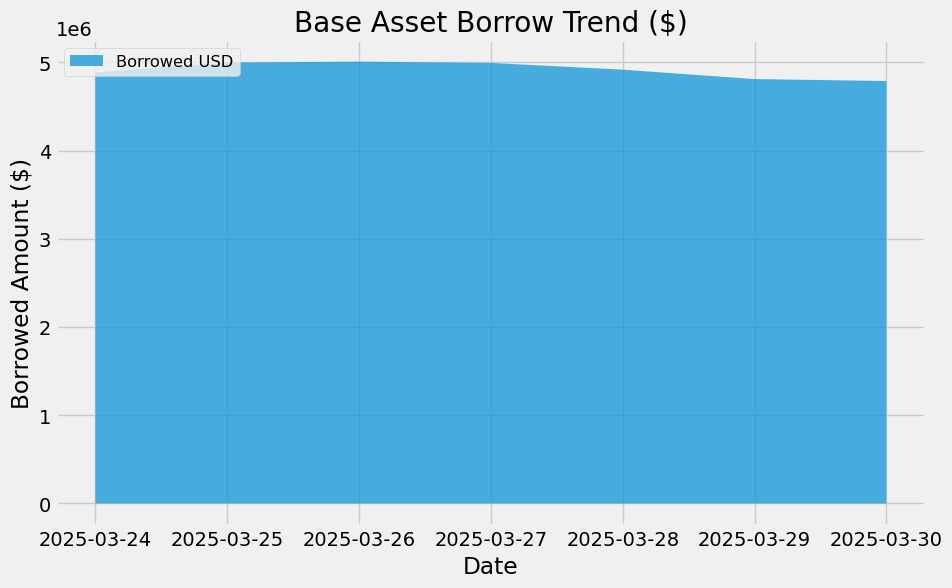
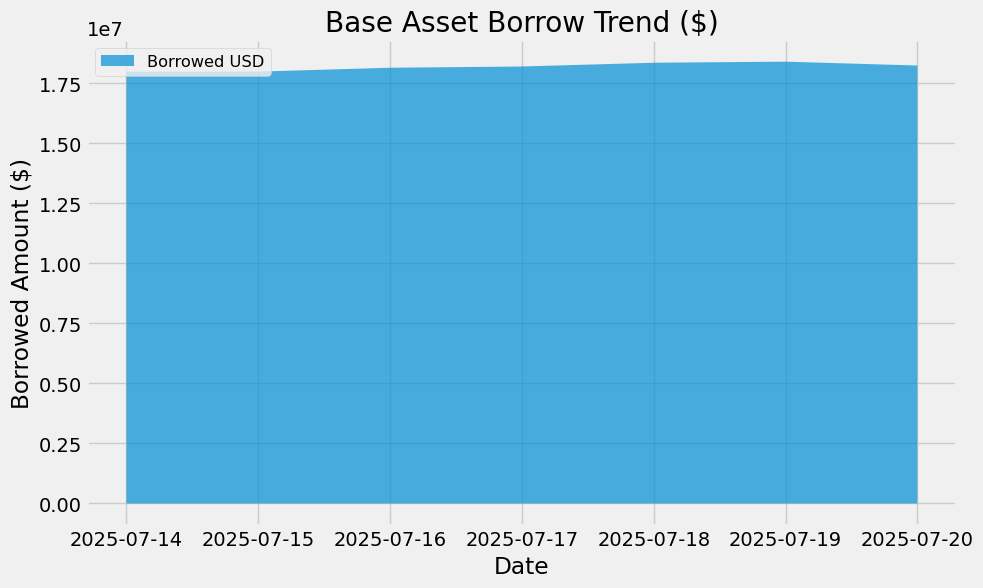
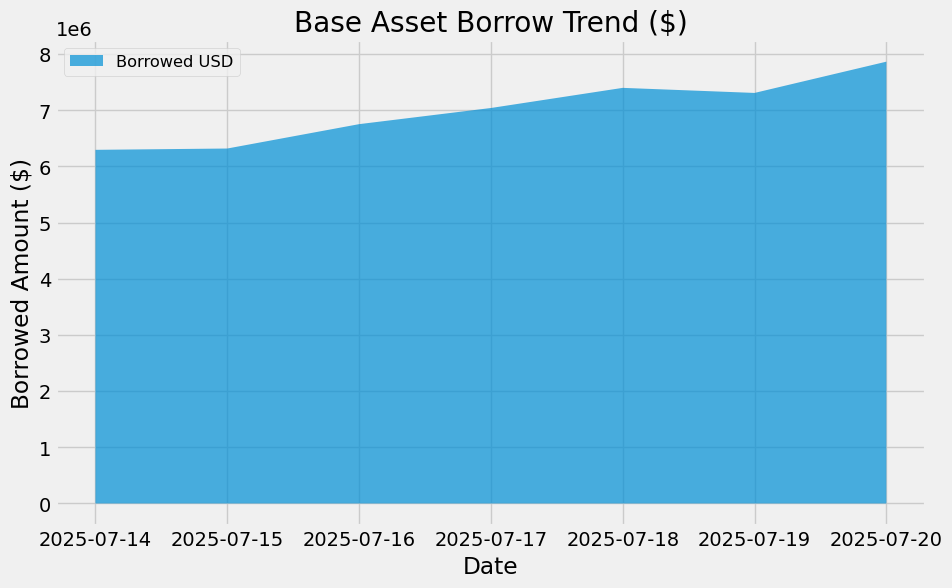
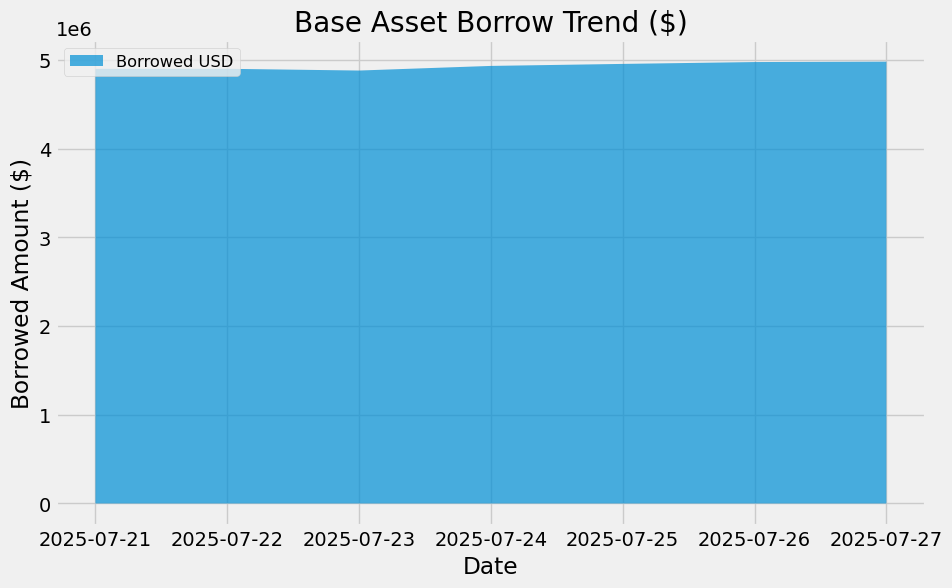
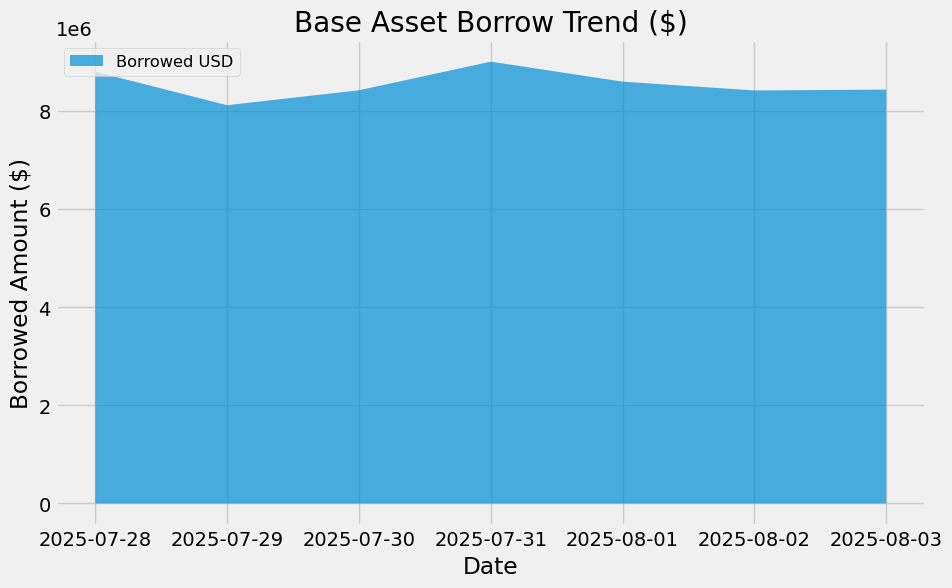
Base Asset Borrows
This graph shows the trend of total borrows of the base asset.

To see updated statistics, please see the live version of this graph here.
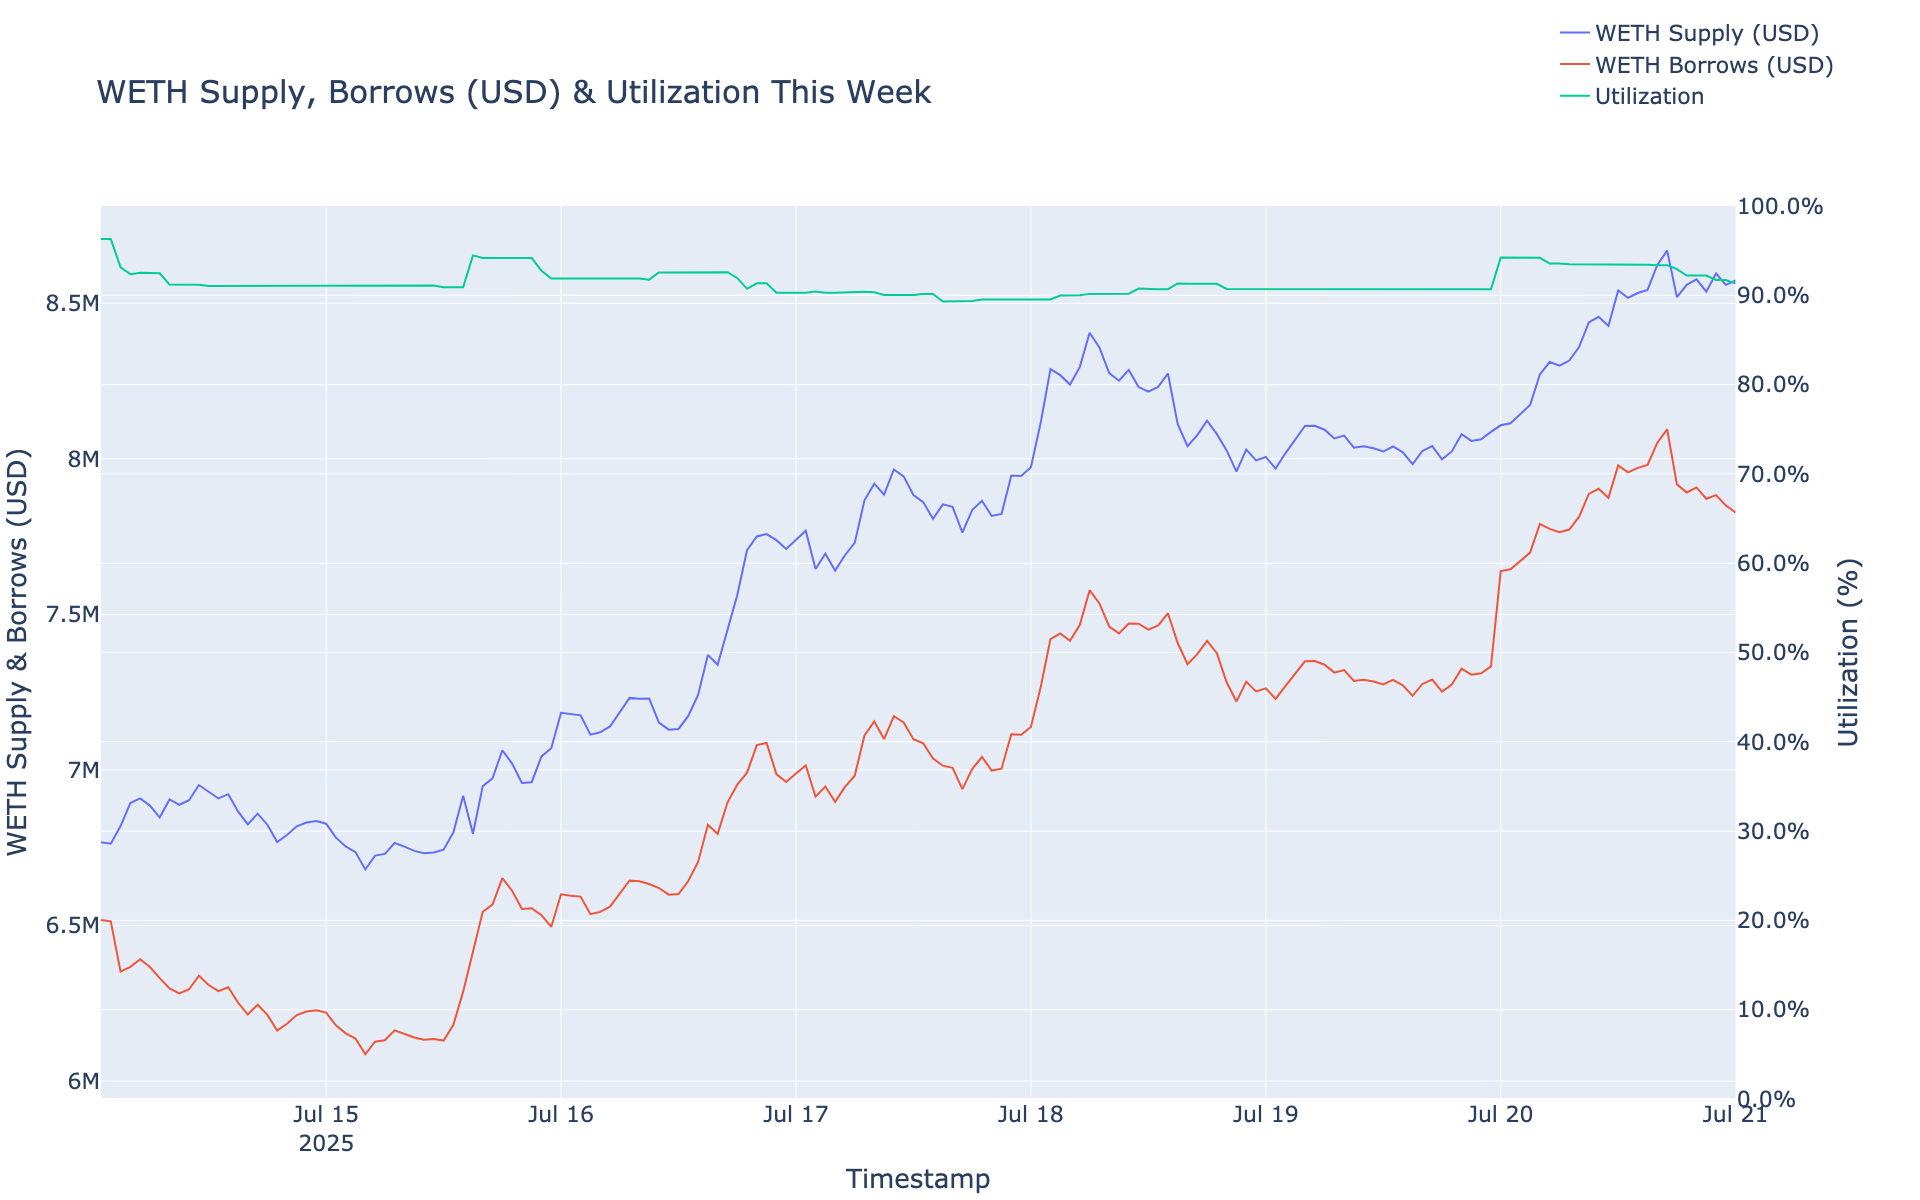
Utilization
This graph shows the utilization (borrow / supply) of the base asset over the past week.

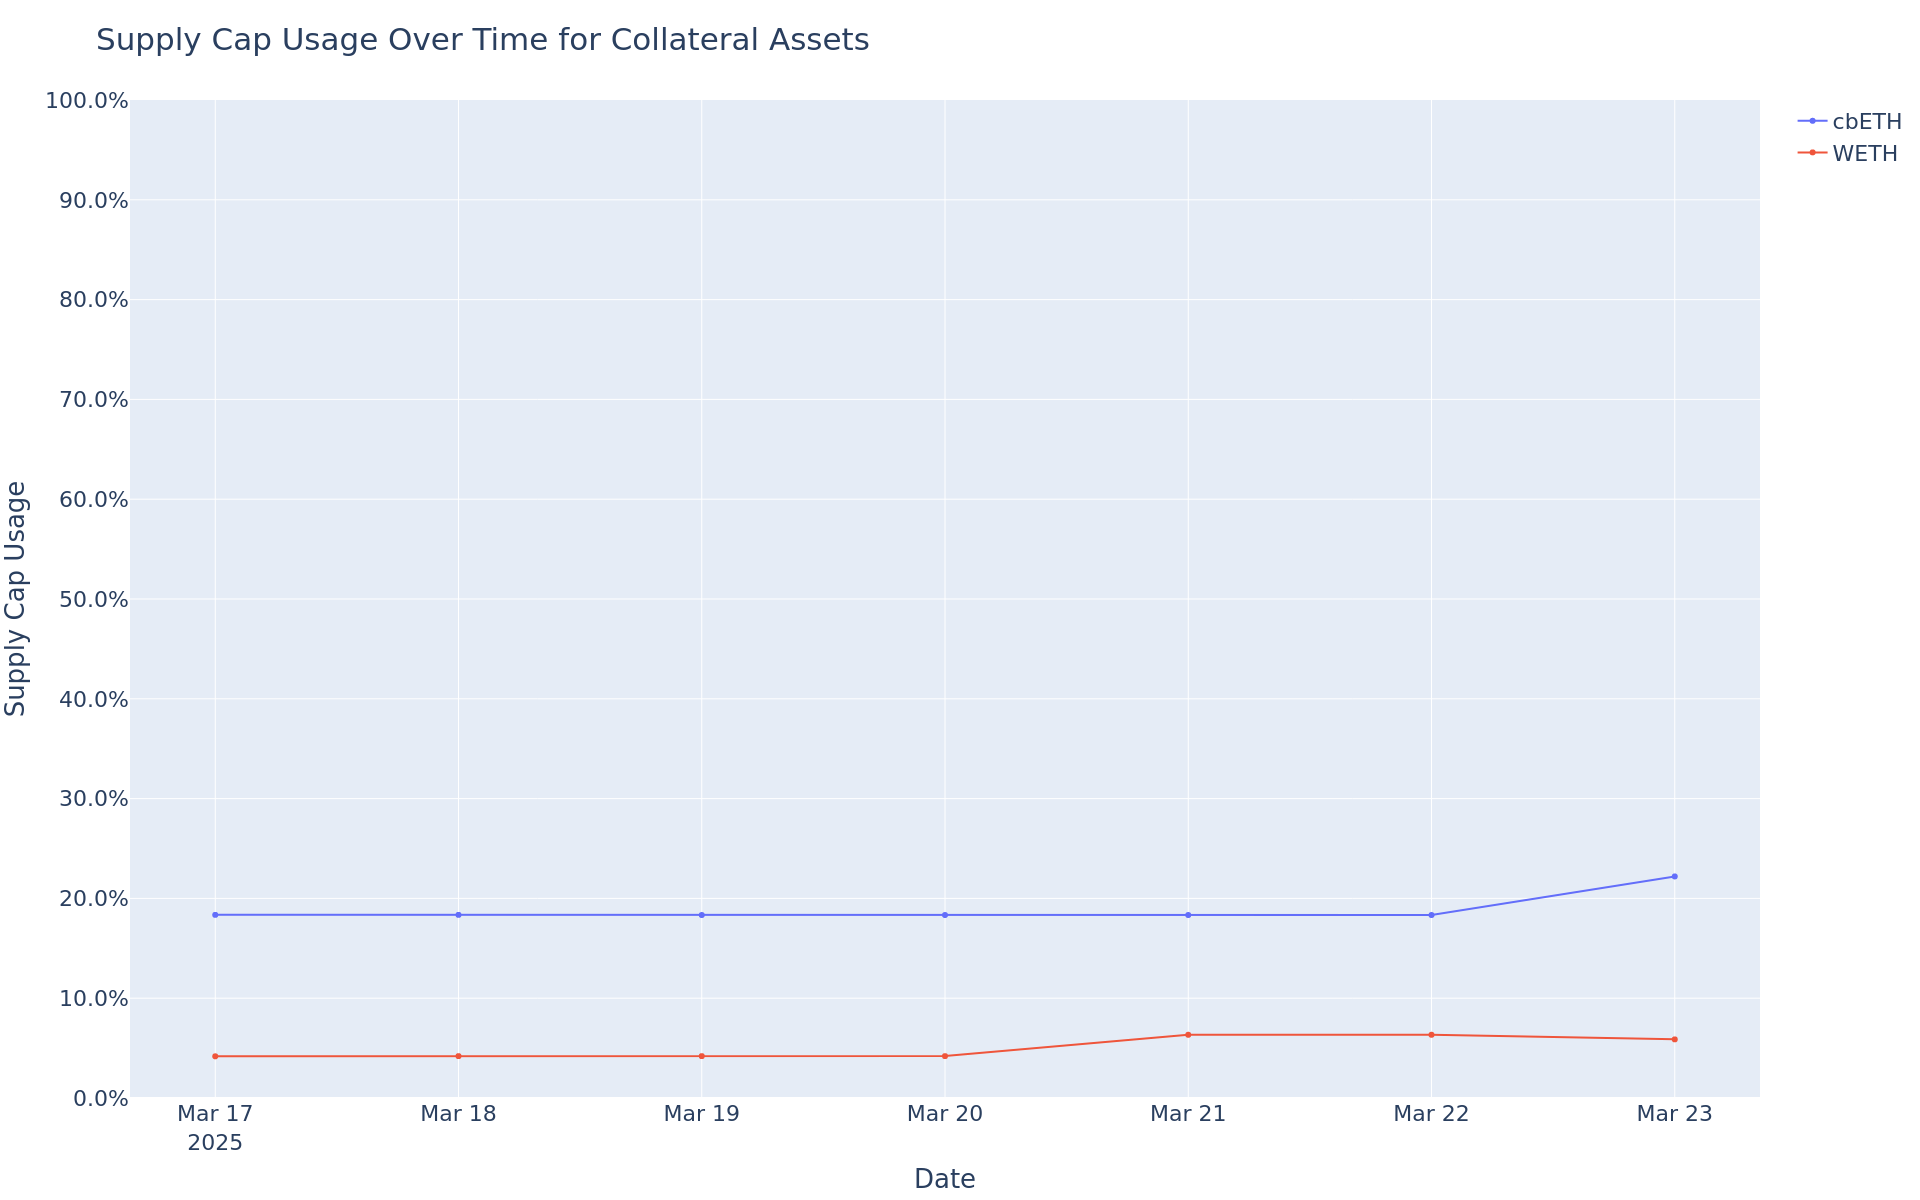
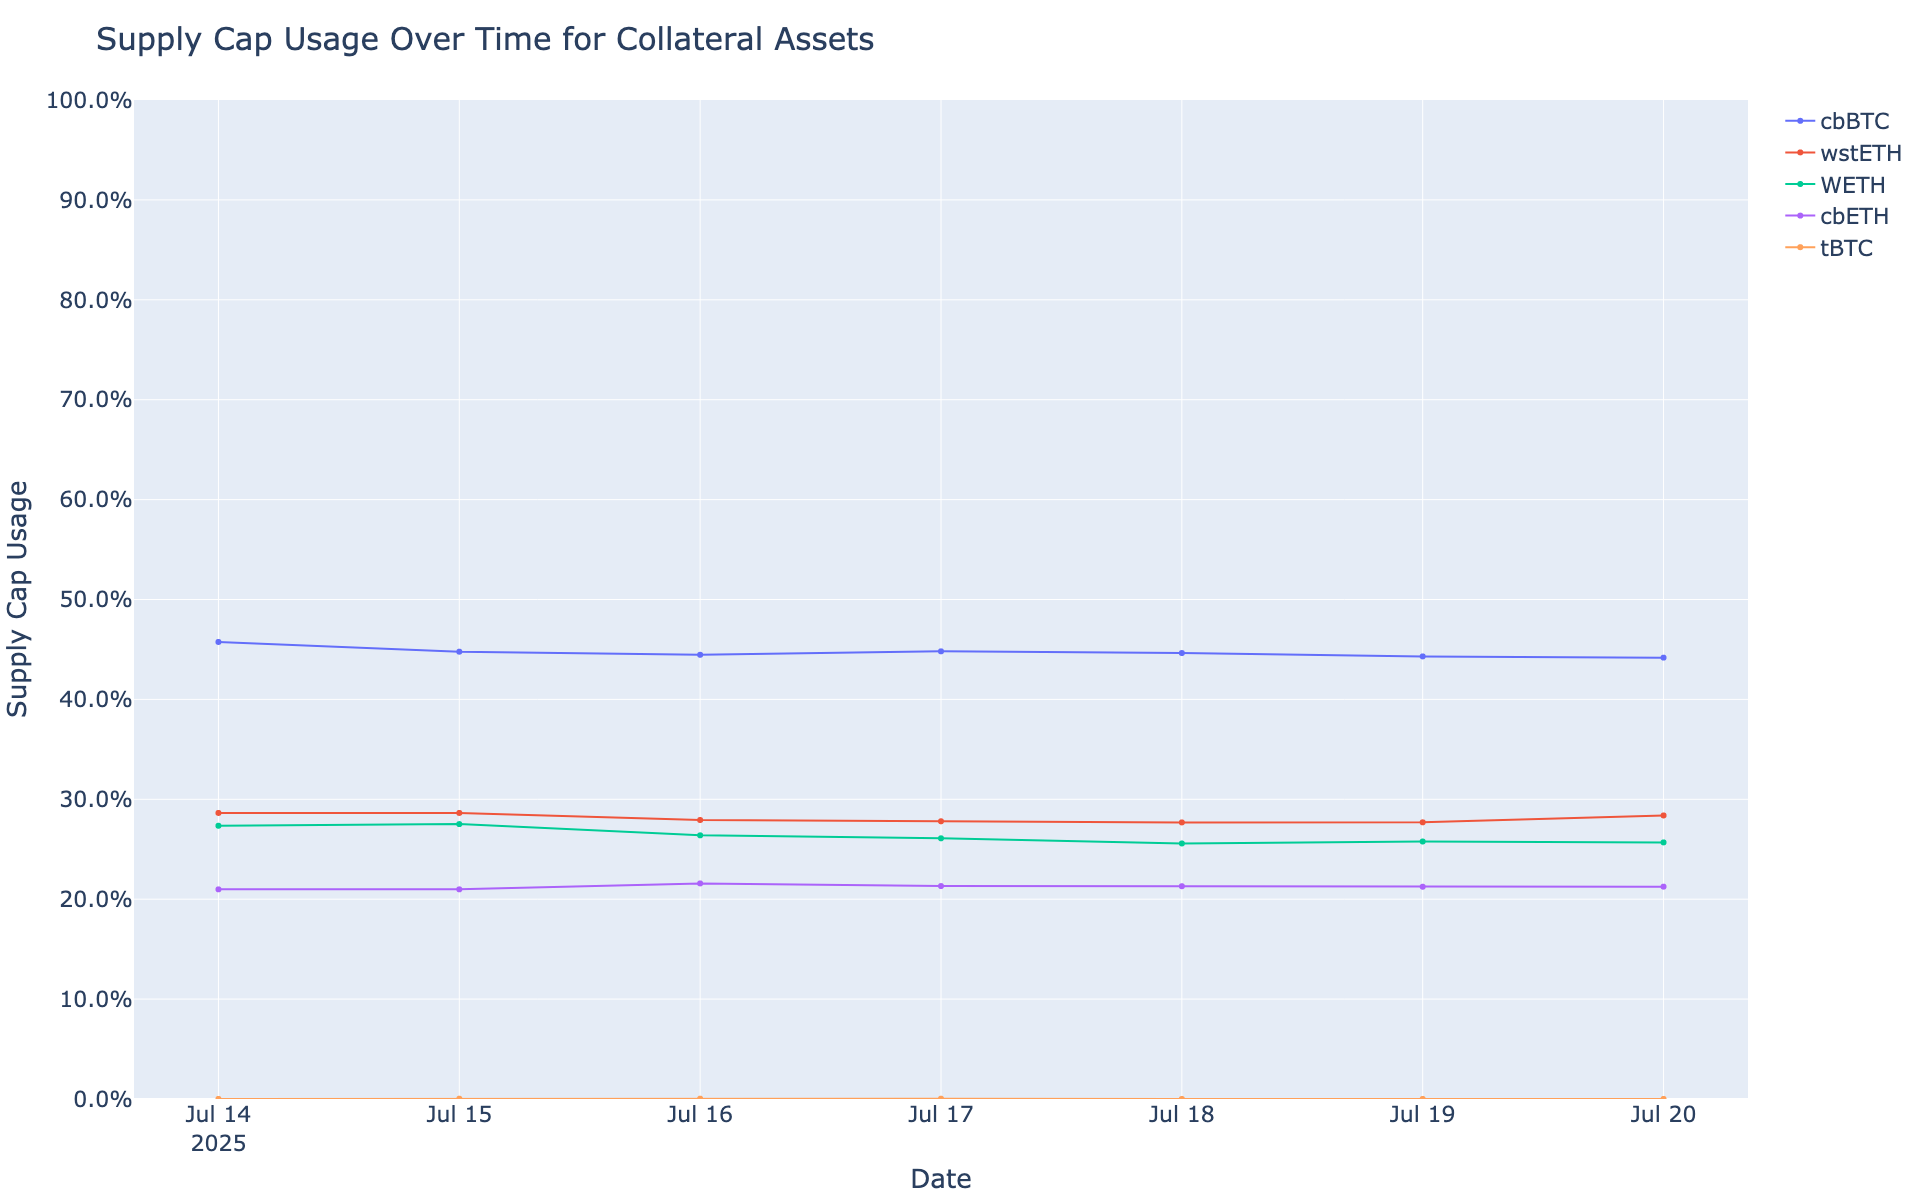
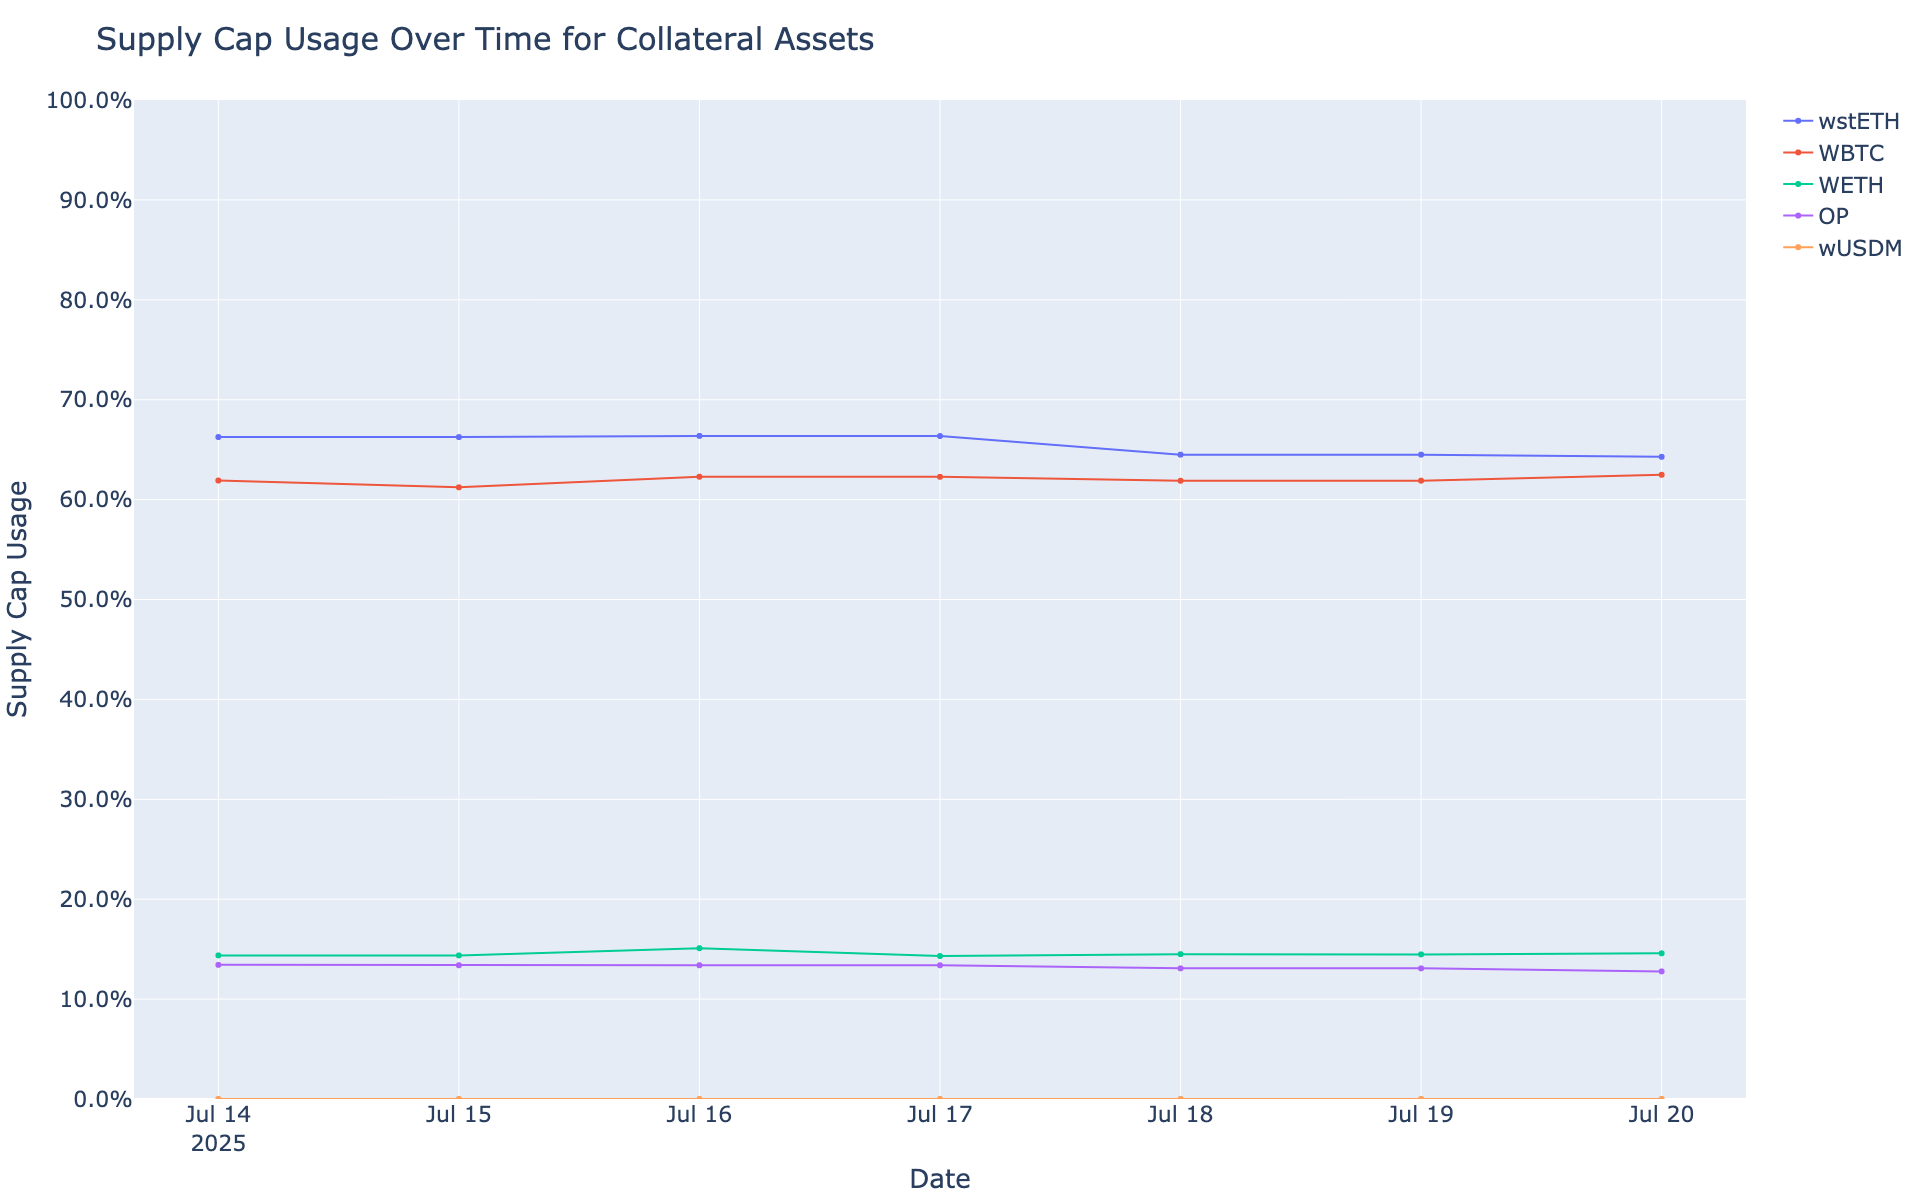
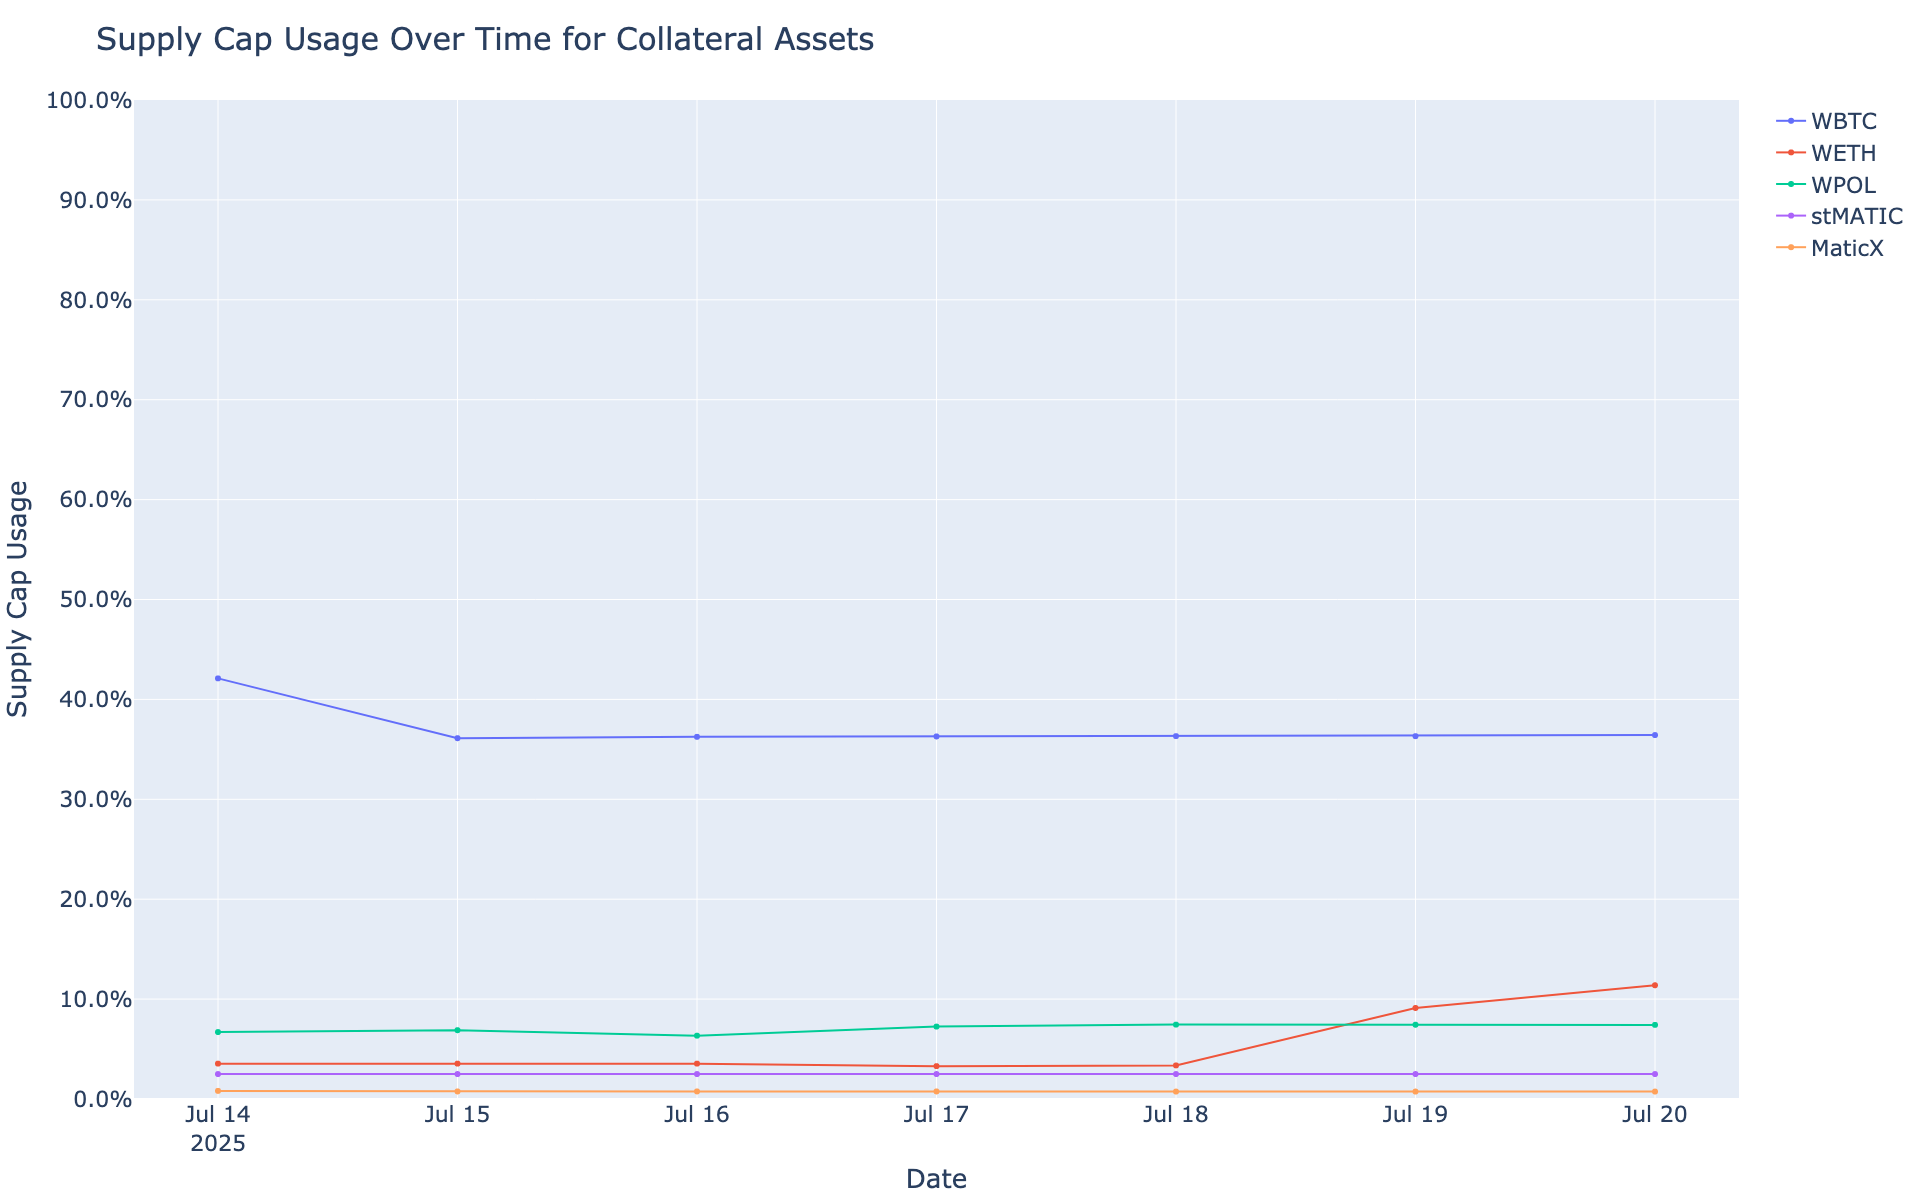
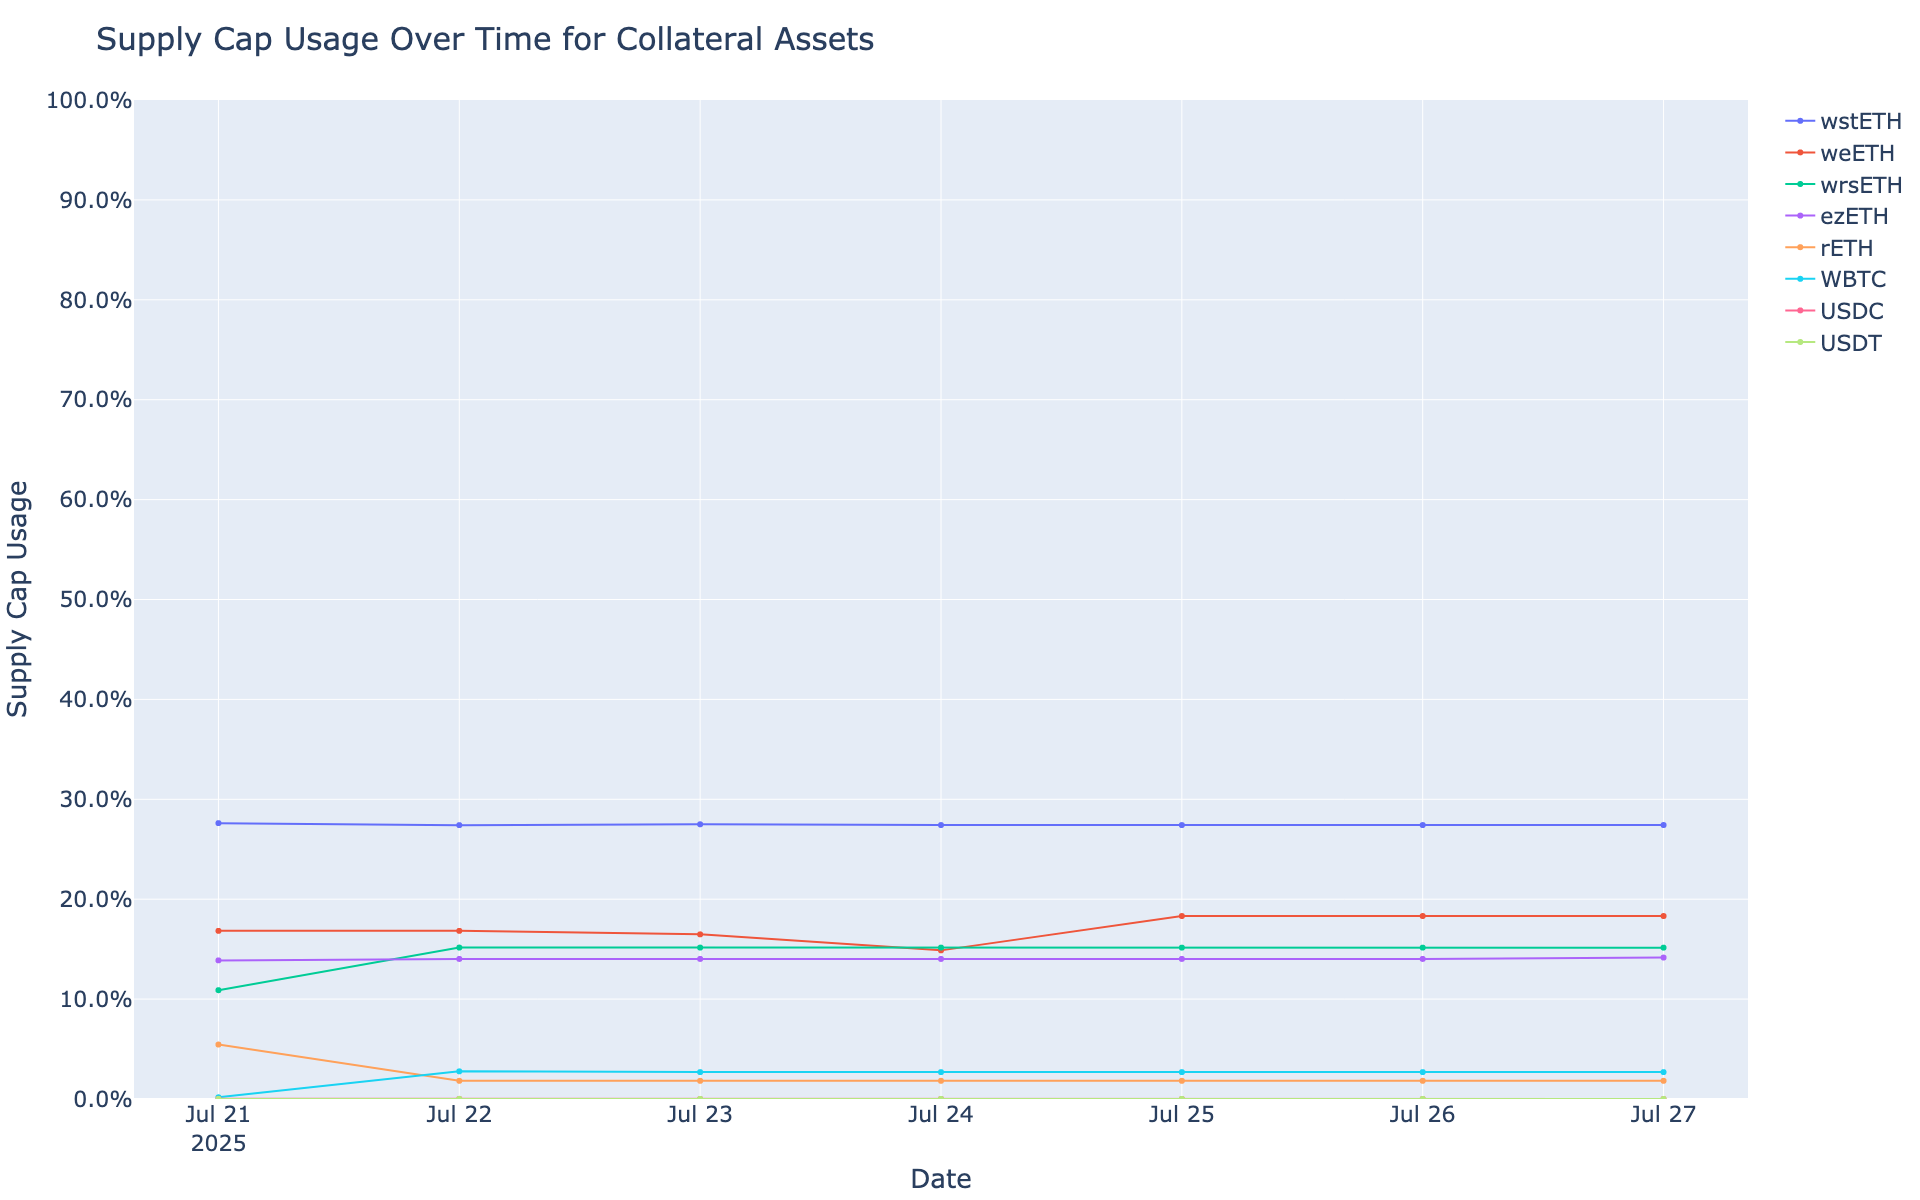
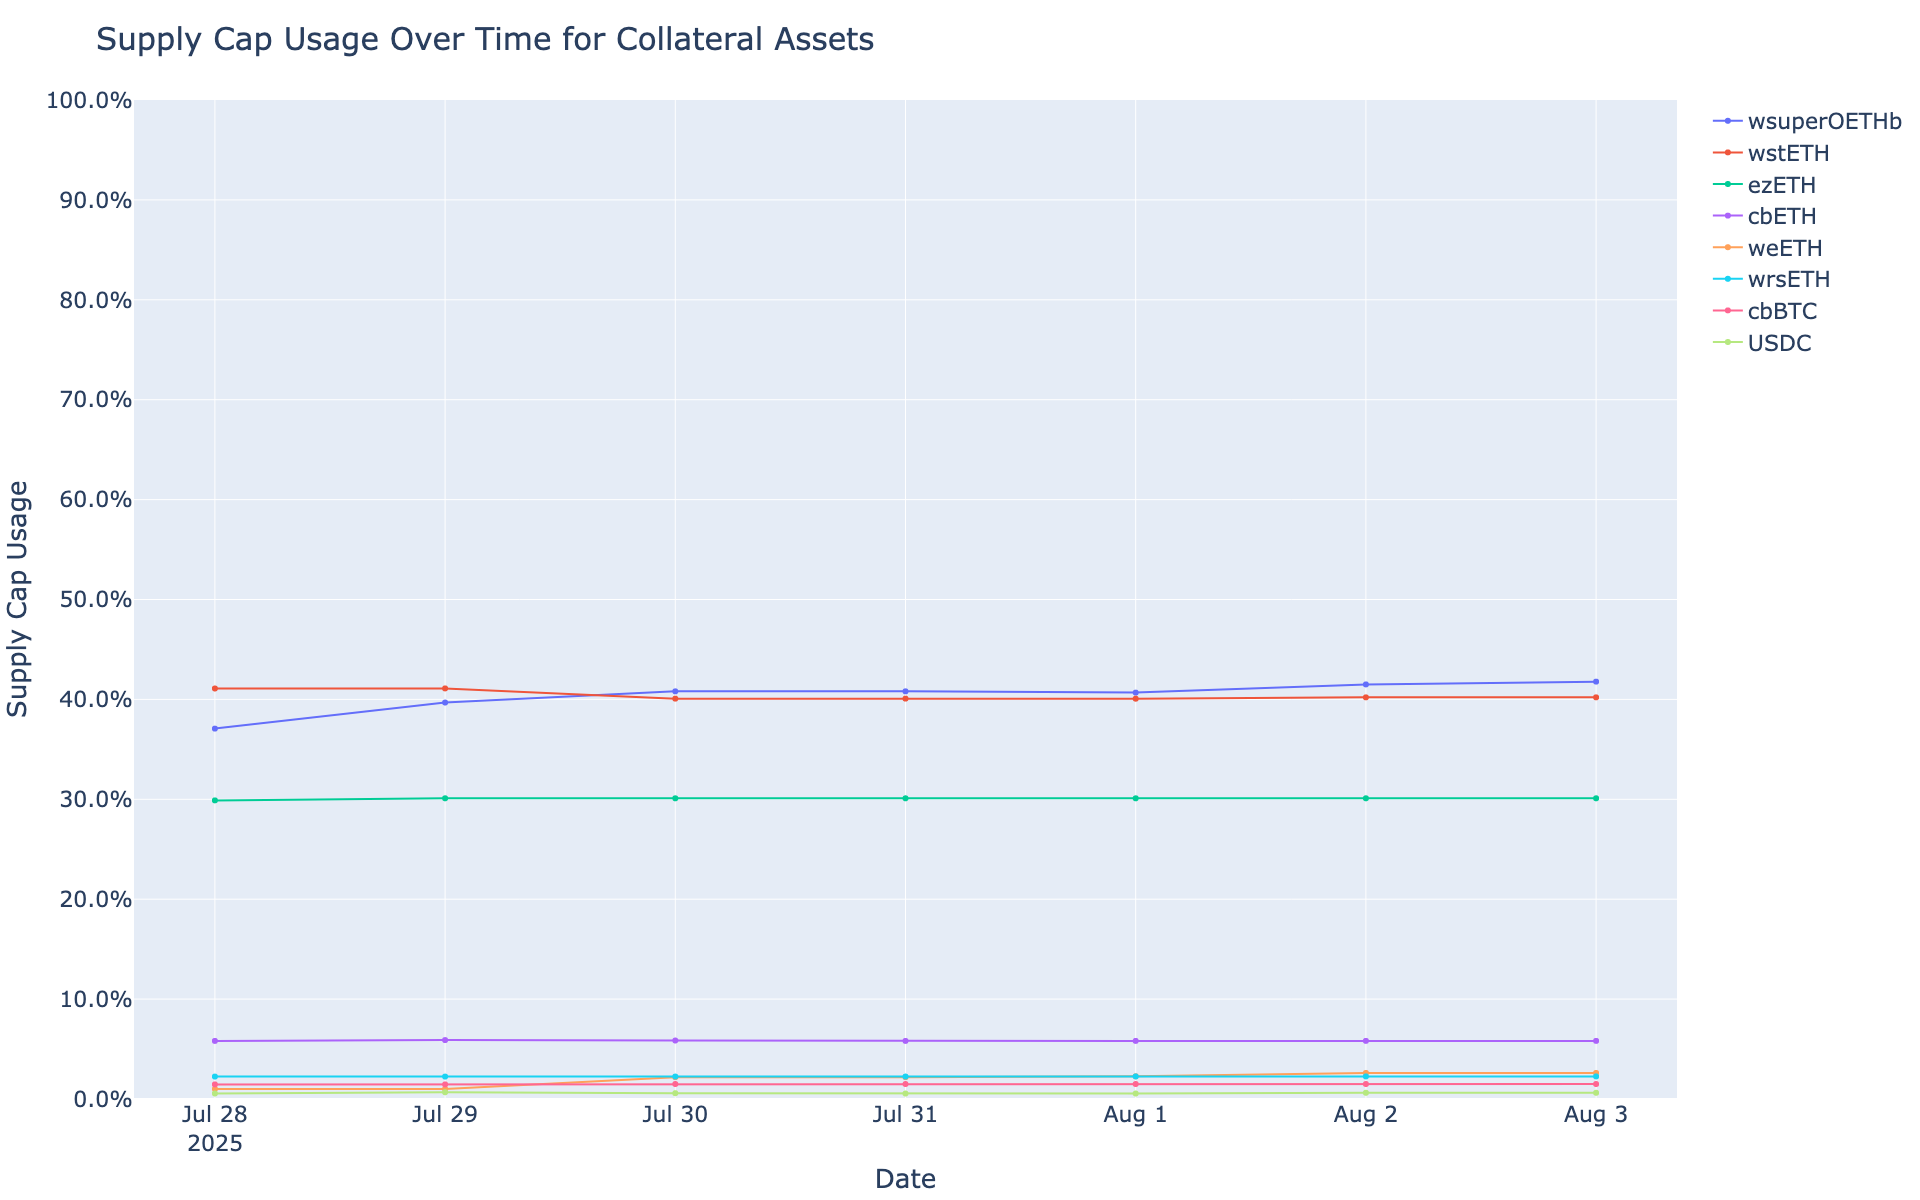
Supply Cap Usage
This graph shows the supply cap usage (supply / supply cap) of all collateral assets over the past week.

base USDbC Comet
Simple Summary
-
USDbC Borrows decreased 37.37%, from $142.29K to $89.11K.
-
USDbC Supply increased 2.50%, from $229.88K to $235.62K.
-
USDbC utilization decreased 38.90%, from 61.90% to 37.82%.
-
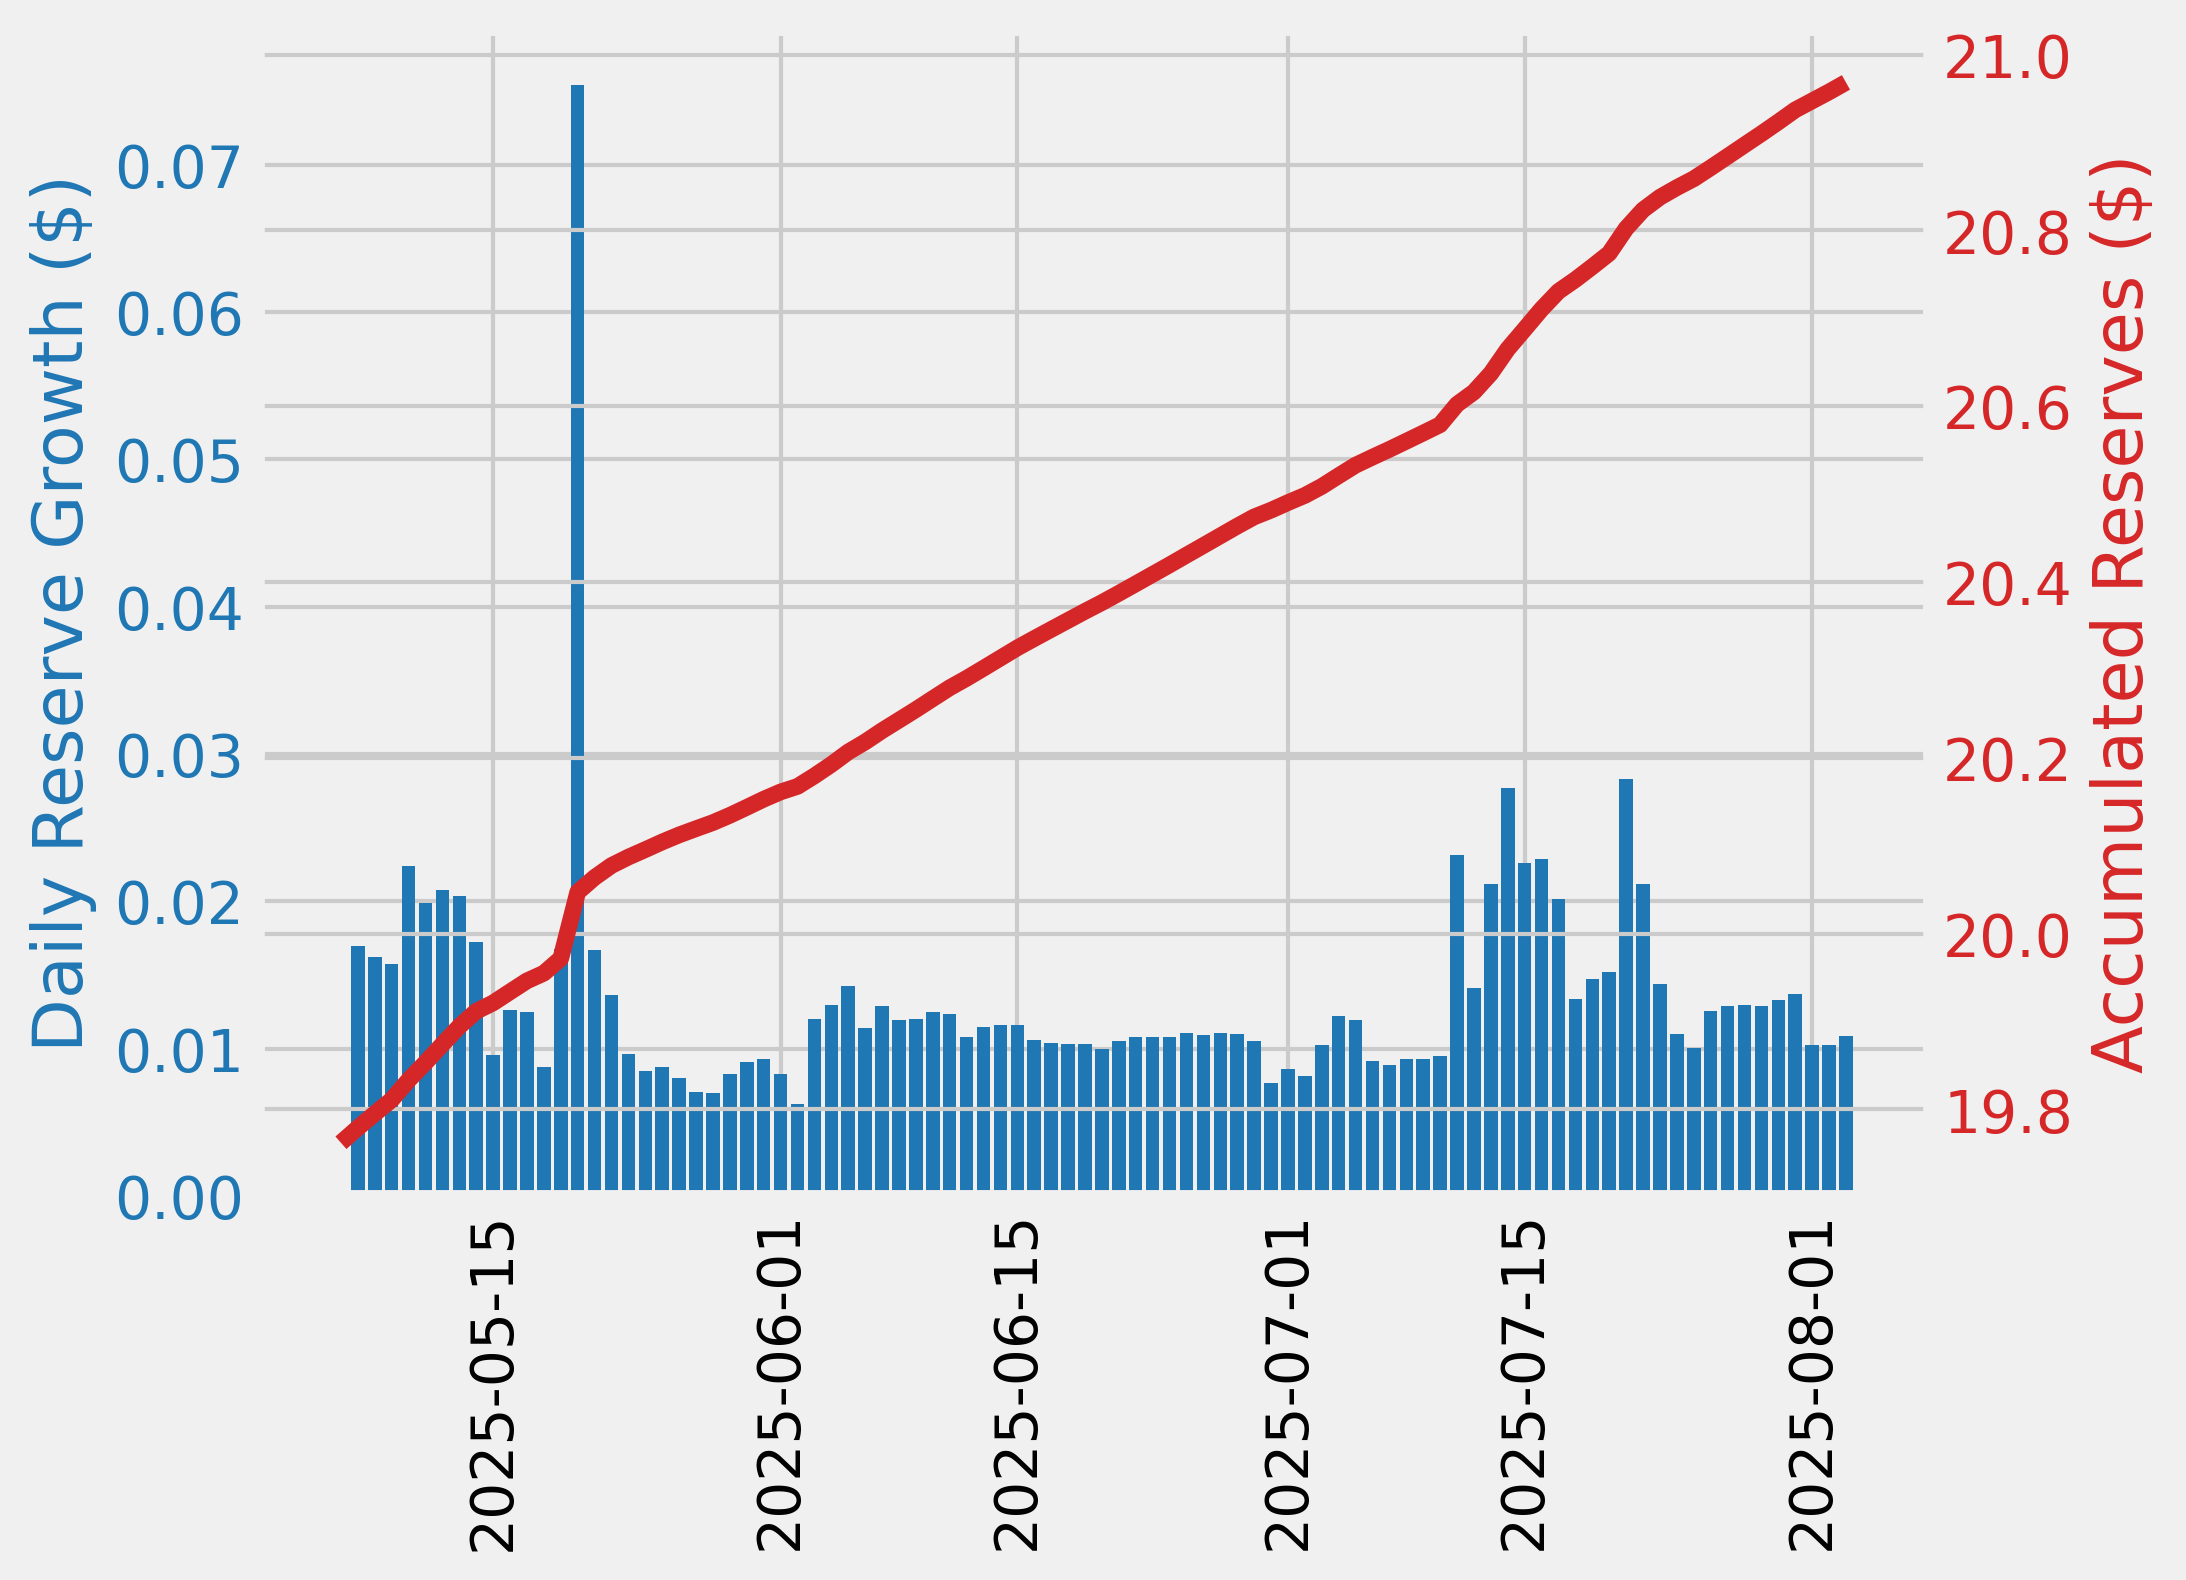
The minimum USDbC reserve growth was 40.50%, and the maximum was 52.70%. The average USDbC reserve growth was 43.13%.
-
The comet accumulated $37.66 USDbC reserves while distributing $0.00 COMP rewards for a weekly Net Protocol Profit of $37.66.
Base Asset APR Trend

Reserve Analysis

COMP Rewards Analysis
| Chain | CometRewards COMP token holdings | Daily aggregate COMP token reward distributions | Remaining days of rewards runway (not including existing claimable rewards) |
|---|---|---|---|
| base | 0.00 | 90.00 | 0.00 |
Collateral Asset Supply
This graph shows the trend of total supply of all collateral assets.

To see updated statistics, please see the live version of this graph here.
Base Asset Borrows
This graph shows the trend of total borrows of the base asset.

To see updated statistics, please see the live version of this graph here.
Utilization
This graph shows the utilization (borrow / supply) of the base asset over the past week.

Supply Cap Usage
This graph shows the supply cap usage (supply / supply cap) of all collateral assets over the past week.

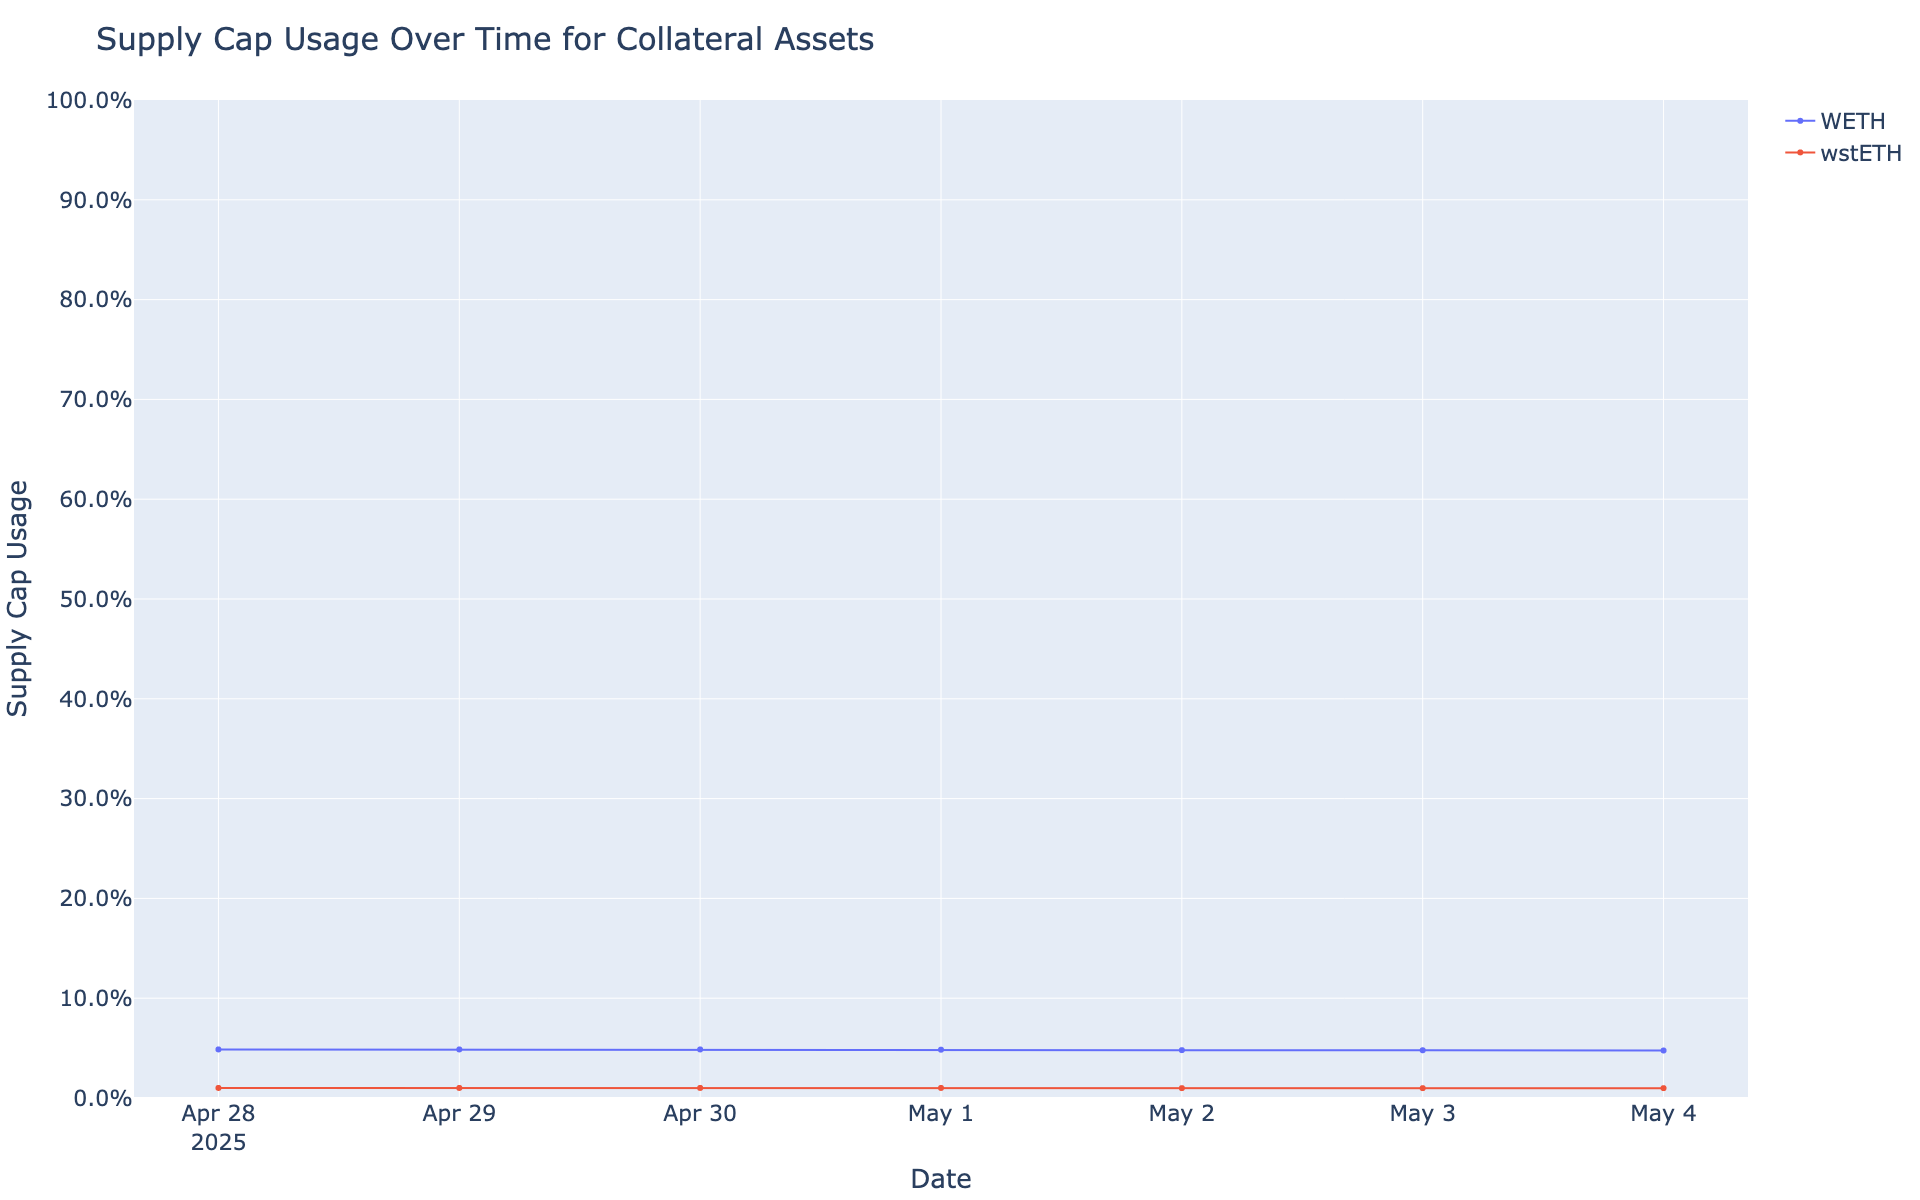
base WETH Comet
Simple Summary
-
WETH Borrows decreased 4.85%, from $4.86M to $4.62M.
-
WETH Supply decreased 9.36%, from $6.47M to $5.86M.
-
WETH utilization increased 4.97%, from 75.12% to 78.85%.
-
The minimum WETH reserve growth was -0.10%, and the maximum was 3.79%. The average WETH reserve growth was 1.75%.
-
The comet accumulated $34.48 WETH reserves while distributing 1.73K COMP rewards for a weekly Net Protocol Profit of -1.70K.
Base Asset APR Trend

Reserve Analysis

COMP Rewards Analysis
| Chain | CometRewards COMP token holdings | Daily aggregate COMP token reward distributions | Remaining days of rewards runway (not including existing claimable rewards) |
|---|---|---|---|
| base | 0.00 | 90.00 | 0.00 |
Collateral Asset Supply
This graph shows the trend of total supply of all collateral assets.

To see updated statistics, please see the live version of this graph here.
Base Asset Borrows
This graph shows the trend of total borrows of the base asset.

To see updated statistics, please see the live version of this graph here.
Utilization
This graph shows the utilization (borrow / supply) of the base asset over the past week.

Supply Cap Usage
This graph shows the supply cap usage (supply / supply cap) of all collateral assets over the past week.

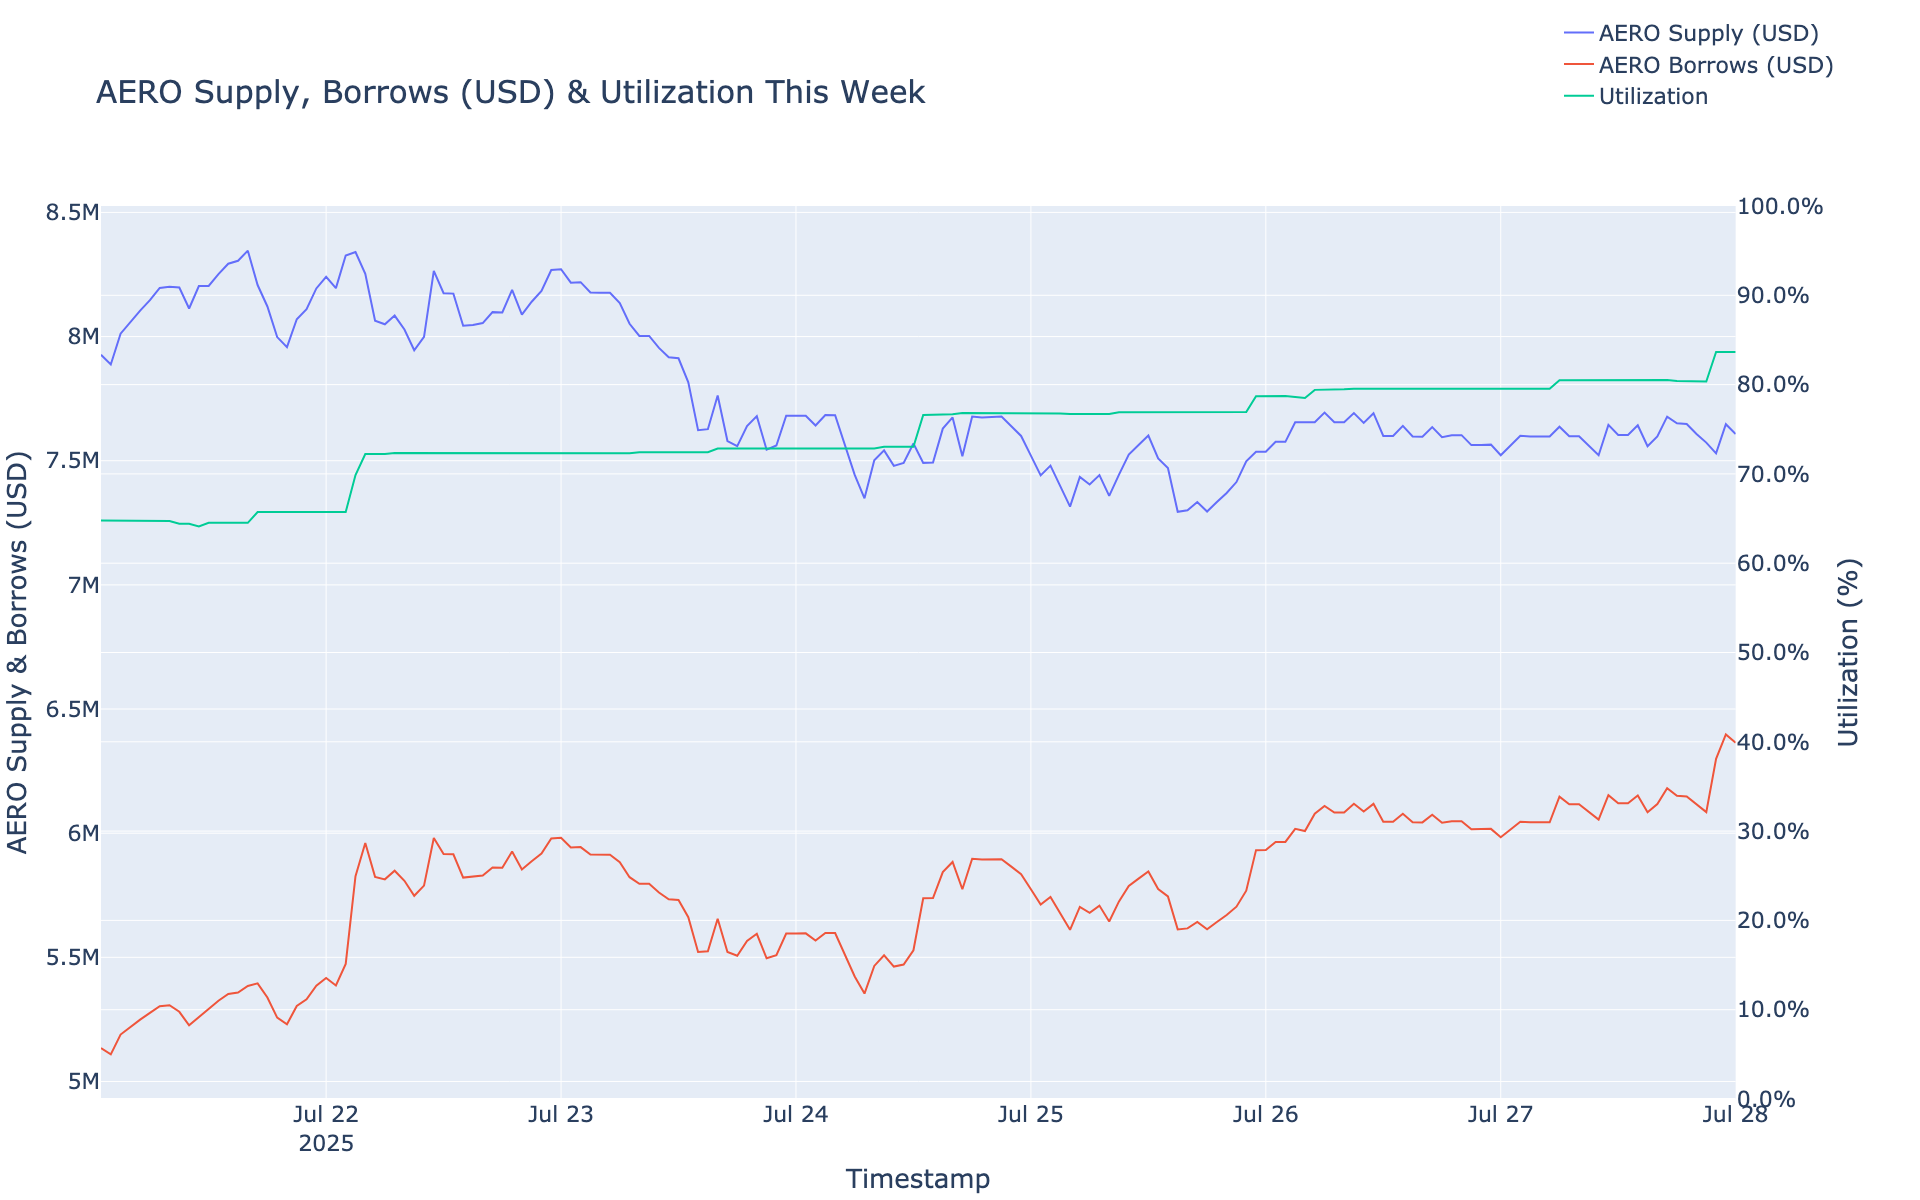
base AERO Comet
Simple Summary
-
AERO Borrows decreased 8.70%, from $2.18M to $1.99M.
-
AERO Supply decreased 14.80%, from $6.36M to $5.42M.
-
AERO utilization increased 7.16%, from 34.22% to 36.67%.
-
The minimum AERO reserve growth was -25.01%, and the maximum was -21.38%. The average AERO reserve growth was -23.95%.
-
The comet accumulated $-522.26 AERO reserves while distributing 7.40K COMP rewards for a weekly Net Protocol Profit of -7.92K.
Base Asset APR Trend

Reserve Analysis

COMP Rewards Analysis
| Chain | CometRewards COMP token holdings | Daily aggregate COMP token reward distributions | Remaining days of rewards runway (not including existing claimable rewards) |
|---|---|---|---|
| base | 0.00 | 90.00 | 0.00 |
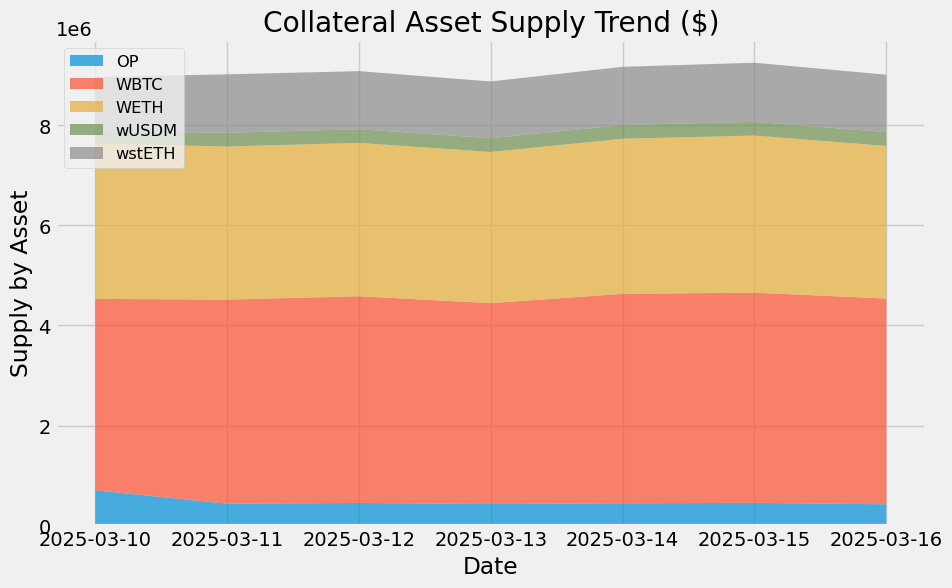
Collateral Asset Supply
This graph shows the trend of total supply of all collateral assets.

To see updated statistics, please see the live version of this graph here.
Base Asset Borrows
This graph shows the trend of total borrows of the base asset.

To see updated statistics, please see the live version of this graph here.
Utilization
This graph shows the utilization (borrow / supply) of the base asset over the past week.

Supply Cap Usage
This graph shows the supply cap usage (supply / supply cap) of all collateral assets over the past week.

Optimism Ecosystem Update
optimism USDC Comet
Simple Summary
-
USDC Borrows decreased 6.98%, from $5.15M to $4.79M.
-
USDC Supply has not changed, remaining at $7.32M.
-
USDC utilization decreased 6.69%, from 70.34% to 65.63%.
-
The minimum USDC reserve growth was -9.91%, and the maximum was 0.26%. The average USDC reserve growth was -4.81%.
-
The comet accumulated $-164.91 USDC reserves while distributing 2.89K COMP rewards for a weekly Net Protocol Profit of -3.05K.
Base Asset APR Trend

Reserve Analysis

COMP Rewards Analysis
| Chain | CometRewards COMP token holdings | Daily aggregate COMP token reward distributions | Remaining days of rewards runway (not including existing claimable rewards) |
|---|---|---|---|
| optimism | 0.00 | 27.00 | 0.00 |
Collateral Asset Supply
This graph shows the trend of total supply of all collateral assets.
To see updated statistics, please see the live version of this graph here.
Base Asset Borrows
This graph shows the trend of total borrows of the base asset.

To see updated statistics, please see the live version of this graph here.
Utilization
This graph shows the utilization (borrow / supply) of the base asset over the past week.

Supply Cap Usage
This graph shows the supply cap usage (supply / supply cap) of all collateral assets over the past week.

optimism USDT Comet
Simple Summary
-
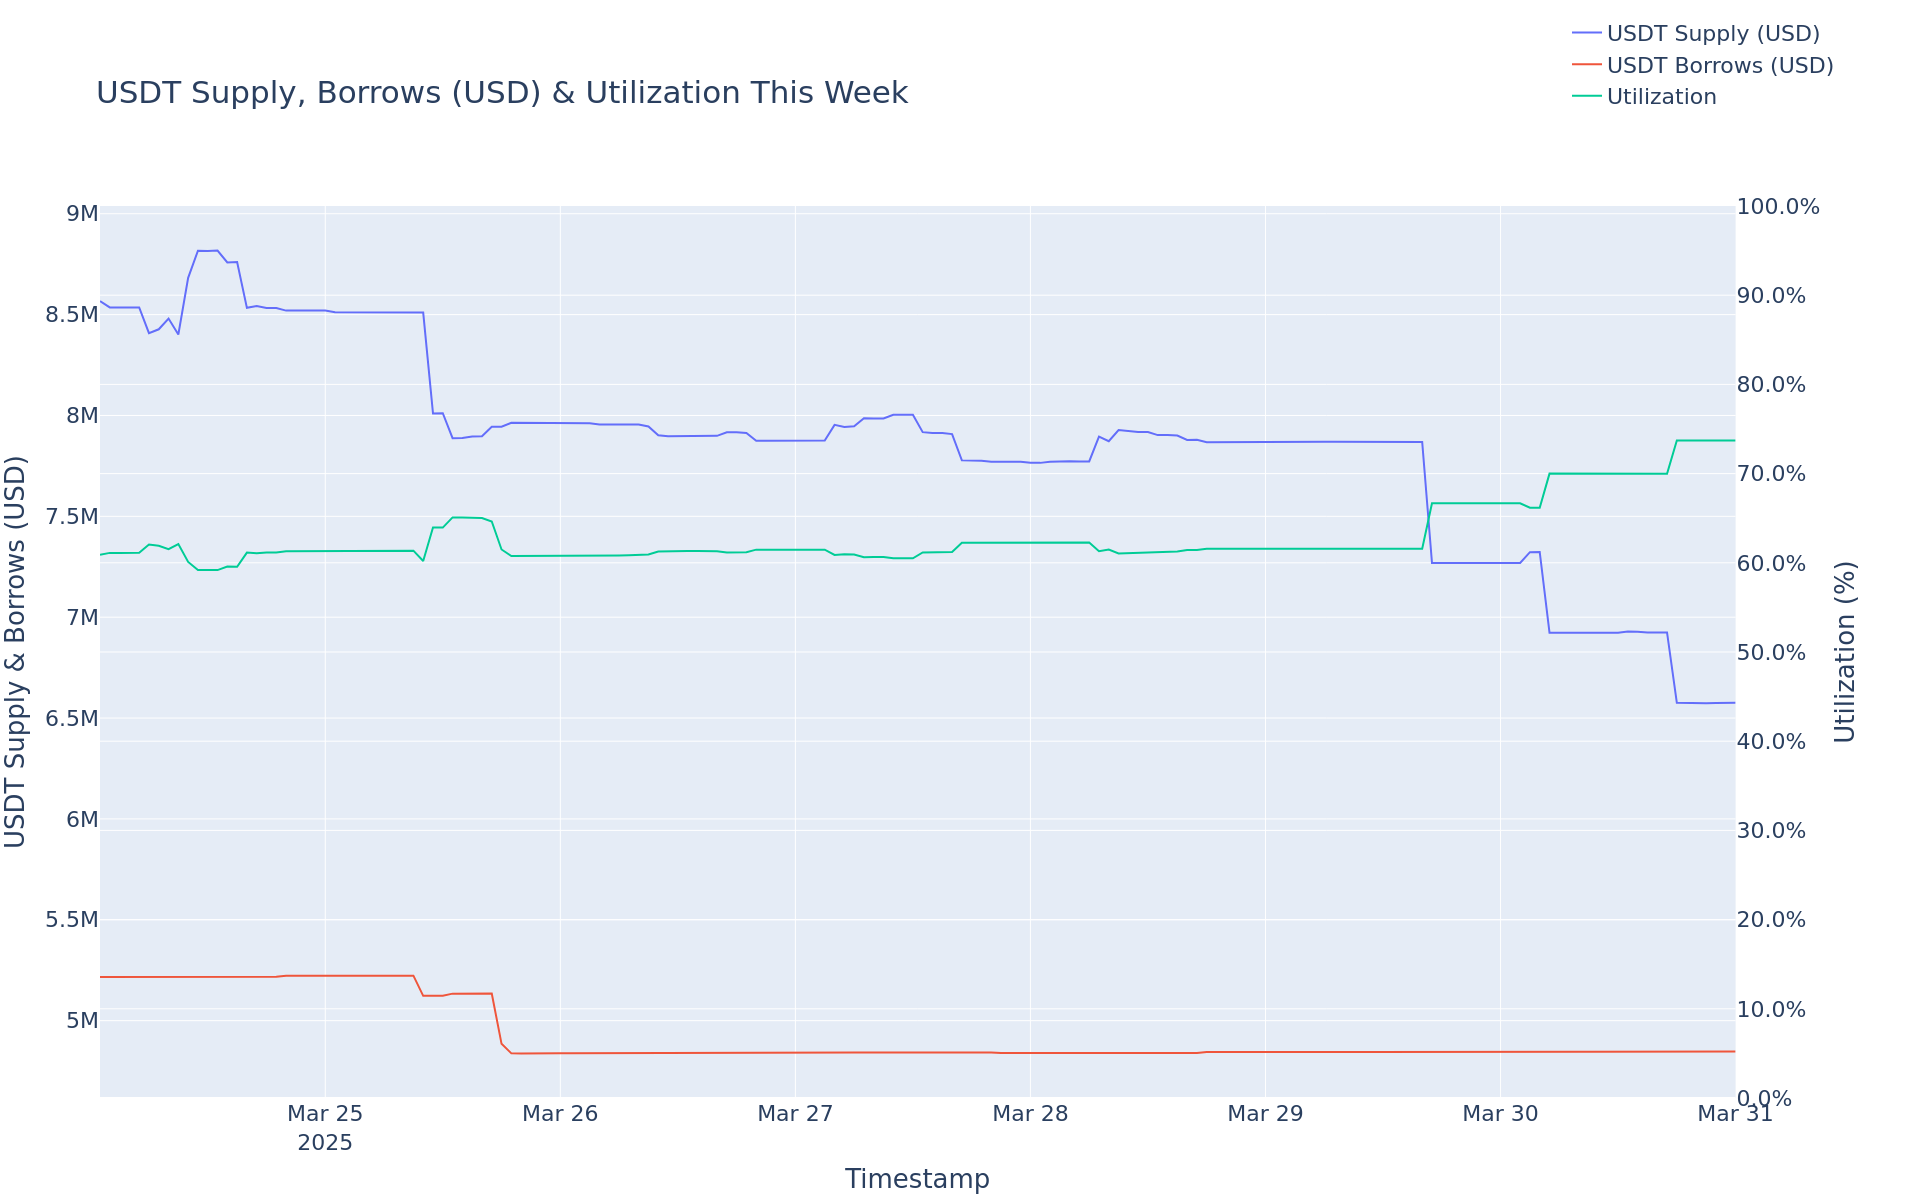
USDT Borrows increased 2.59%, from $4.74M to $4.86M.
-
USDT Supply decreased 10.28%, from $7.91M to $7.09M.
-
USDT utilization increased 14.34%, from 59.93% to 68.53%.
-
The minimum USDT reserve growth was -15.66%, and the maximum was -2.50%. The average USDT reserve growth was -7.93%.
-
The comet accumulated $-261.84 USDT reserves while distributing 2.89K COMP rewards for a weekly Net Protocol Profit of -3.15K.
Base Asset APR Trend

Reserve Analysis

COMP Rewards Analysis
| Chain | CometRewards COMP token holdings | Daily aggregate COMP token reward distributions | Remaining days of rewards runway (not including existing claimable rewards) |
|---|---|---|---|
| optimism | 0.00 | 27.00 | 0.00 |
Collateral Asset Supply
This graph shows the trend of total supply of all collateral assets.

To see updated statistics, please see the live version of this graph here.
Base Asset Borrows
This graph shows the trend of total borrows of the base asset.

To see updated statistics, please see the live version of this graph here.
Utilization
This graph shows the utilization (borrow / supply) of the base asset over the past week.

Supply Cap Usage
This graph shows the supply cap usage (supply / supply cap) of all collateral assets over the past week.

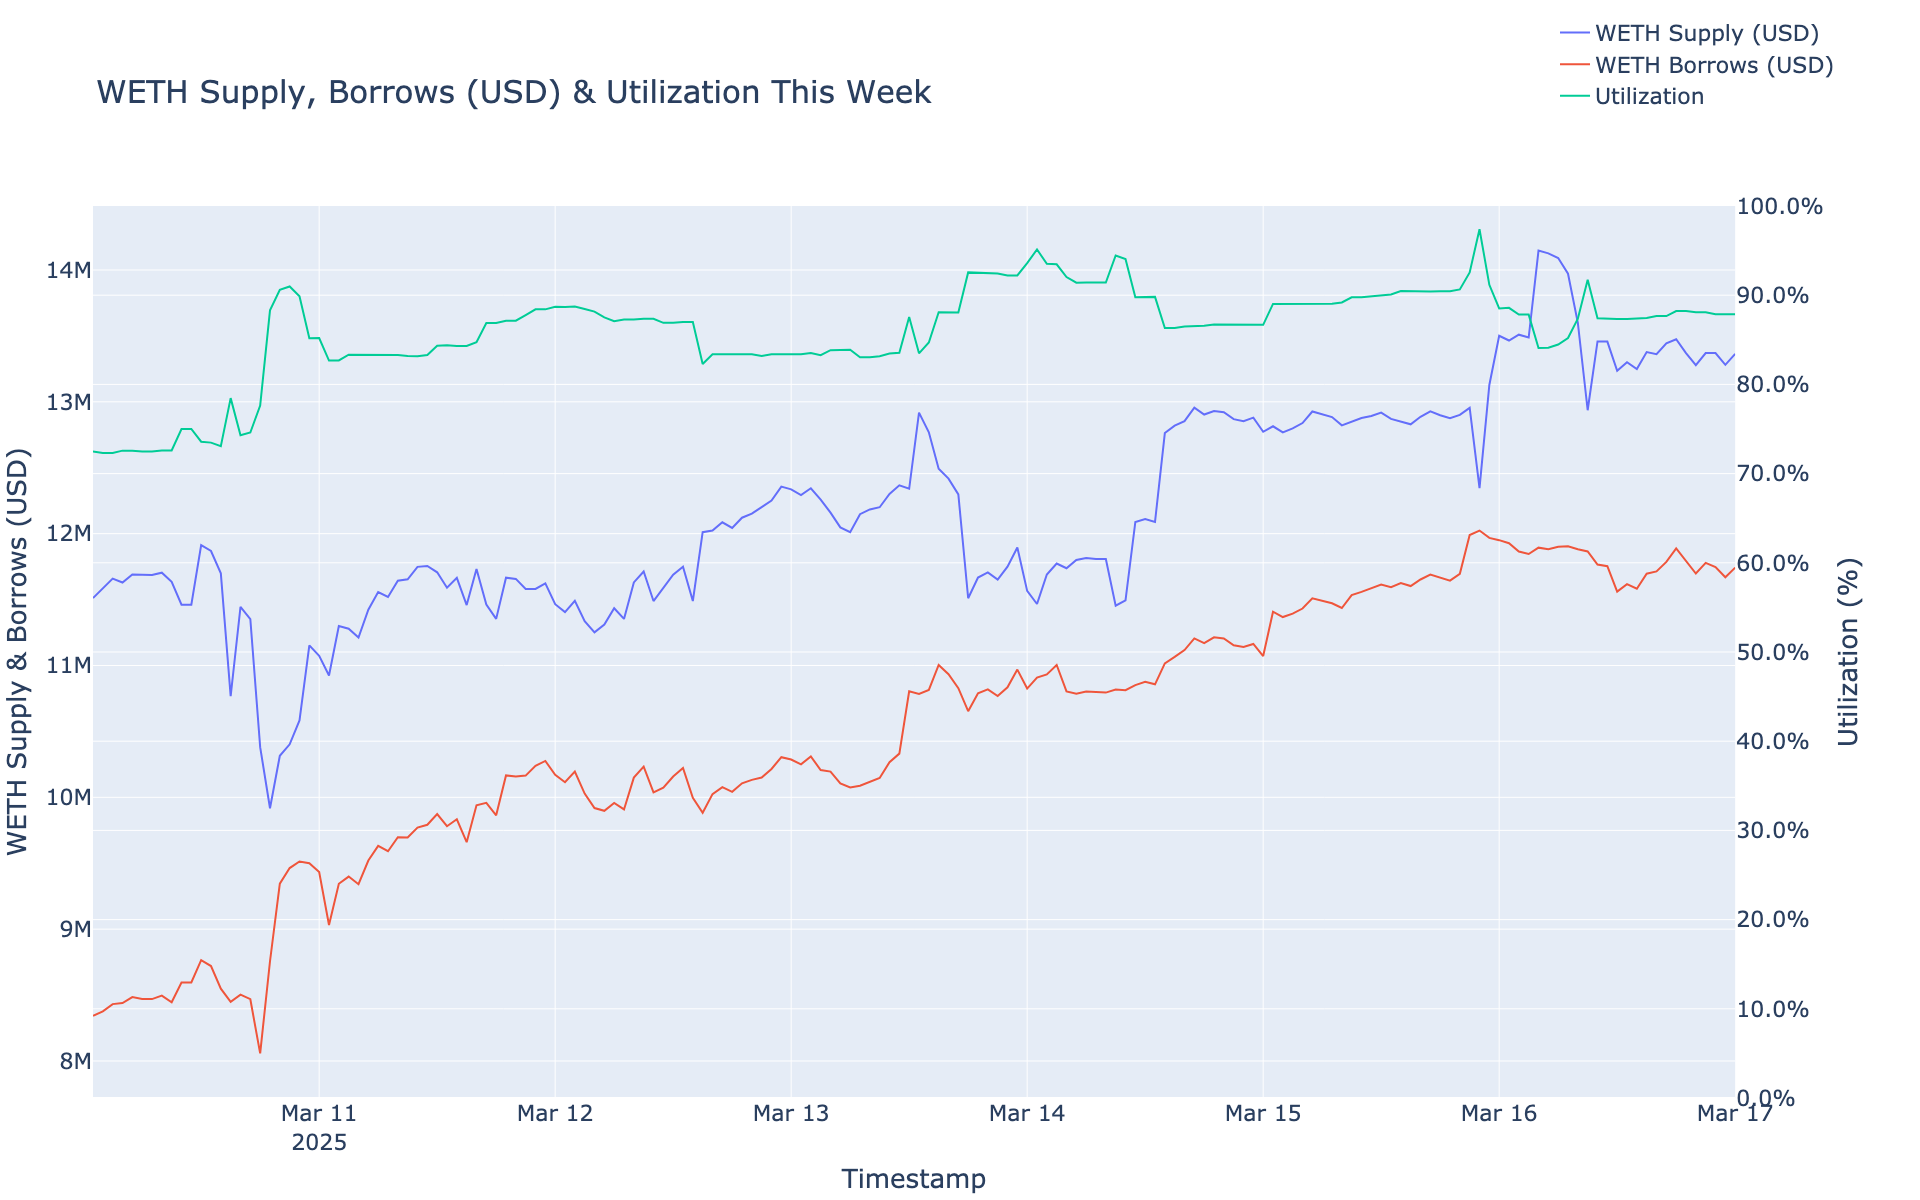
optimism WETH Comet
Simple Summary
-
WETH Borrows increased 40.75%, from $8.34M to $11.74M.
-
WETH Supply increased 16.09%, from $11.51M to $13.36M.
-
WETH utilization increased 21.24%, from 72.47% to 87.87%.
-
The minimum WETH reserve growth was -1.84%, and the maximum was 10.03%. The average WETH reserve growth was 6.74%.
-
The comet accumulated $411.65 WETH reserves while distributing 2.02K COMP rewards for a weekly Net Protocol Profit of -1.61K.
Base Asset APR Trend

Reserve Analysis

COMP Rewards Analysis
| Chain | CometRewards COMP token holdings | Daily aggregate COMP token reward distributions | Remaining days of rewards runway (not including existing claimable rewards) |
|---|---|---|---|
| optimism | 0.00 | 27.00 | 0.00 |
Collateral Asset Supply
This graph shows the trend of total supply of all collateral assets.

To see updated statistics, please see the live version of this graph here.
Base Asset Borrows
This graph shows the trend of total borrows of the base asset.

To see updated statistics, please see the live version of this graph here.
Utilization
This graph shows the utilization (borrow / supply) of the base asset over the past week.
Supply Cap Usage
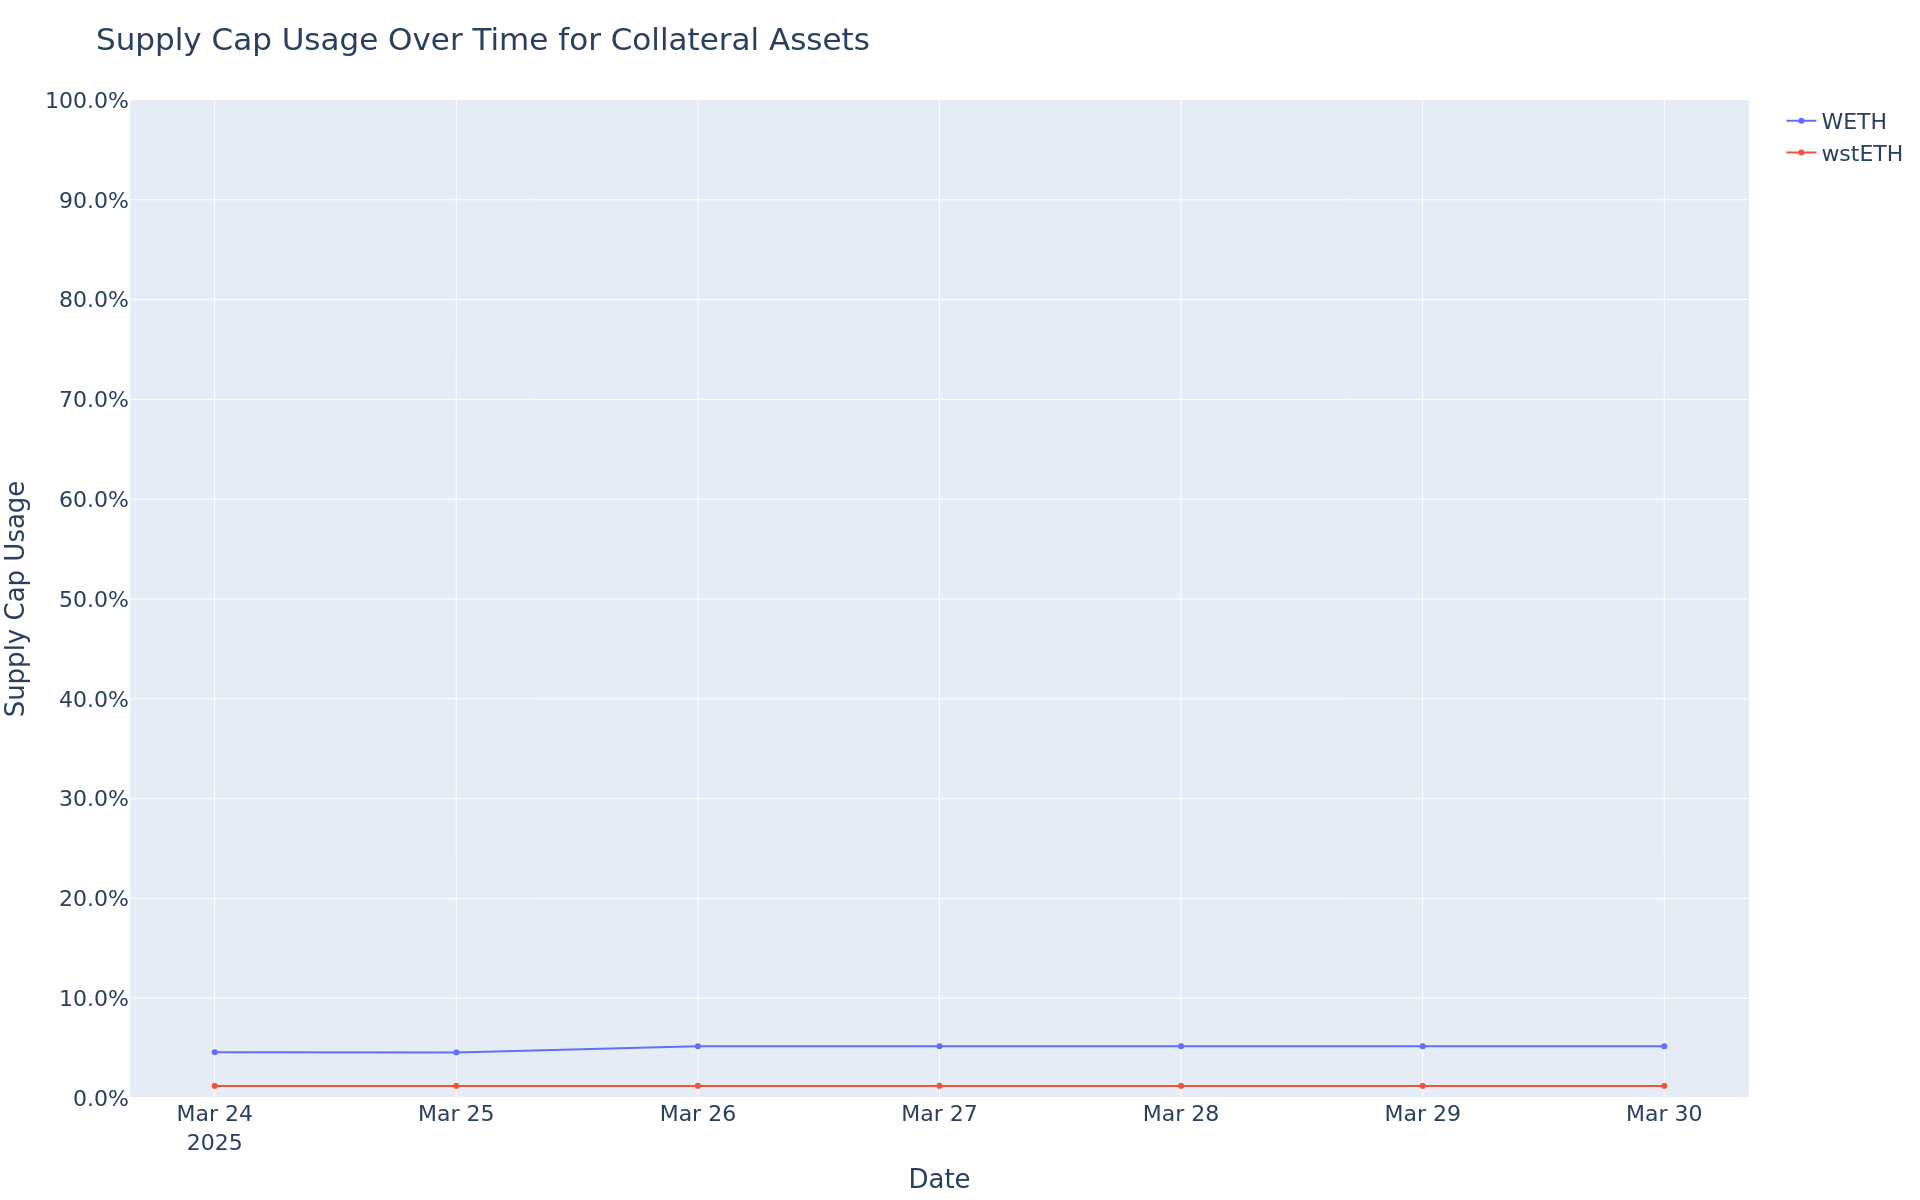
This graph shows the supply cap usage (supply / supply cap) of all collateral assets over the past week.

Polygon Ecosystem Update
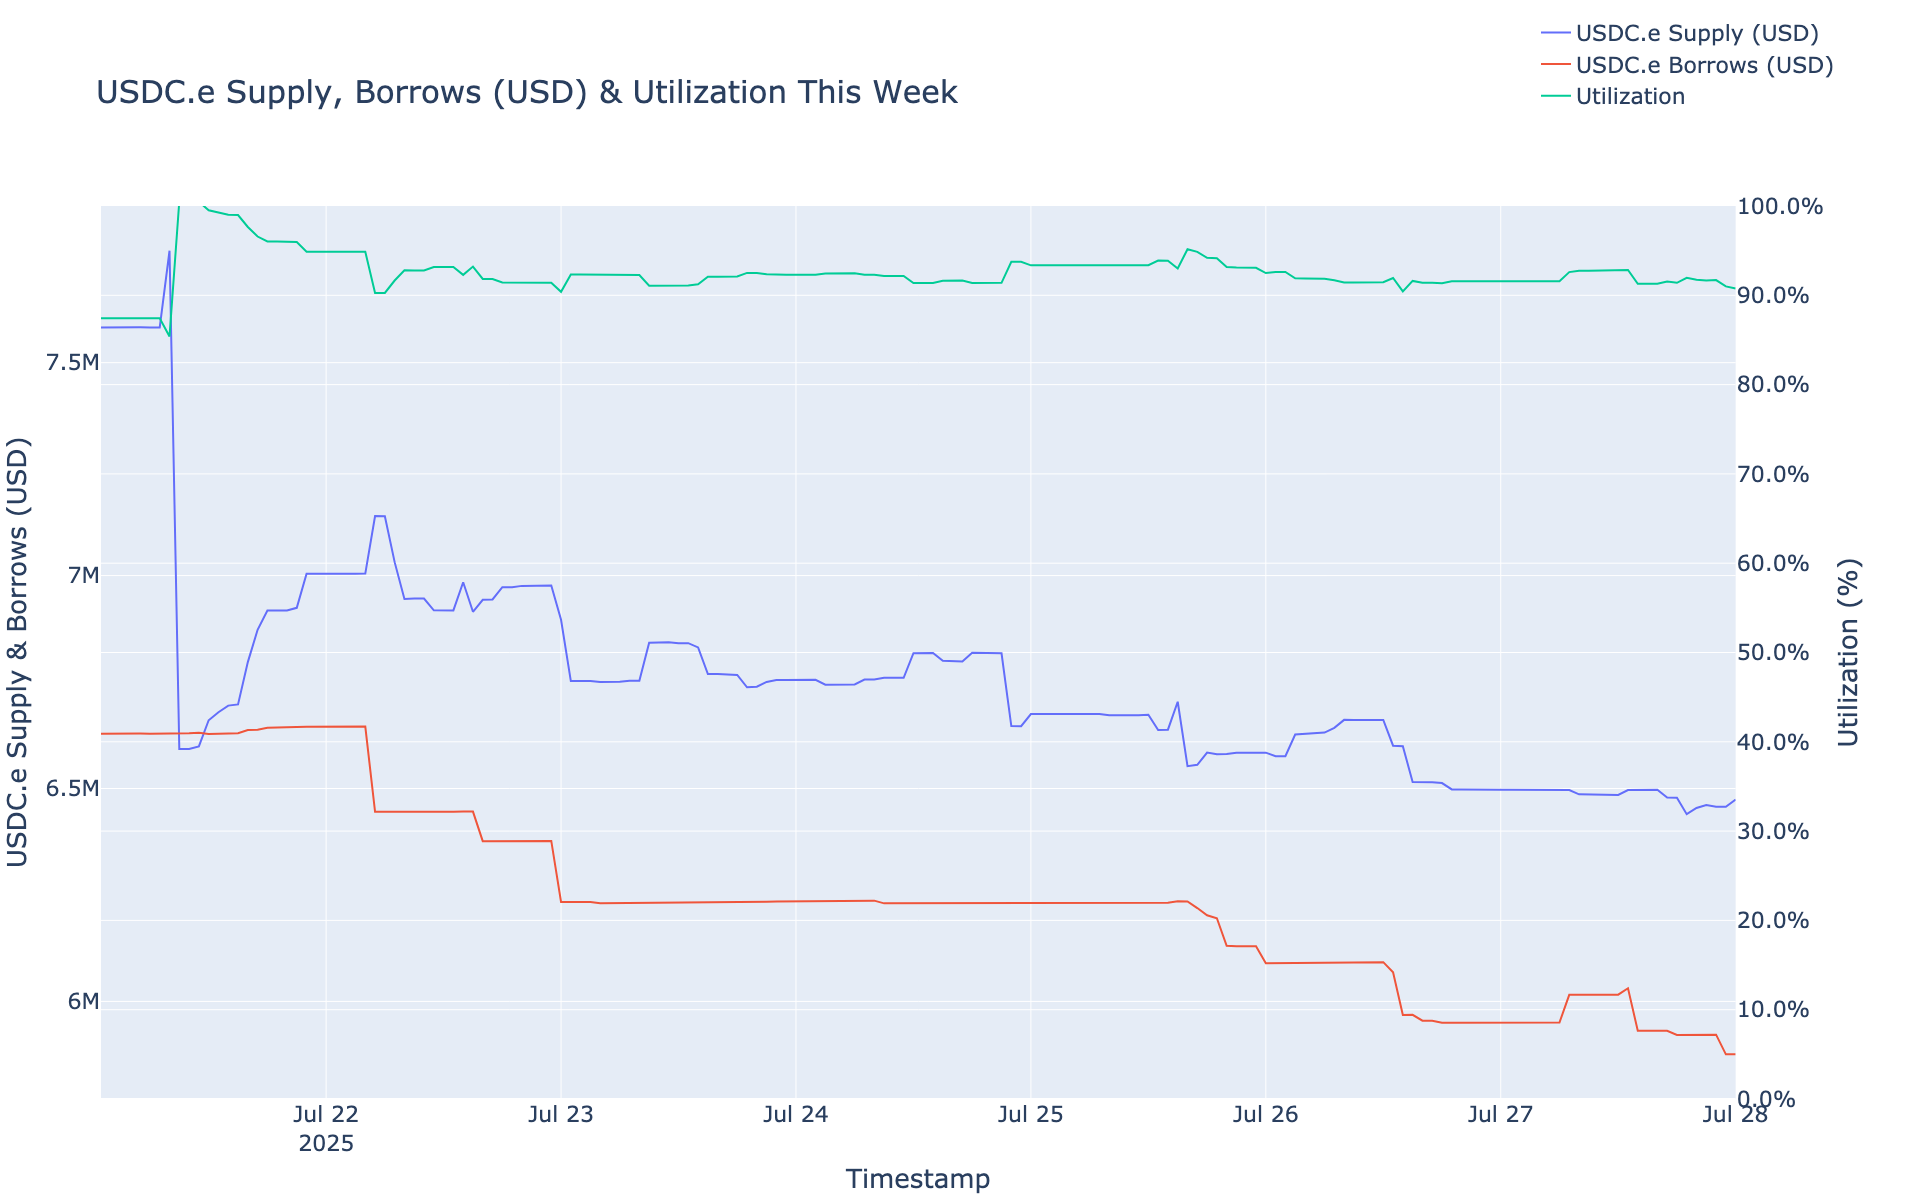
polygon USDC.e Comet
Simple Summary
-
USDC.e Borrows decreased 1.69%, from $5.84M to $5.74M.
-
USDC.e Supply decreased 9.30%, from $9.05M to $8.21M.
-
USDC.e utilization increased 8.39%, from 64.54% to 69.96%.
-
The minimum USDC.e reserve growth was -15.53%, and the maximum was -7.77%. The average USDC.e reserve growth was -12.82%.
-
The comet accumulated $-676.36 USDC.e reserves while distributing 3.18K COMP rewards for a weekly Net Protocol Profit of -3.85K.
Base Asset APR Trend

Reserve Analysis

COMP Rewards Analysis
| Chain | CometRewards COMP token holdings | Daily aggregate COMP token reward distributions | Remaining days of rewards runway (not including existing claimable rewards) |
|---|---|---|---|
| polygon | 953.03 | 23.00 | 41.40 |
Collateral Asset Supply
This graph shows the trend of total supply of all collateral assets.

To see updated statistics, please see the live version of this graph here.
Base Asset Borrows
This graph shows the trend of total borrows of the base asset.
To see updated statistics, please see the live version of this graph here.
Utilization
This graph shows the utilization (borrow / supply) of the base asset over the past week.

Supply Cap Usage
This graph shows the supply cap usage (supply / supply cap) of all collateral assets over the past week.

polygon USDT Comet
Simple Summary
-
USDT Borrows decreased 11.22%, from $5.85M to $5.19M.
-
USDT Supply decreased 4.86%, from $7.73M to $7.35M.
-
USDT utilization decreased 6.68%, from 75.69% to 70.63%.
-
The minimum USDT reserve growth was -10.25%, and the maximum was -1.09%. The average USDT reserve growth was -5.52%.
-
The comet accumulated $-284.20 USDT reserves while distributing 3.46K COMP rewards for a weekly Net Protocol Profit of -3.75K.
Base Asset APR Trend

Reserve Analysis

COMP Rewards Analysis
| Chain | CometRewards COMP token holdings | Daily aggregate COMP token reward distributions | Remaining days of rewards runway (not including existing claimable rewards) |
|---|---|---|---|
| polygon | 953.03 | 23.00 | 41.40 |
Collateral Asset Supply
This graph shows the trend of total supply of all collateral assets.

To see updated statistics, please see the live version of this graph here.
Base Asset Borrows
This graph shows the trend of total borrows of the base asset.

To see updated statistics, please see the live version of this graph here.
Utilization
This graph shows the utilization (borrow / supply) of the base asset over the past week.

Supply Cap Usage
This graph shows the supply cap usage (supply / supply cap) of all collateral assets over the past week.

Scroll Ecosystem Update
scroll USDC Comet
Simple Summary
-
USDC Borrows decreased 27.57%, from $86.54K to $62.69K.
-
USDC Supply decreased 1.17%, from $129.11K to $127.60K.
-
USDC utilization decreased 26.71%, from 67.03% to 49.13%.
-
The minimum USDC reserve growth was -36.57%, and the maximum was -11.27%. The average USDC reserve growth was -32.48%.
-
The comet accumulated $-16.10 USDC reserves while distributing 0.00 COMP rewards for a weekly Net Protocol Profit of -16.10.
Base Asset APR Trend

Reserve Analysis

COMP Rewards Analysis
| Chain | CometRewards COMP token holdings | Daily aggregate COMP token reward distributions | Remaining days of rewards runway (not including existing claimable rewards) |
|---|---|---|---|
| scroll | 0.00 | 0.00 | 0.00 |
Collateral Asset Supply
This graph shows the trend of total supply of all collateral assets.

To see updated statistics, please see the live version of this graph here.
Base Asset Borrows
This graph shows the trend of total borrows of the base asset.

To see updated statistics, please see the live version of this graph here.
Utilization
This graph shows the utilization (borrow / supply) of the base asset over the past week.

Supply Cap Usage
This graph shows the supply cap usage (supply / supply cap) of all collateral assets over the past week.