[Gauntlet] Weekly Market Update: (2025-03-10 through 2025-03-16)
Ethereum Ecosystem Update
ethereum USDC Comet
Simple Summary
-
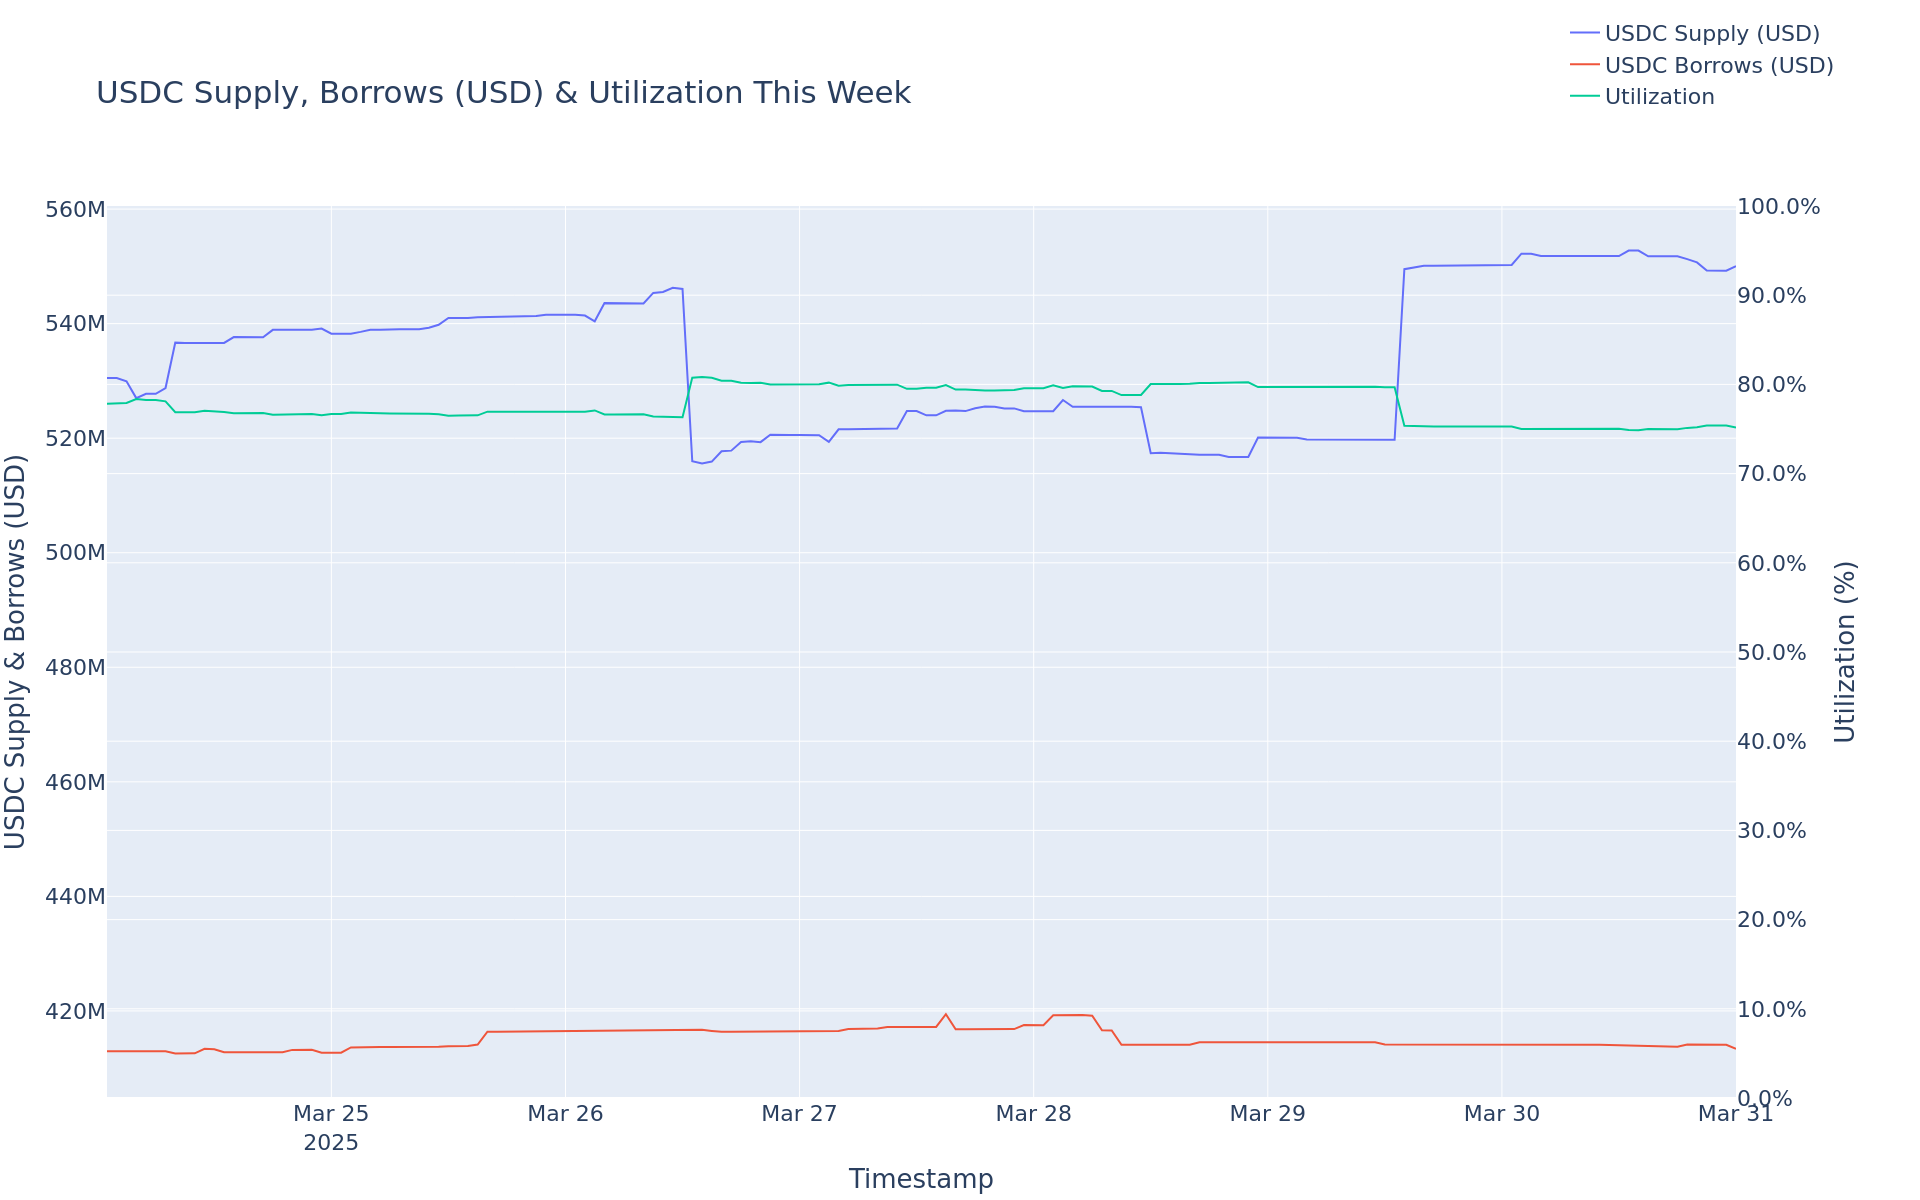
USDC Borrows decreased 1.87%, from $416.89M to $409.09M.
-
USDC Supply increased 2.51%, from $552.80M to $566.70M.
-
USDC utilization decreased 4.28%, from 75.41% to 72.19%.
-
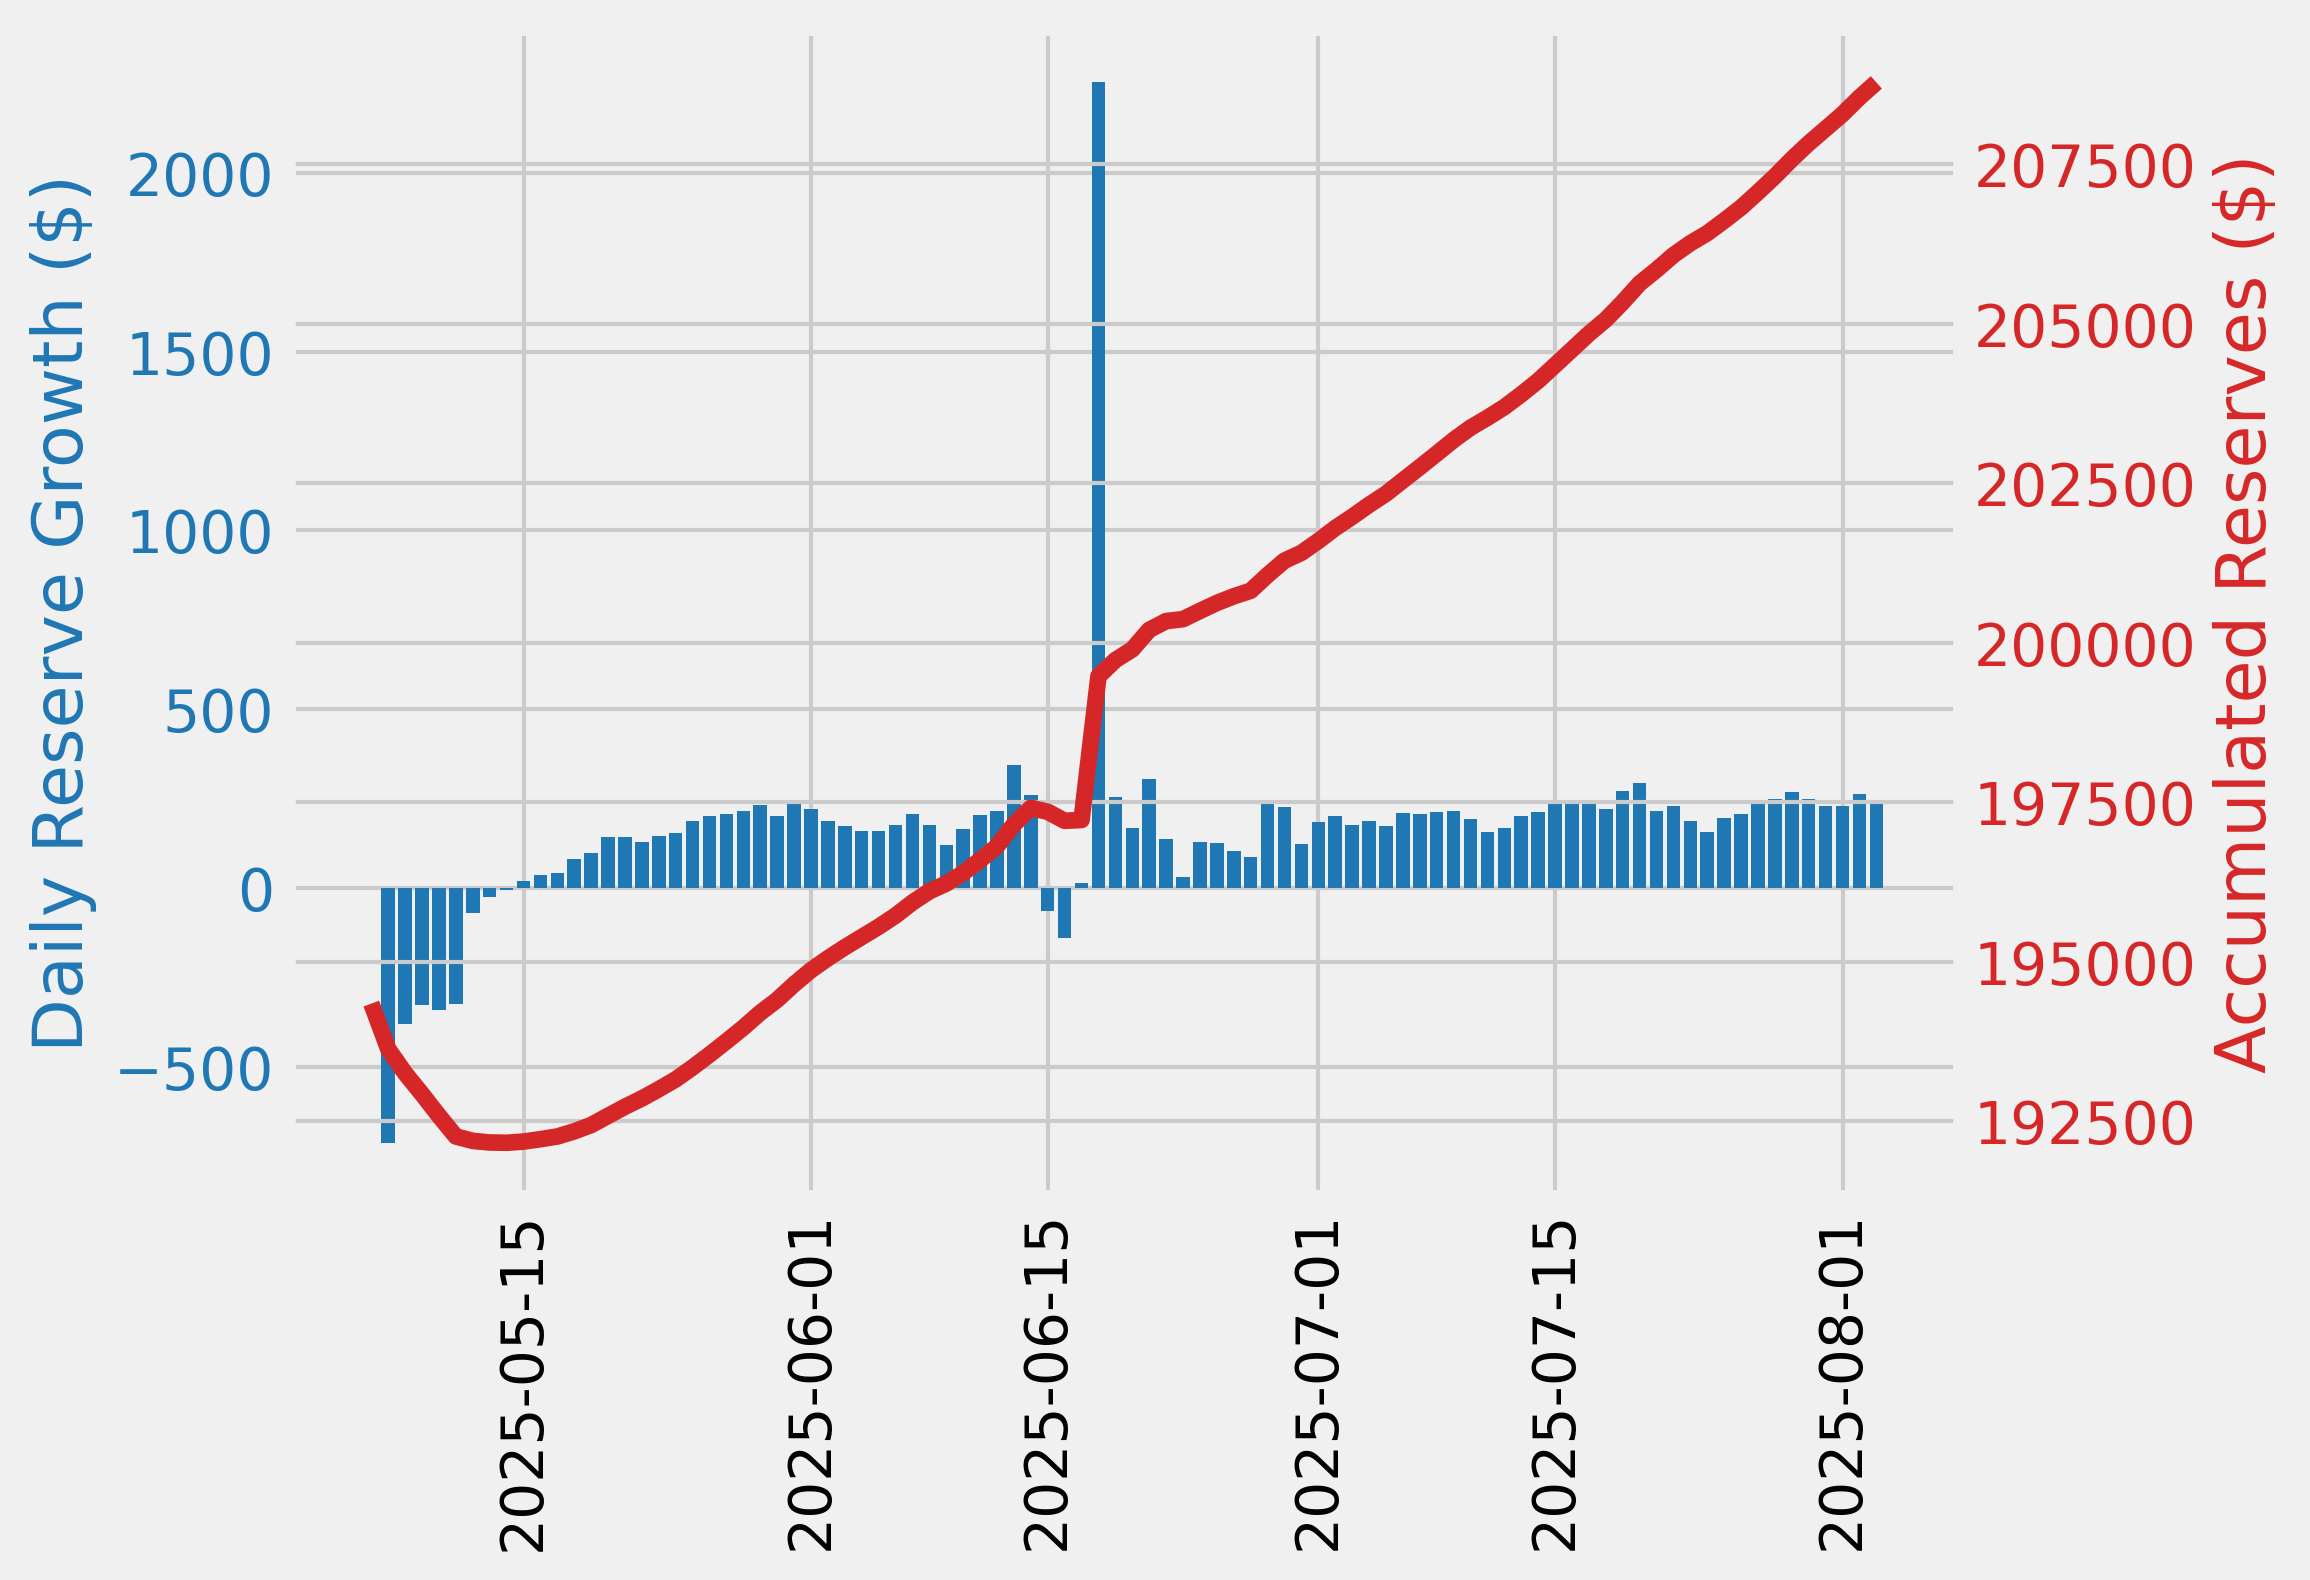
The minimum USDC reserve growth was -5.69%, and the maximum was -0.78%. The average USDC reserve growth was -4.20%.
-
The comet accumulated $-17.07K USDC reserves while distributing 40.70K COMP rewards for a weekly Net Protocol Profit of -57.77K.
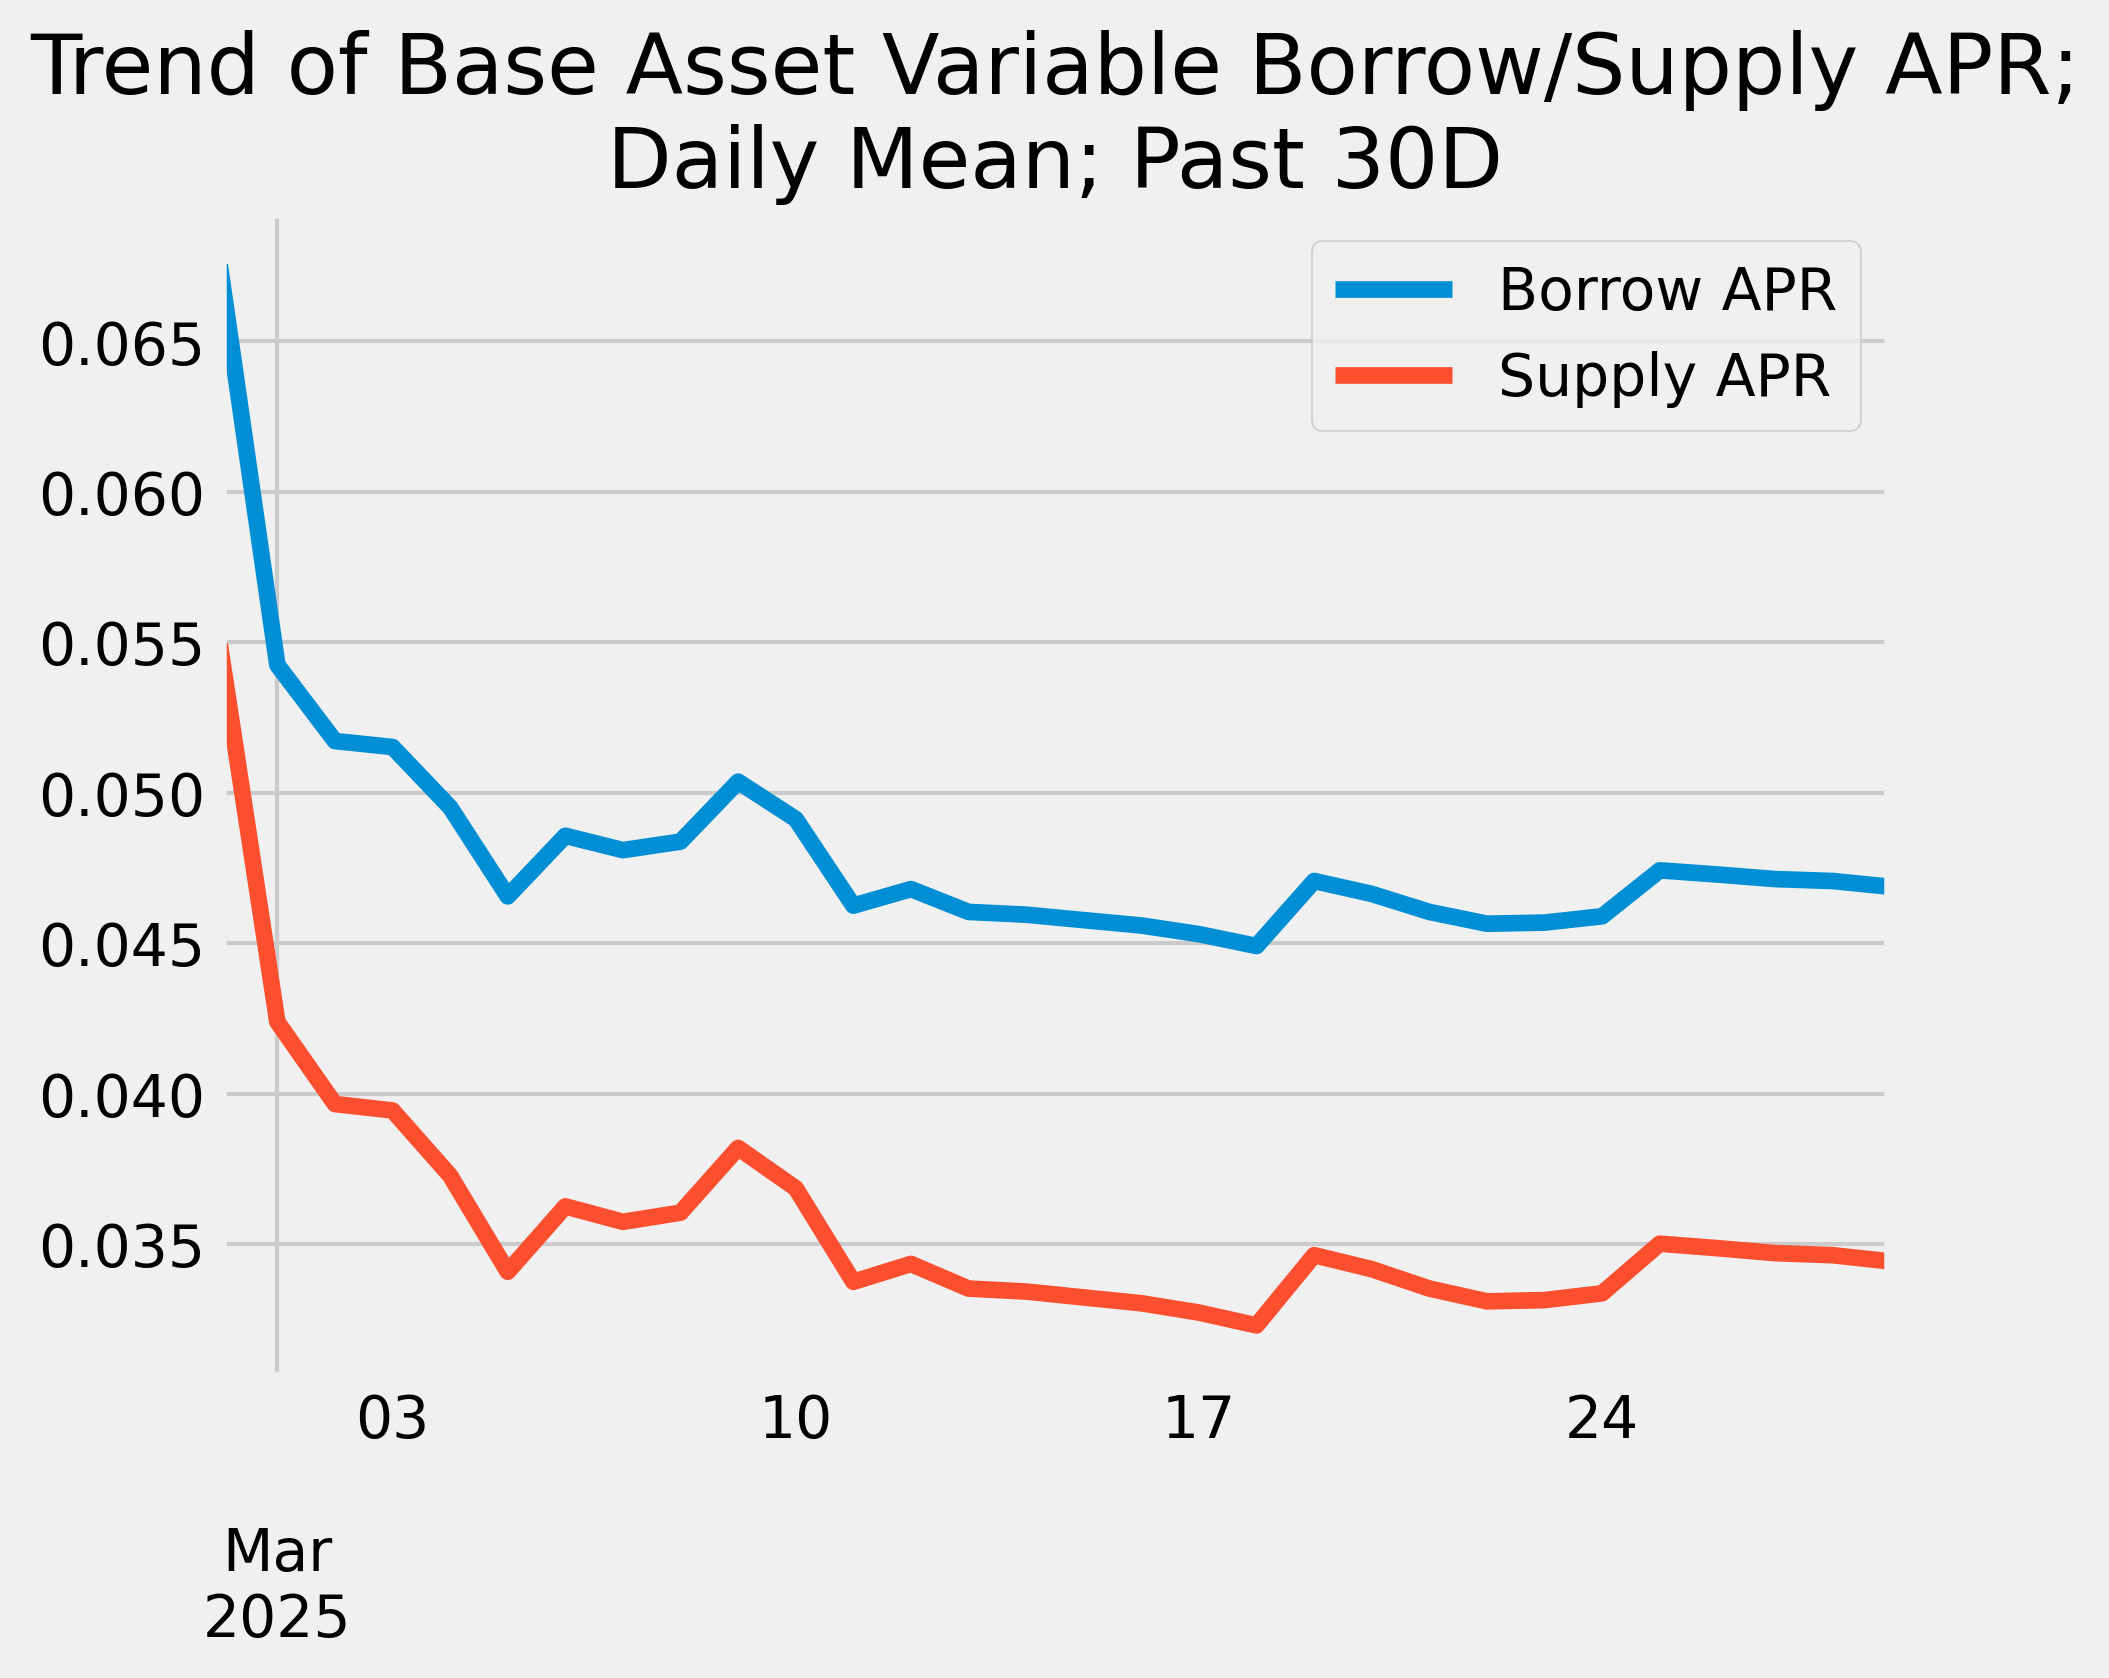
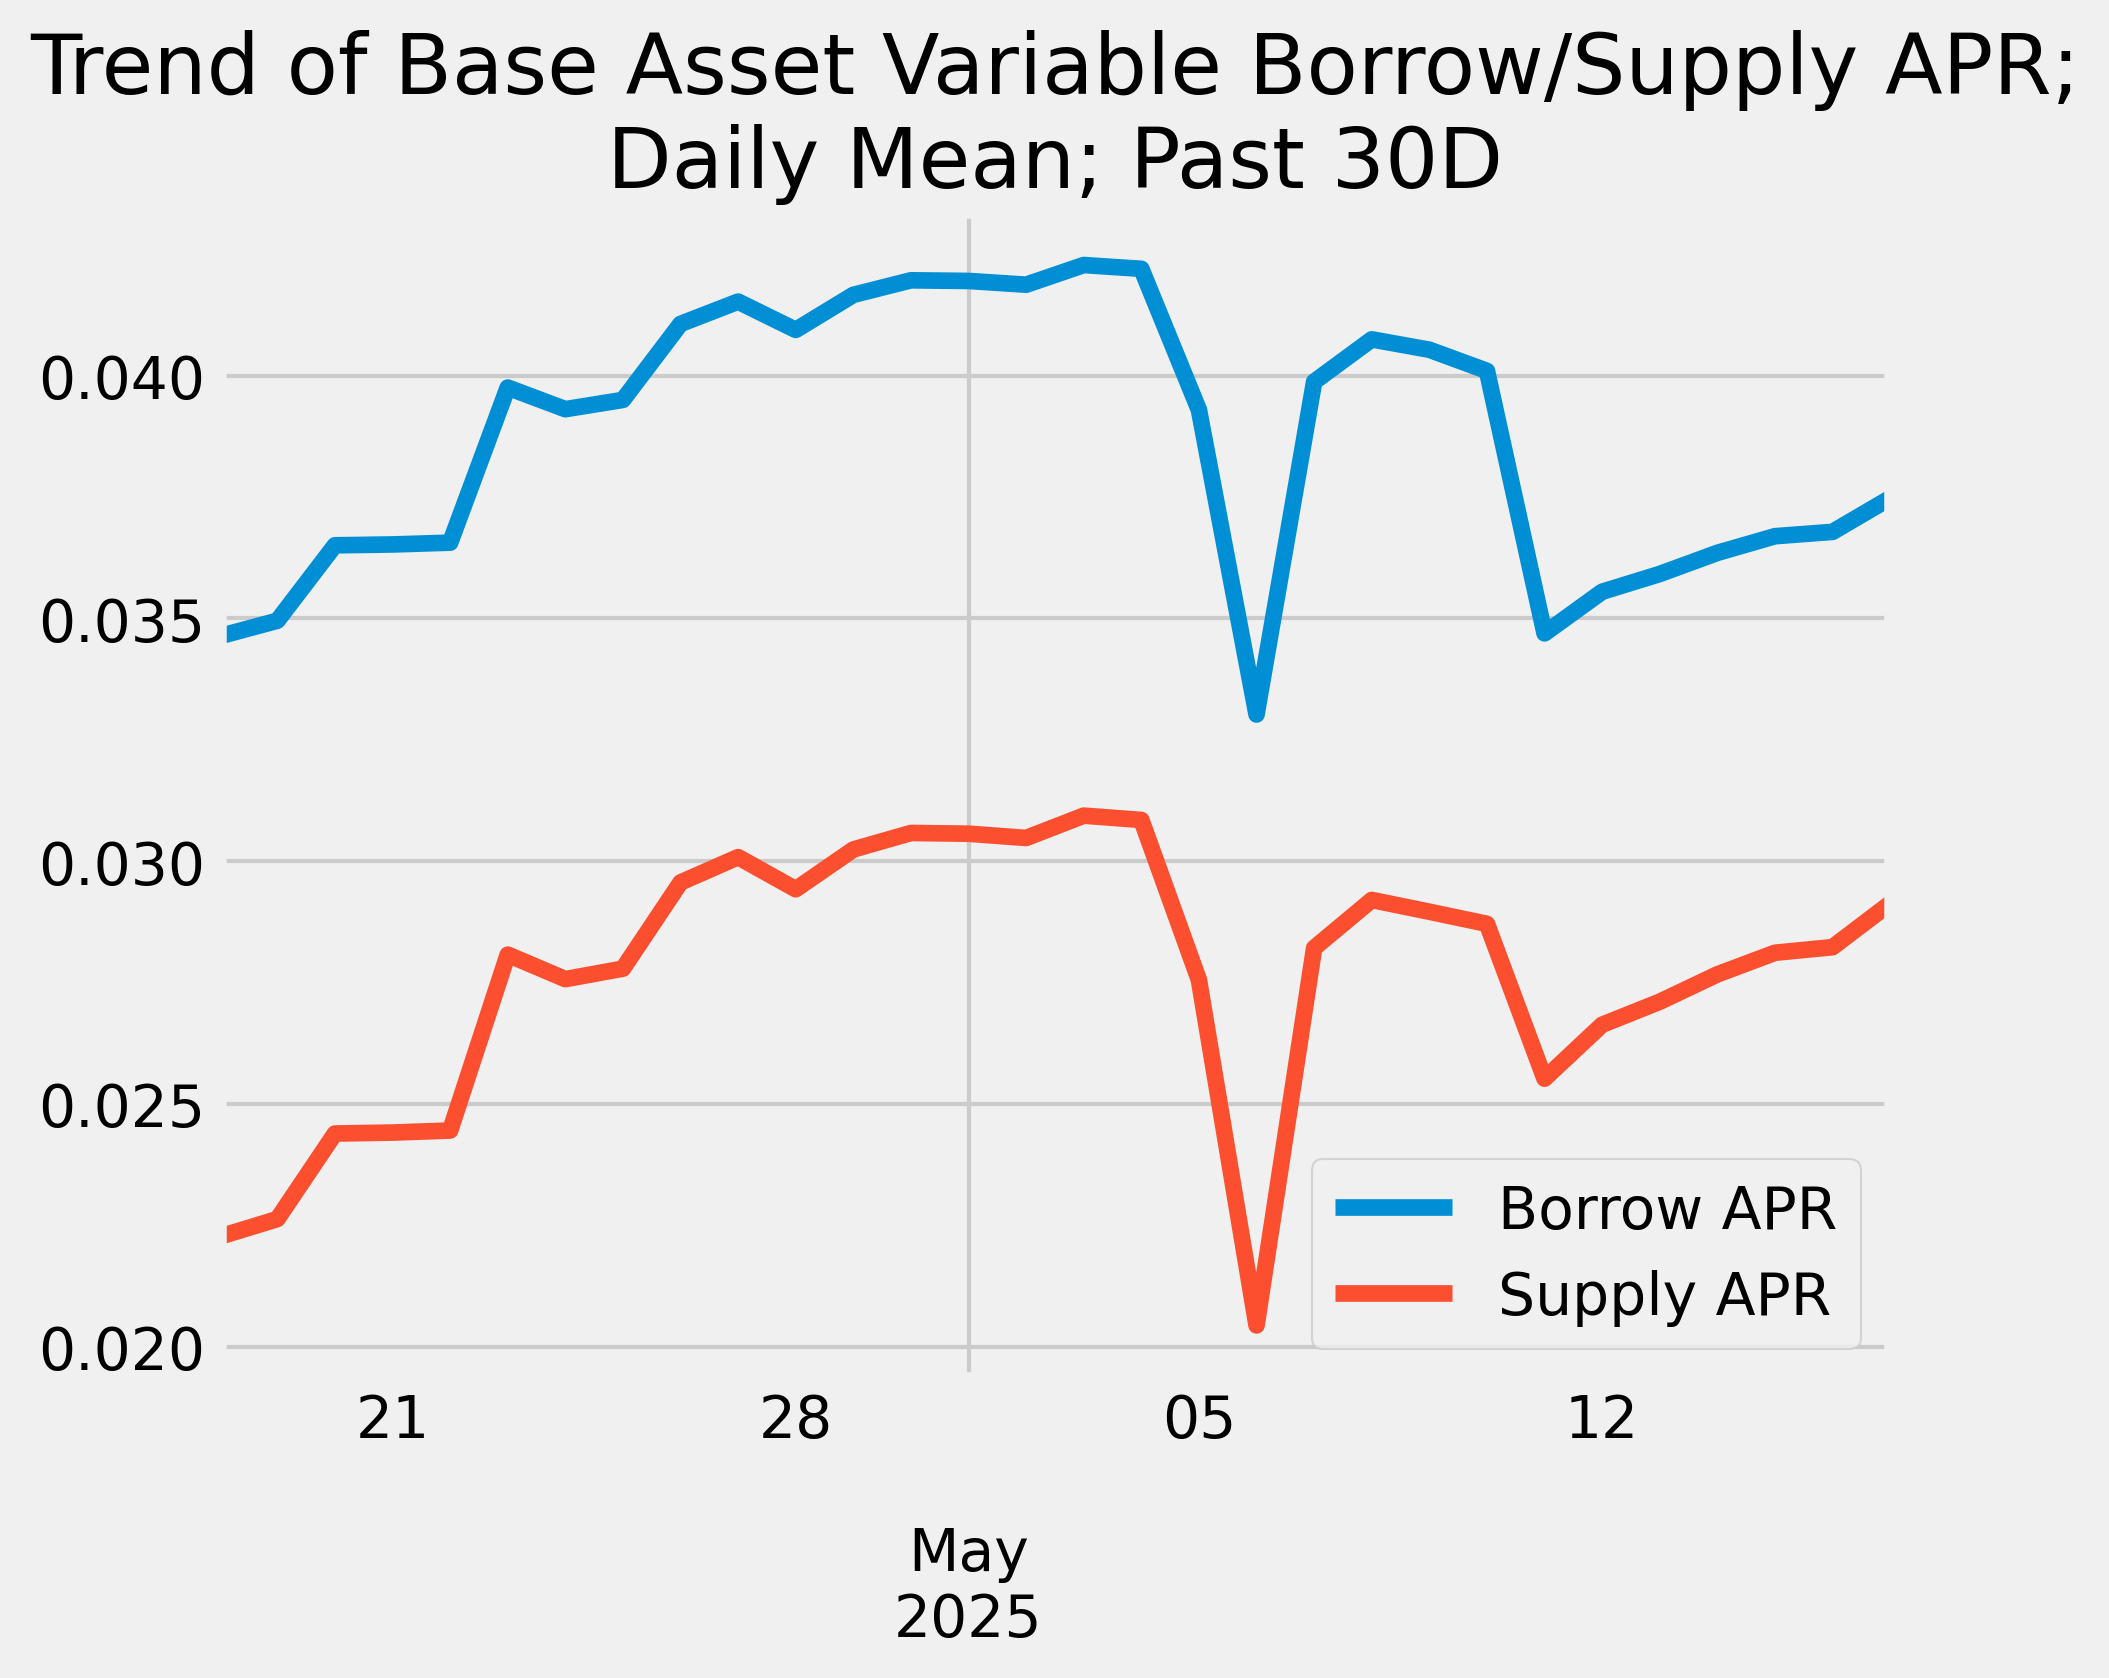
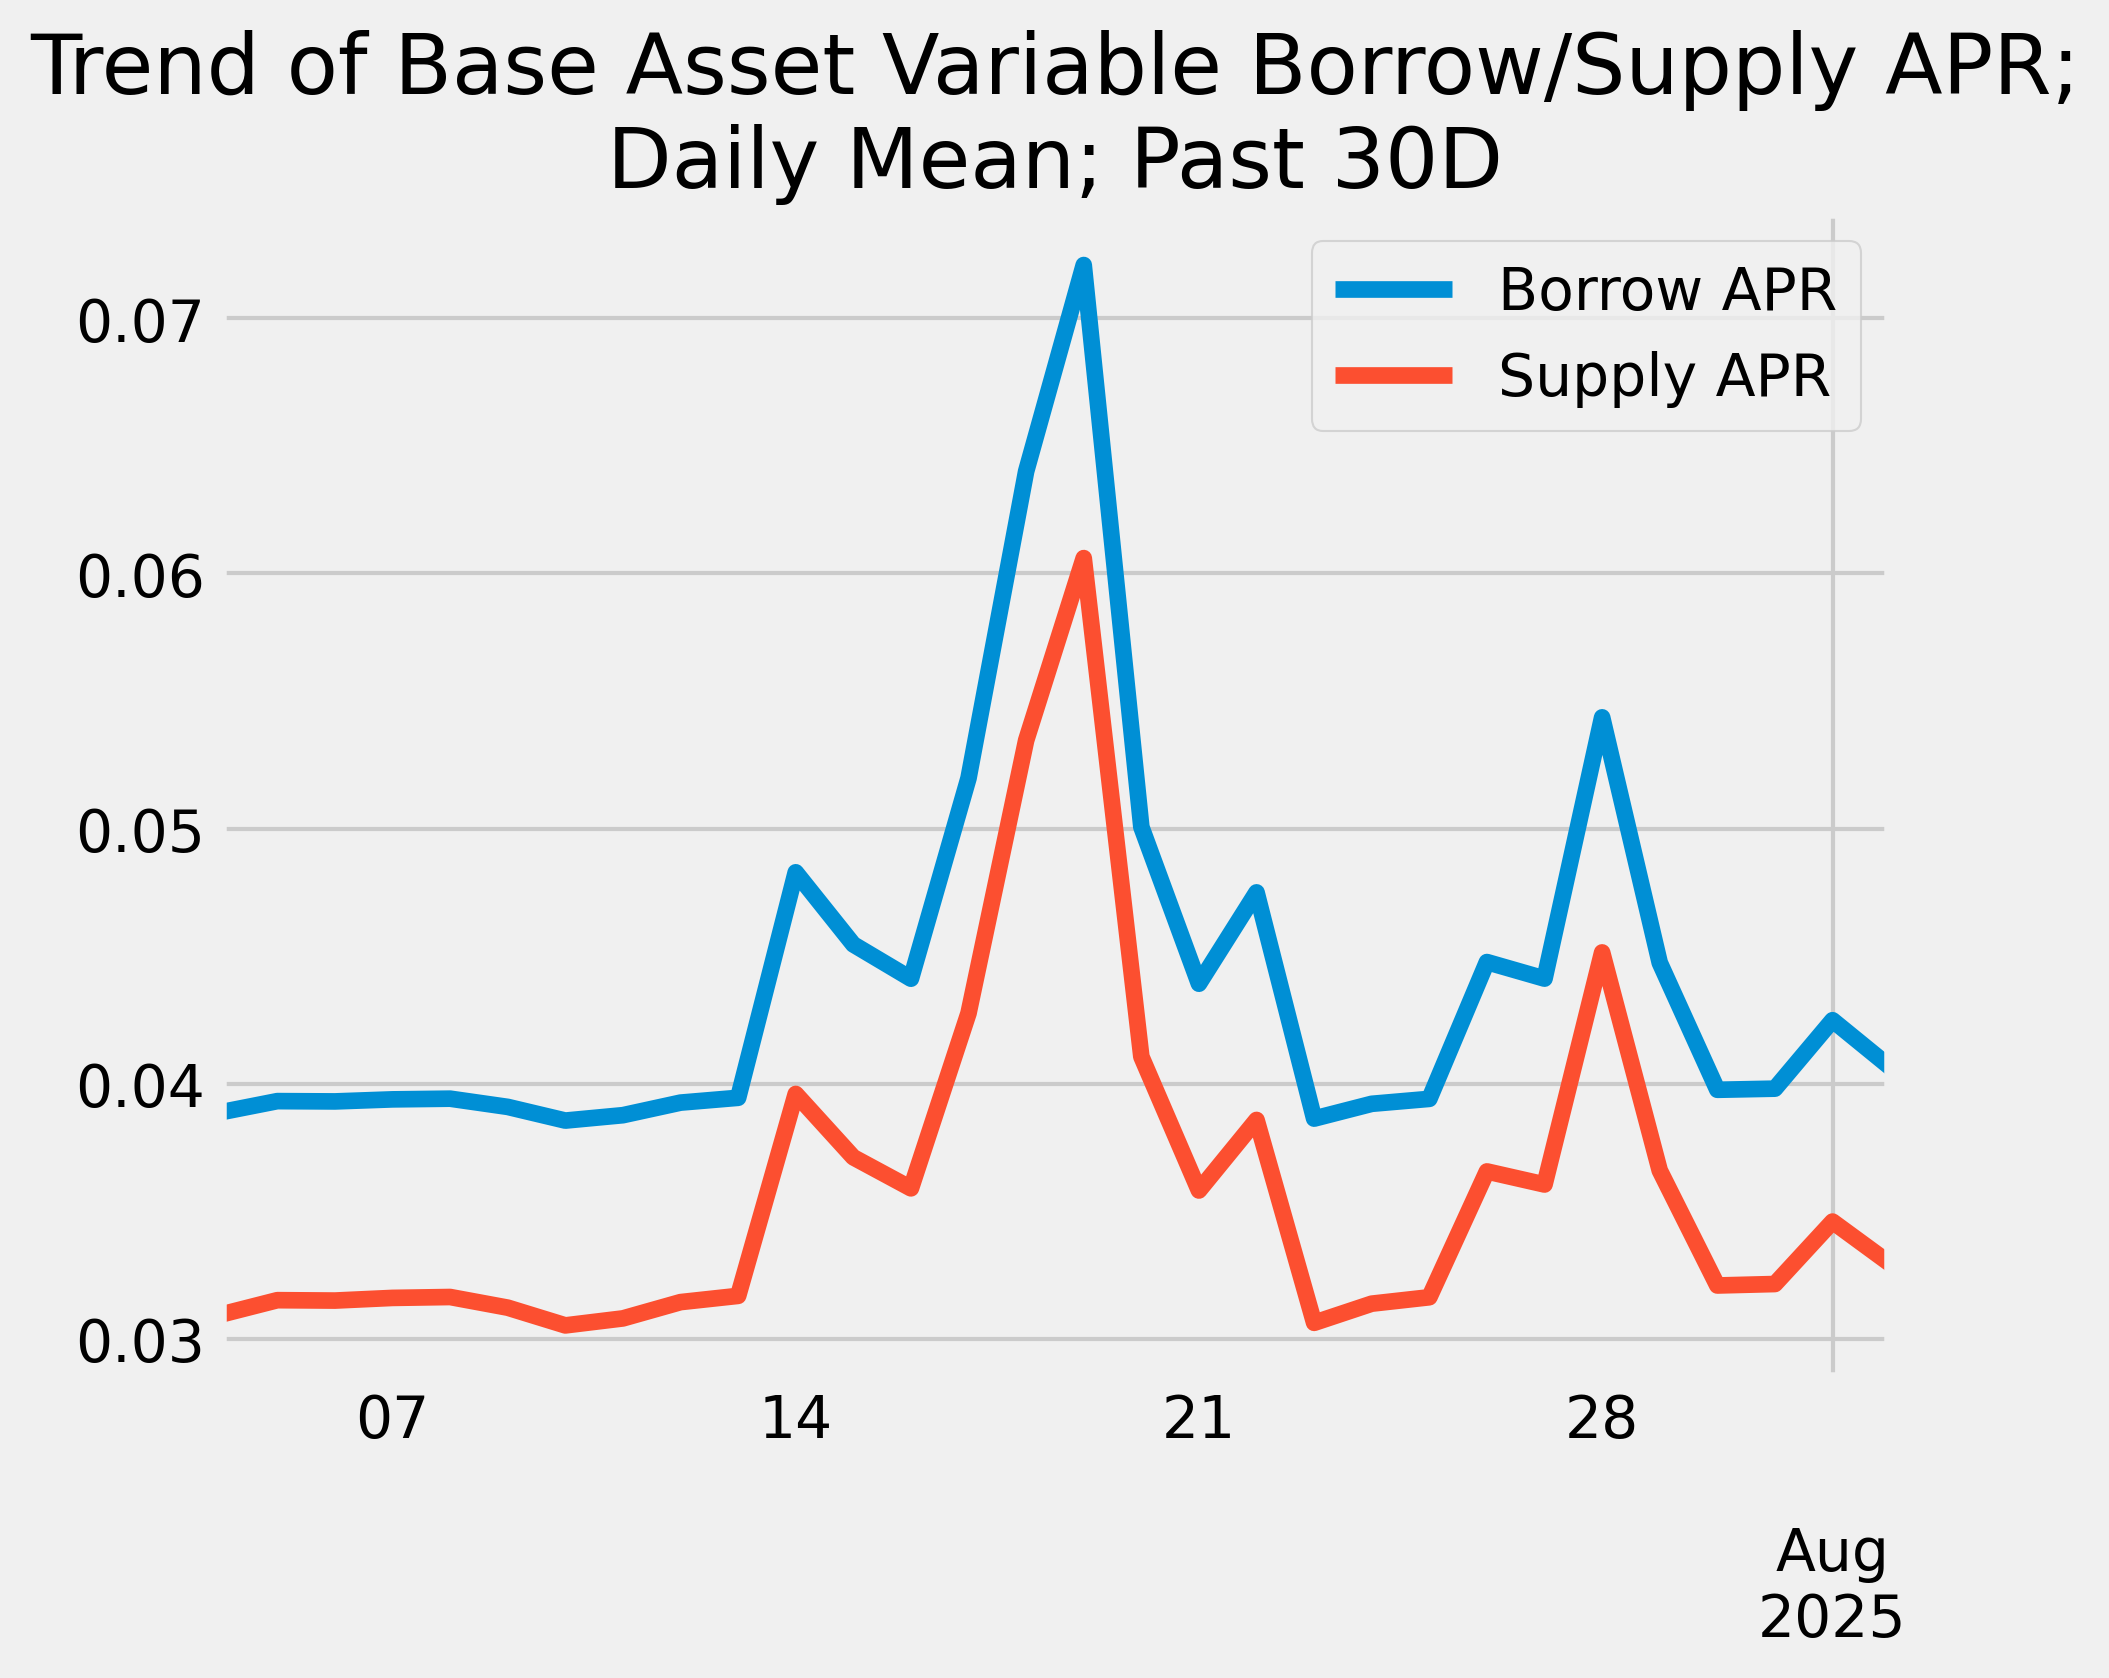
Base Asset APR Trend

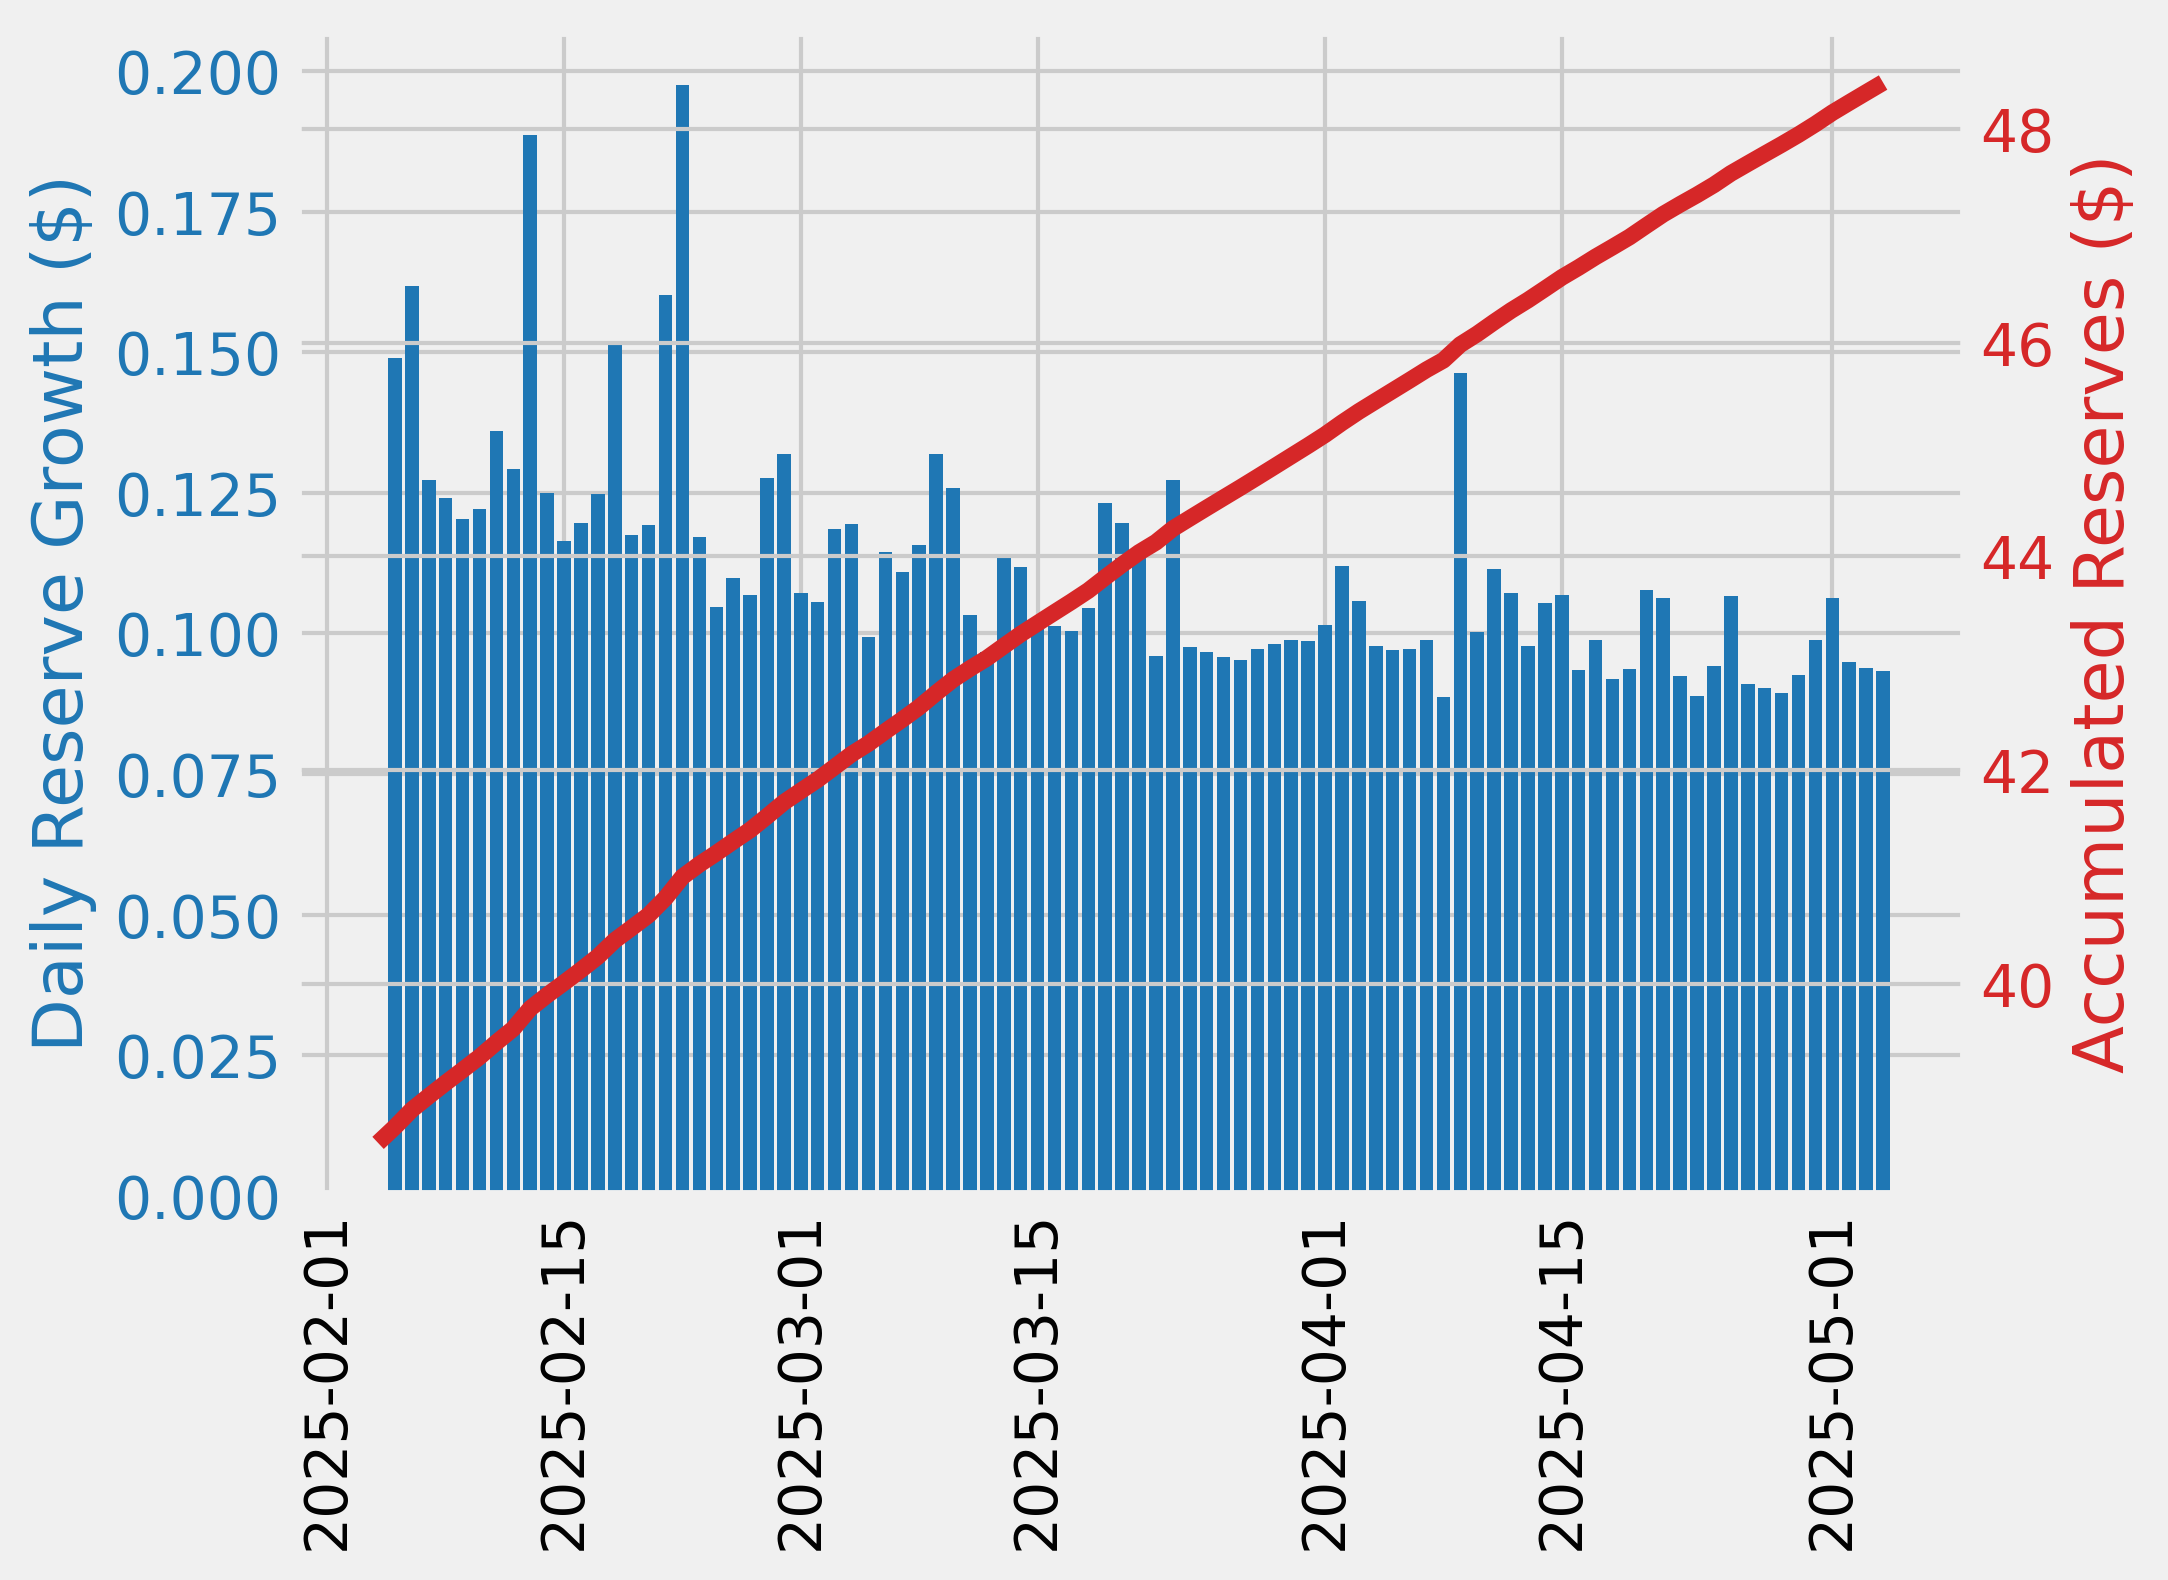
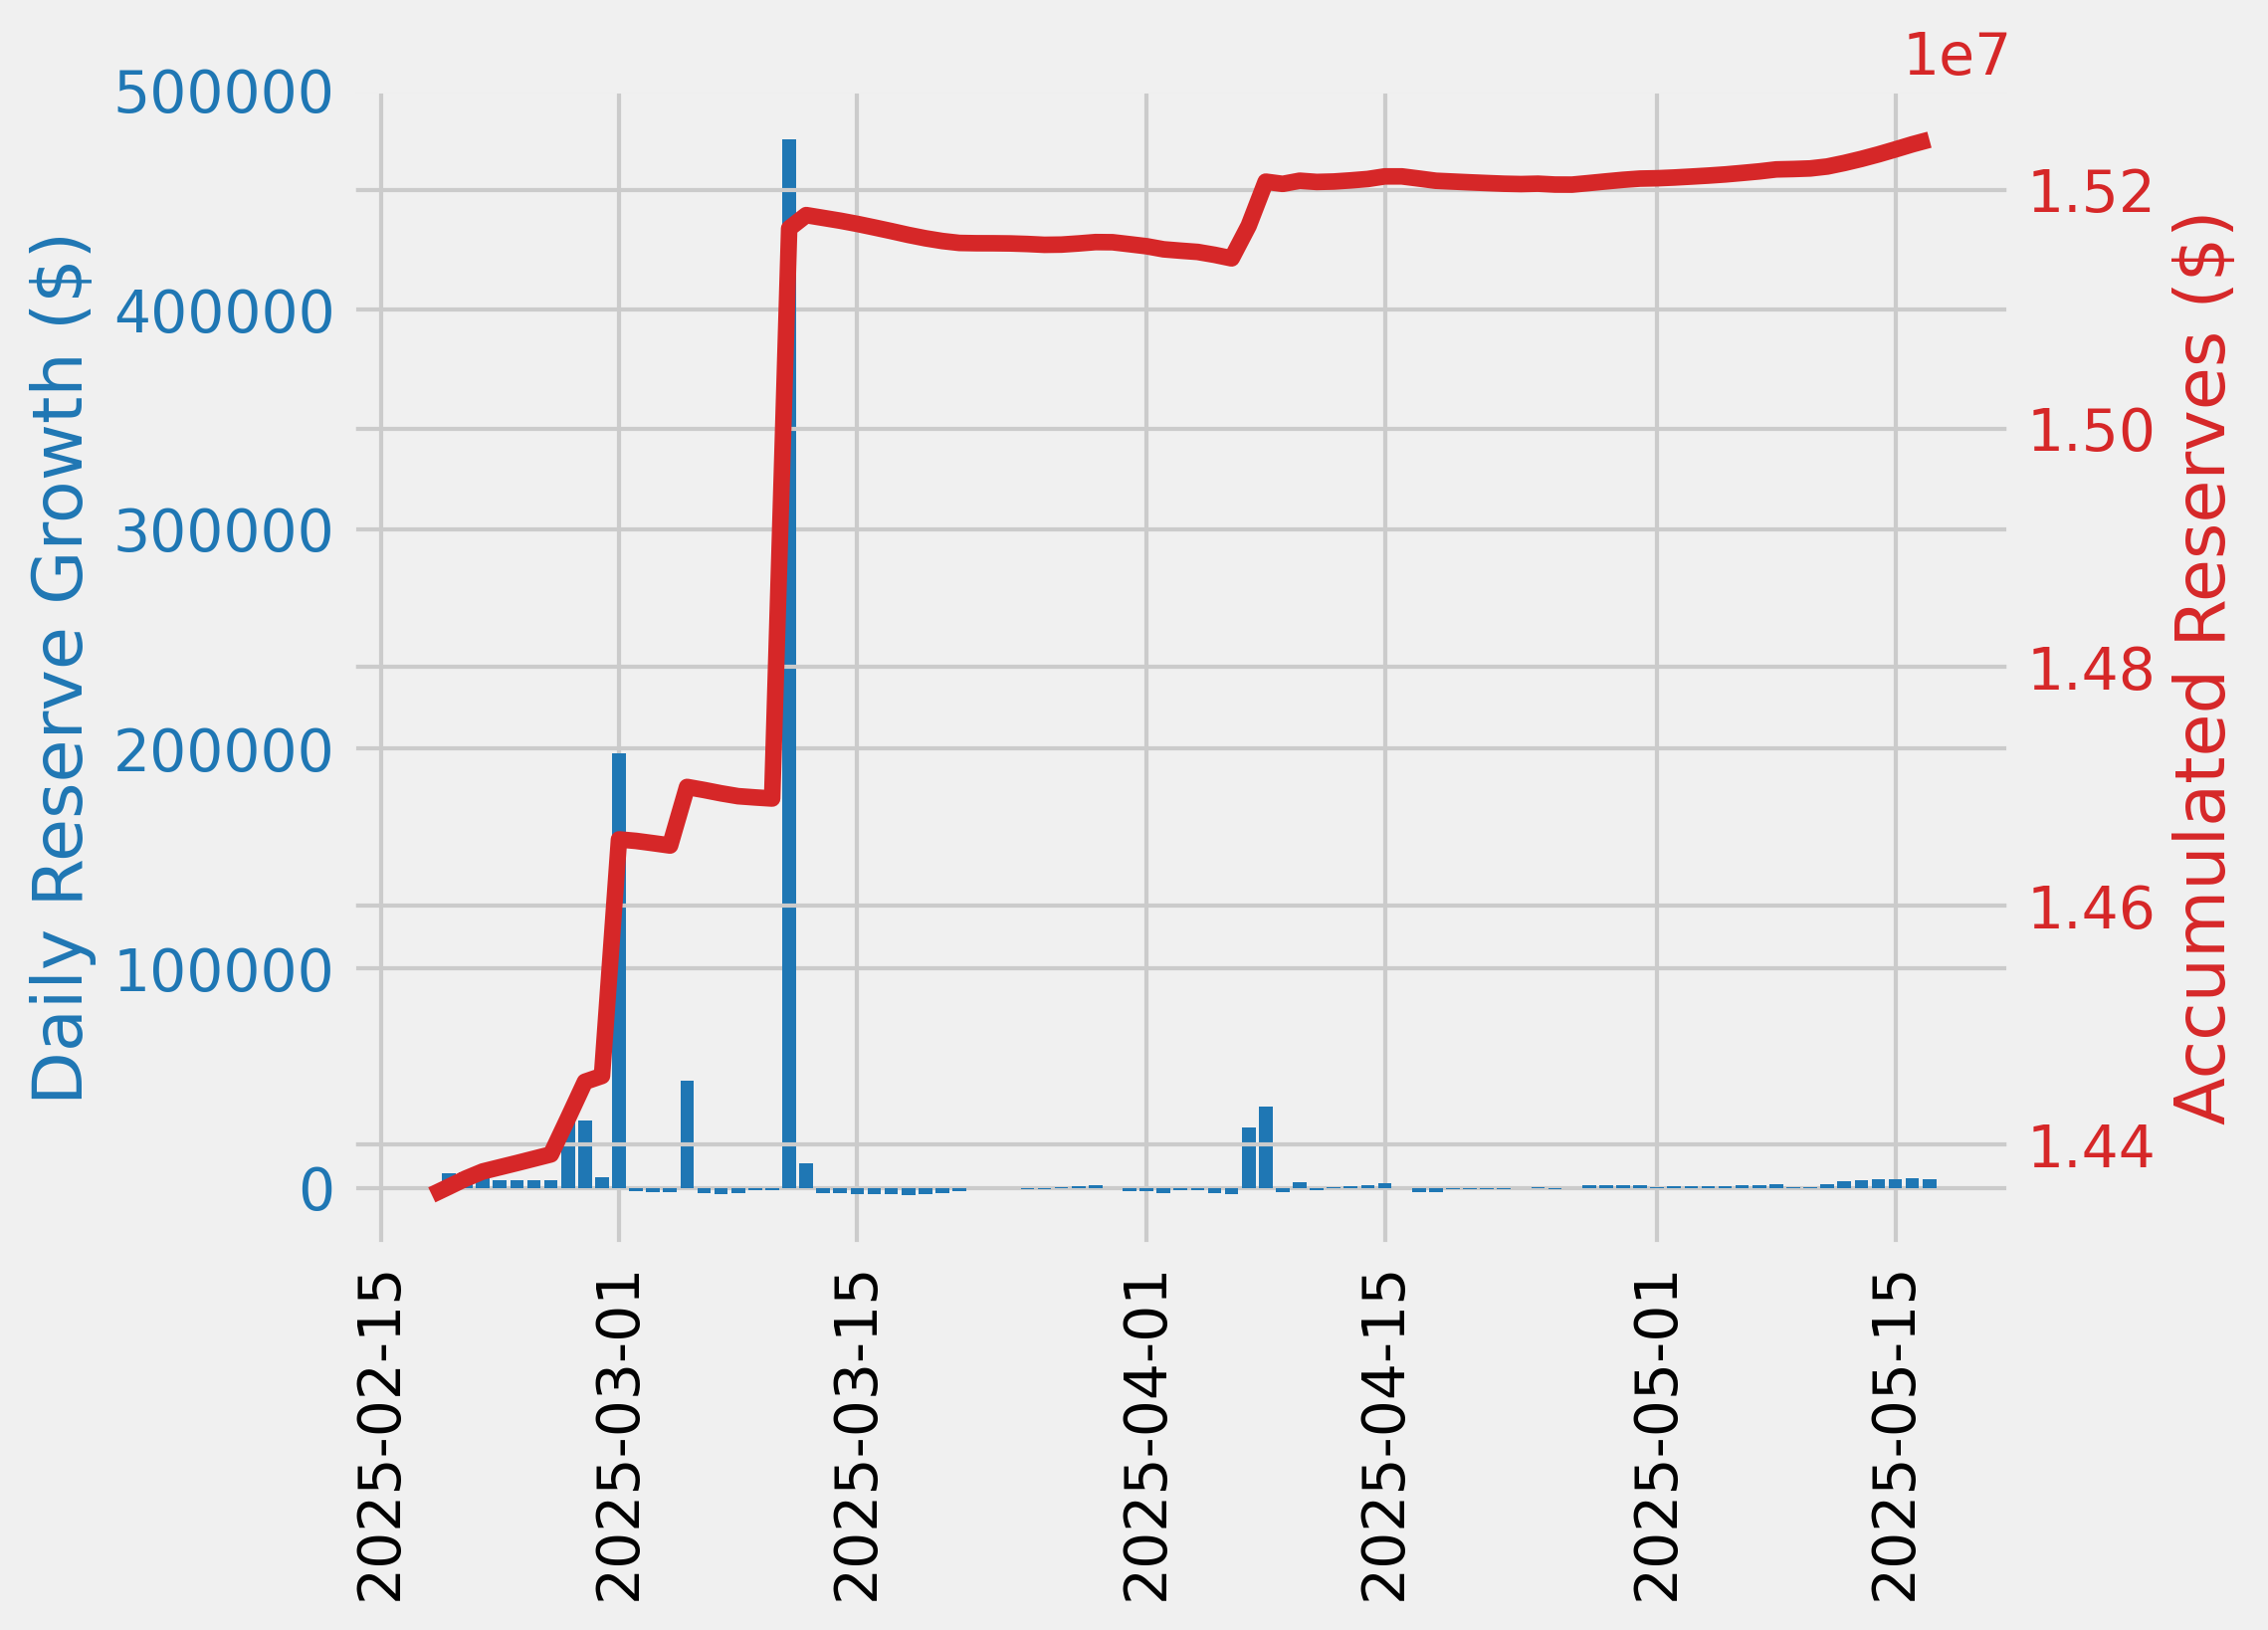
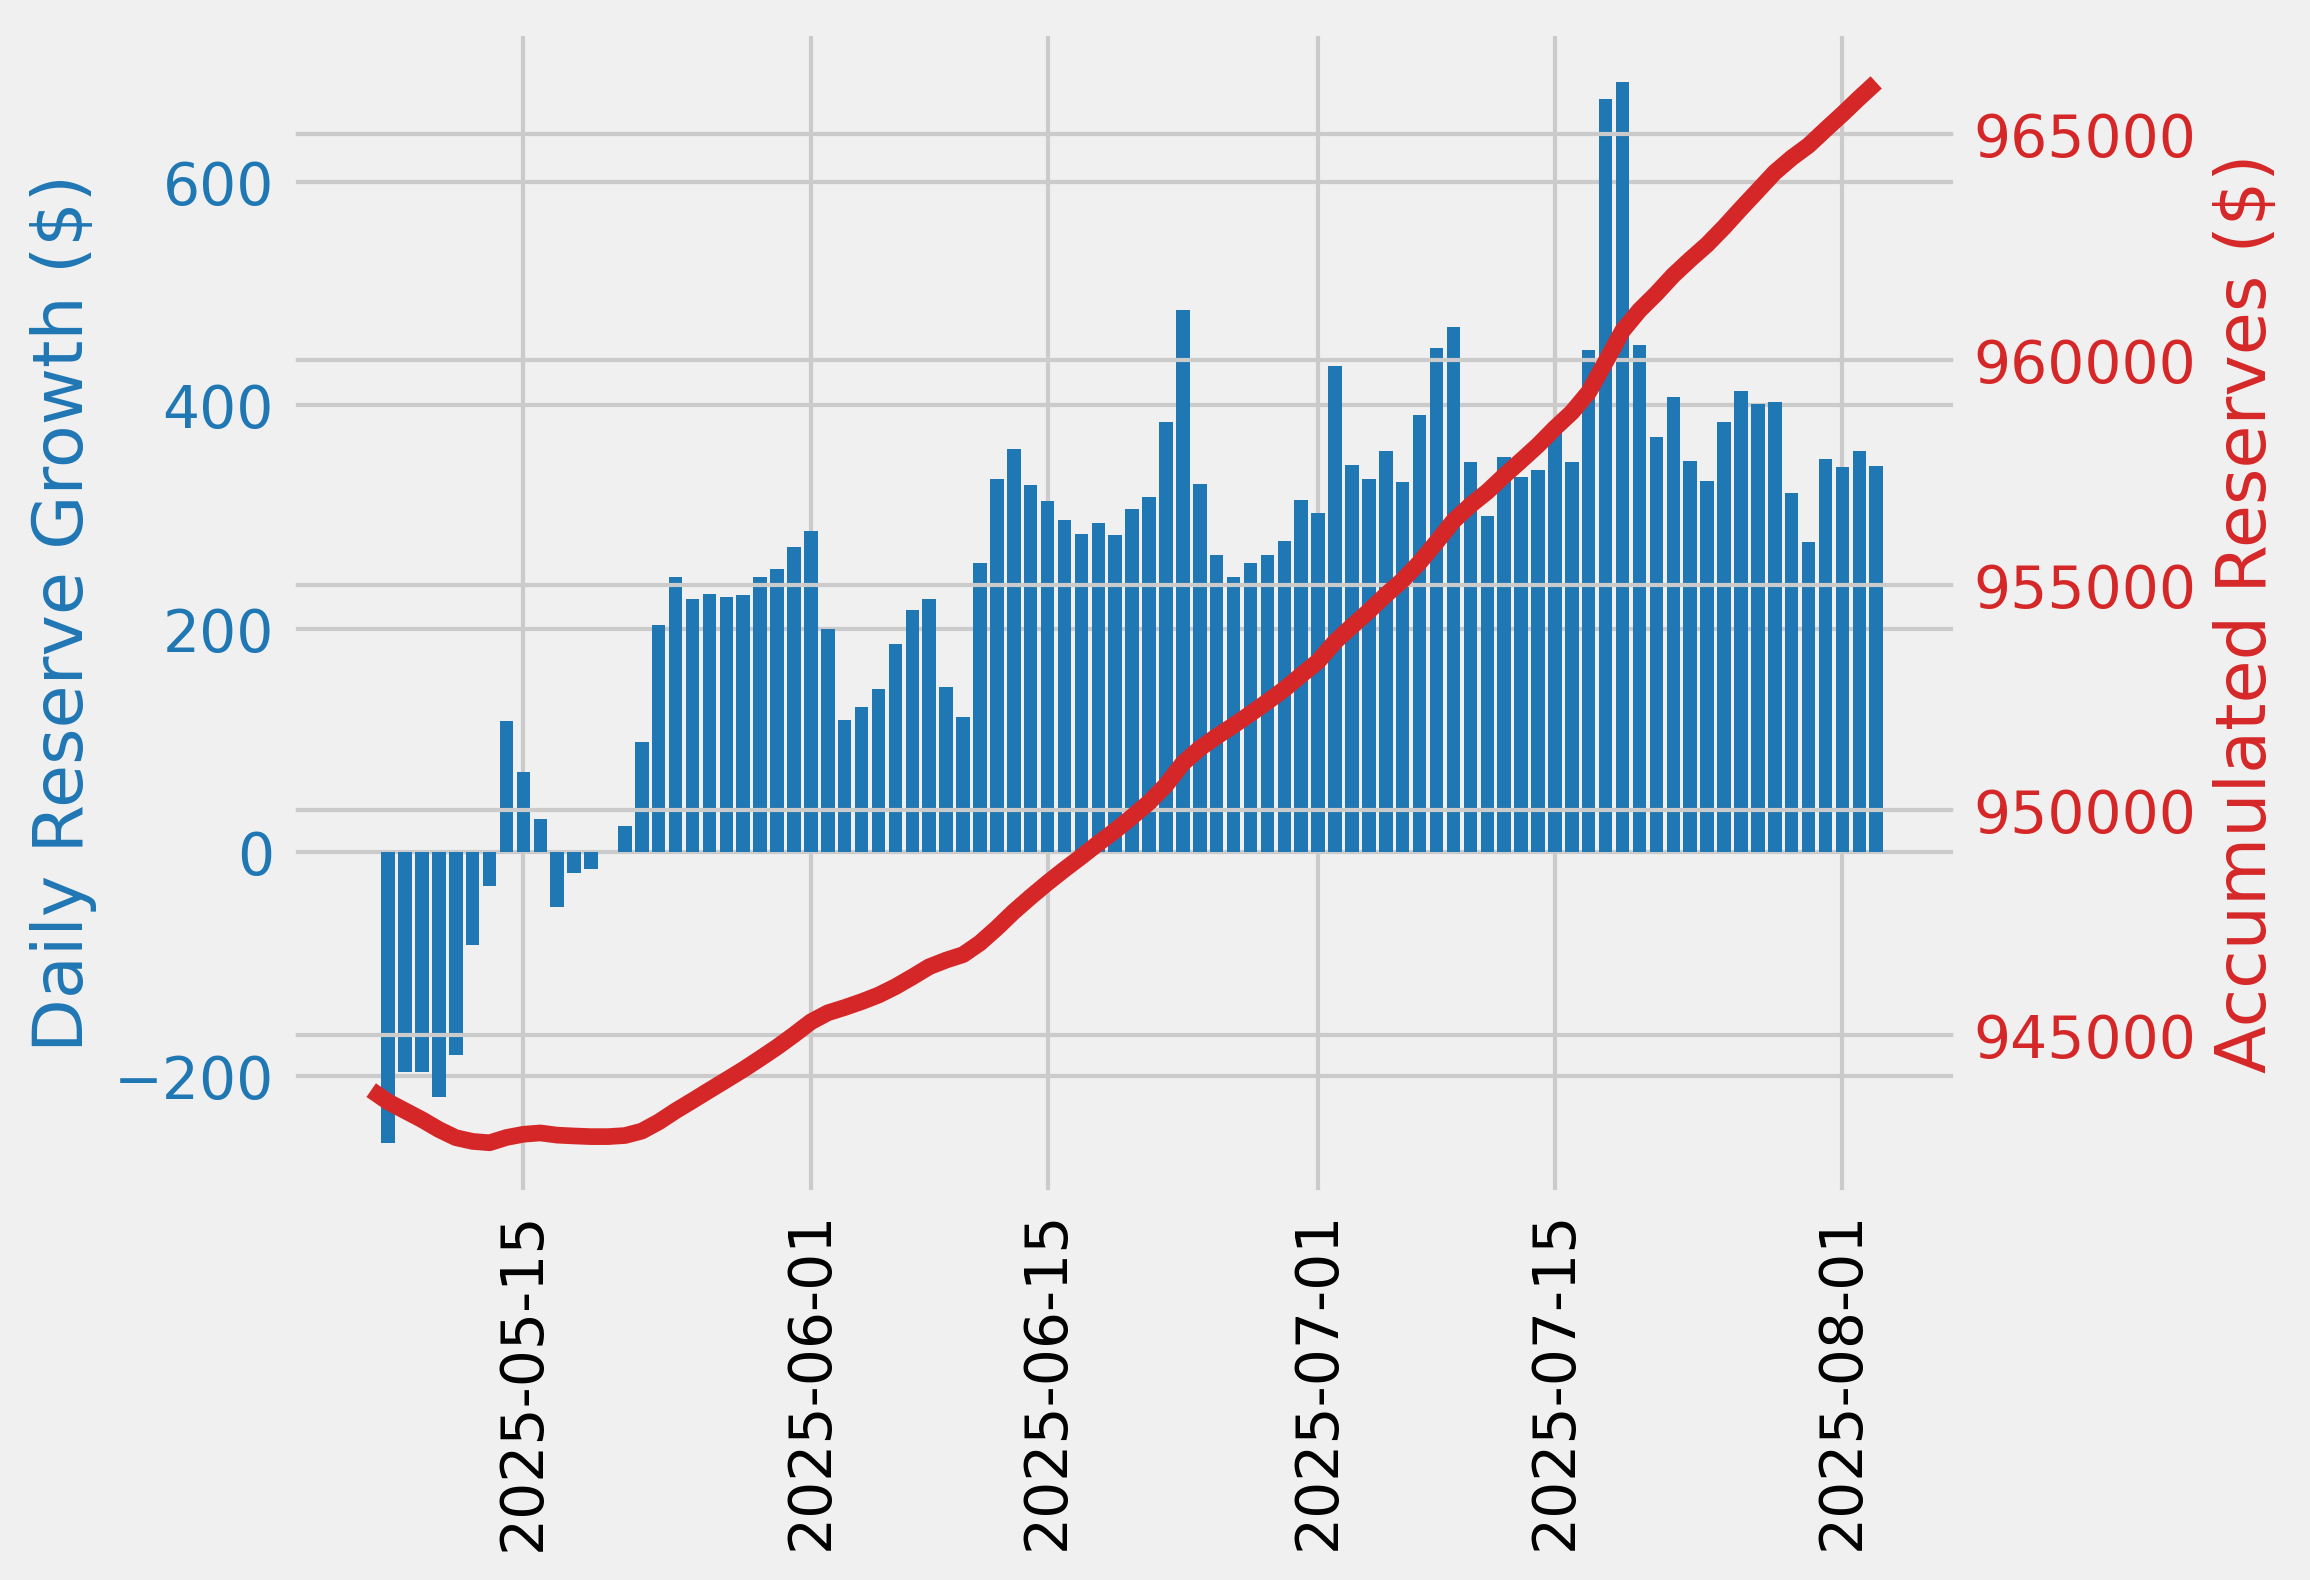
Reserve Analysis

COMP Rewards Analysis
| Chain | CometRewards COMP token holdings | Daily aggregate COMP token reward distributions | Remaining days of rewards runway (not including existing claimable rewards) |
|---|---|---|---|
| ethereum | 0.00 | 358.00 | 0.00 |
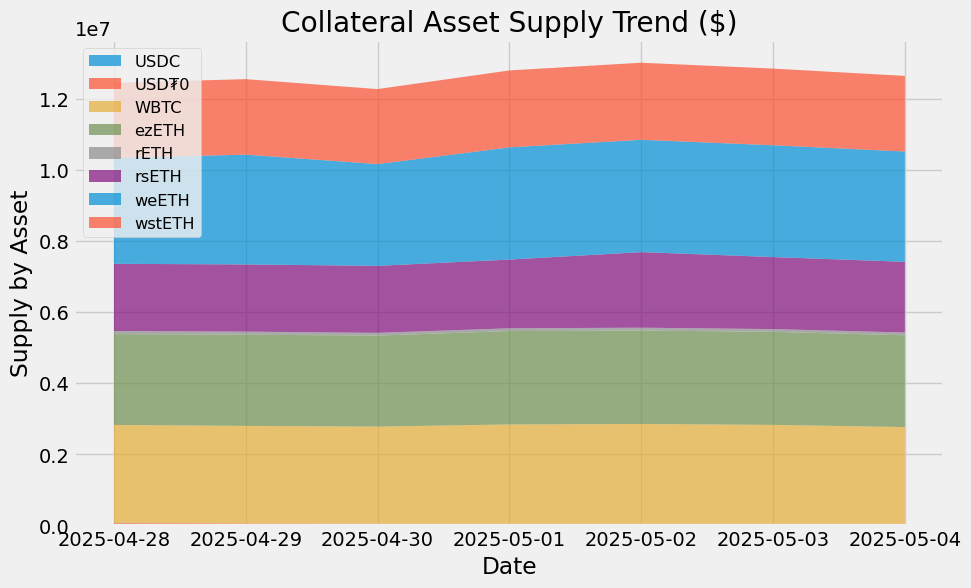
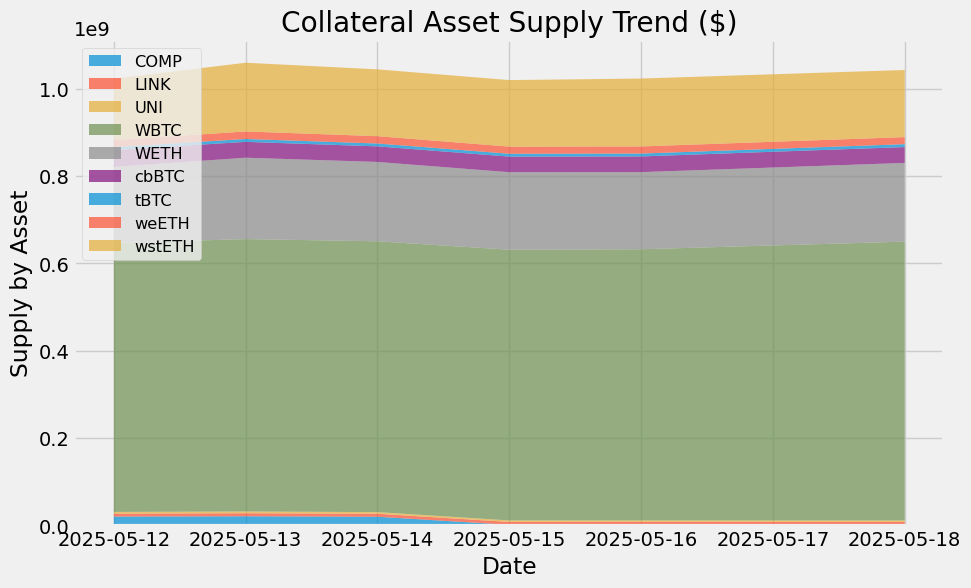
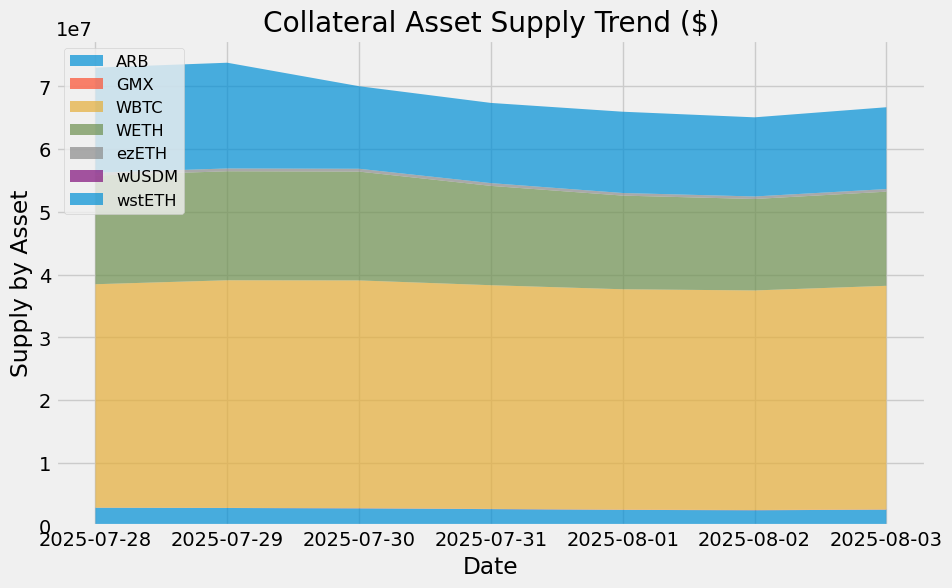
Collateral Asset Supply
This graph shows the trend of total supply of all collateral assets.

To see updated statistics, please see the live version of this graph here.
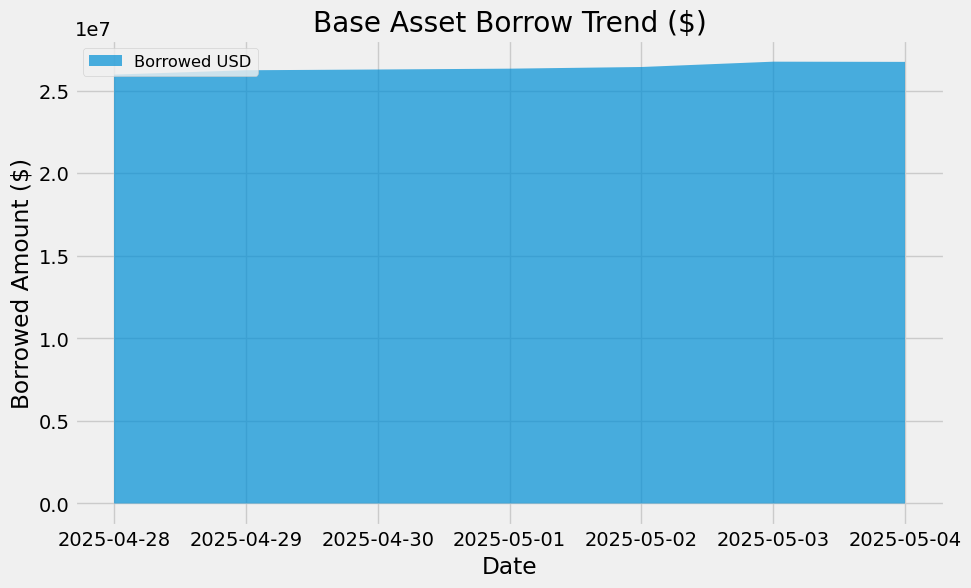
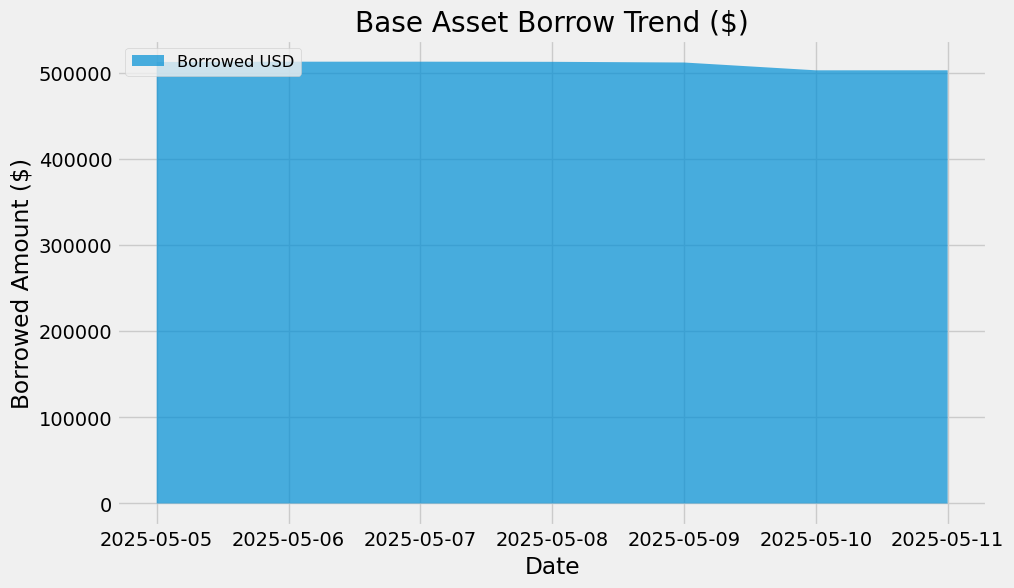
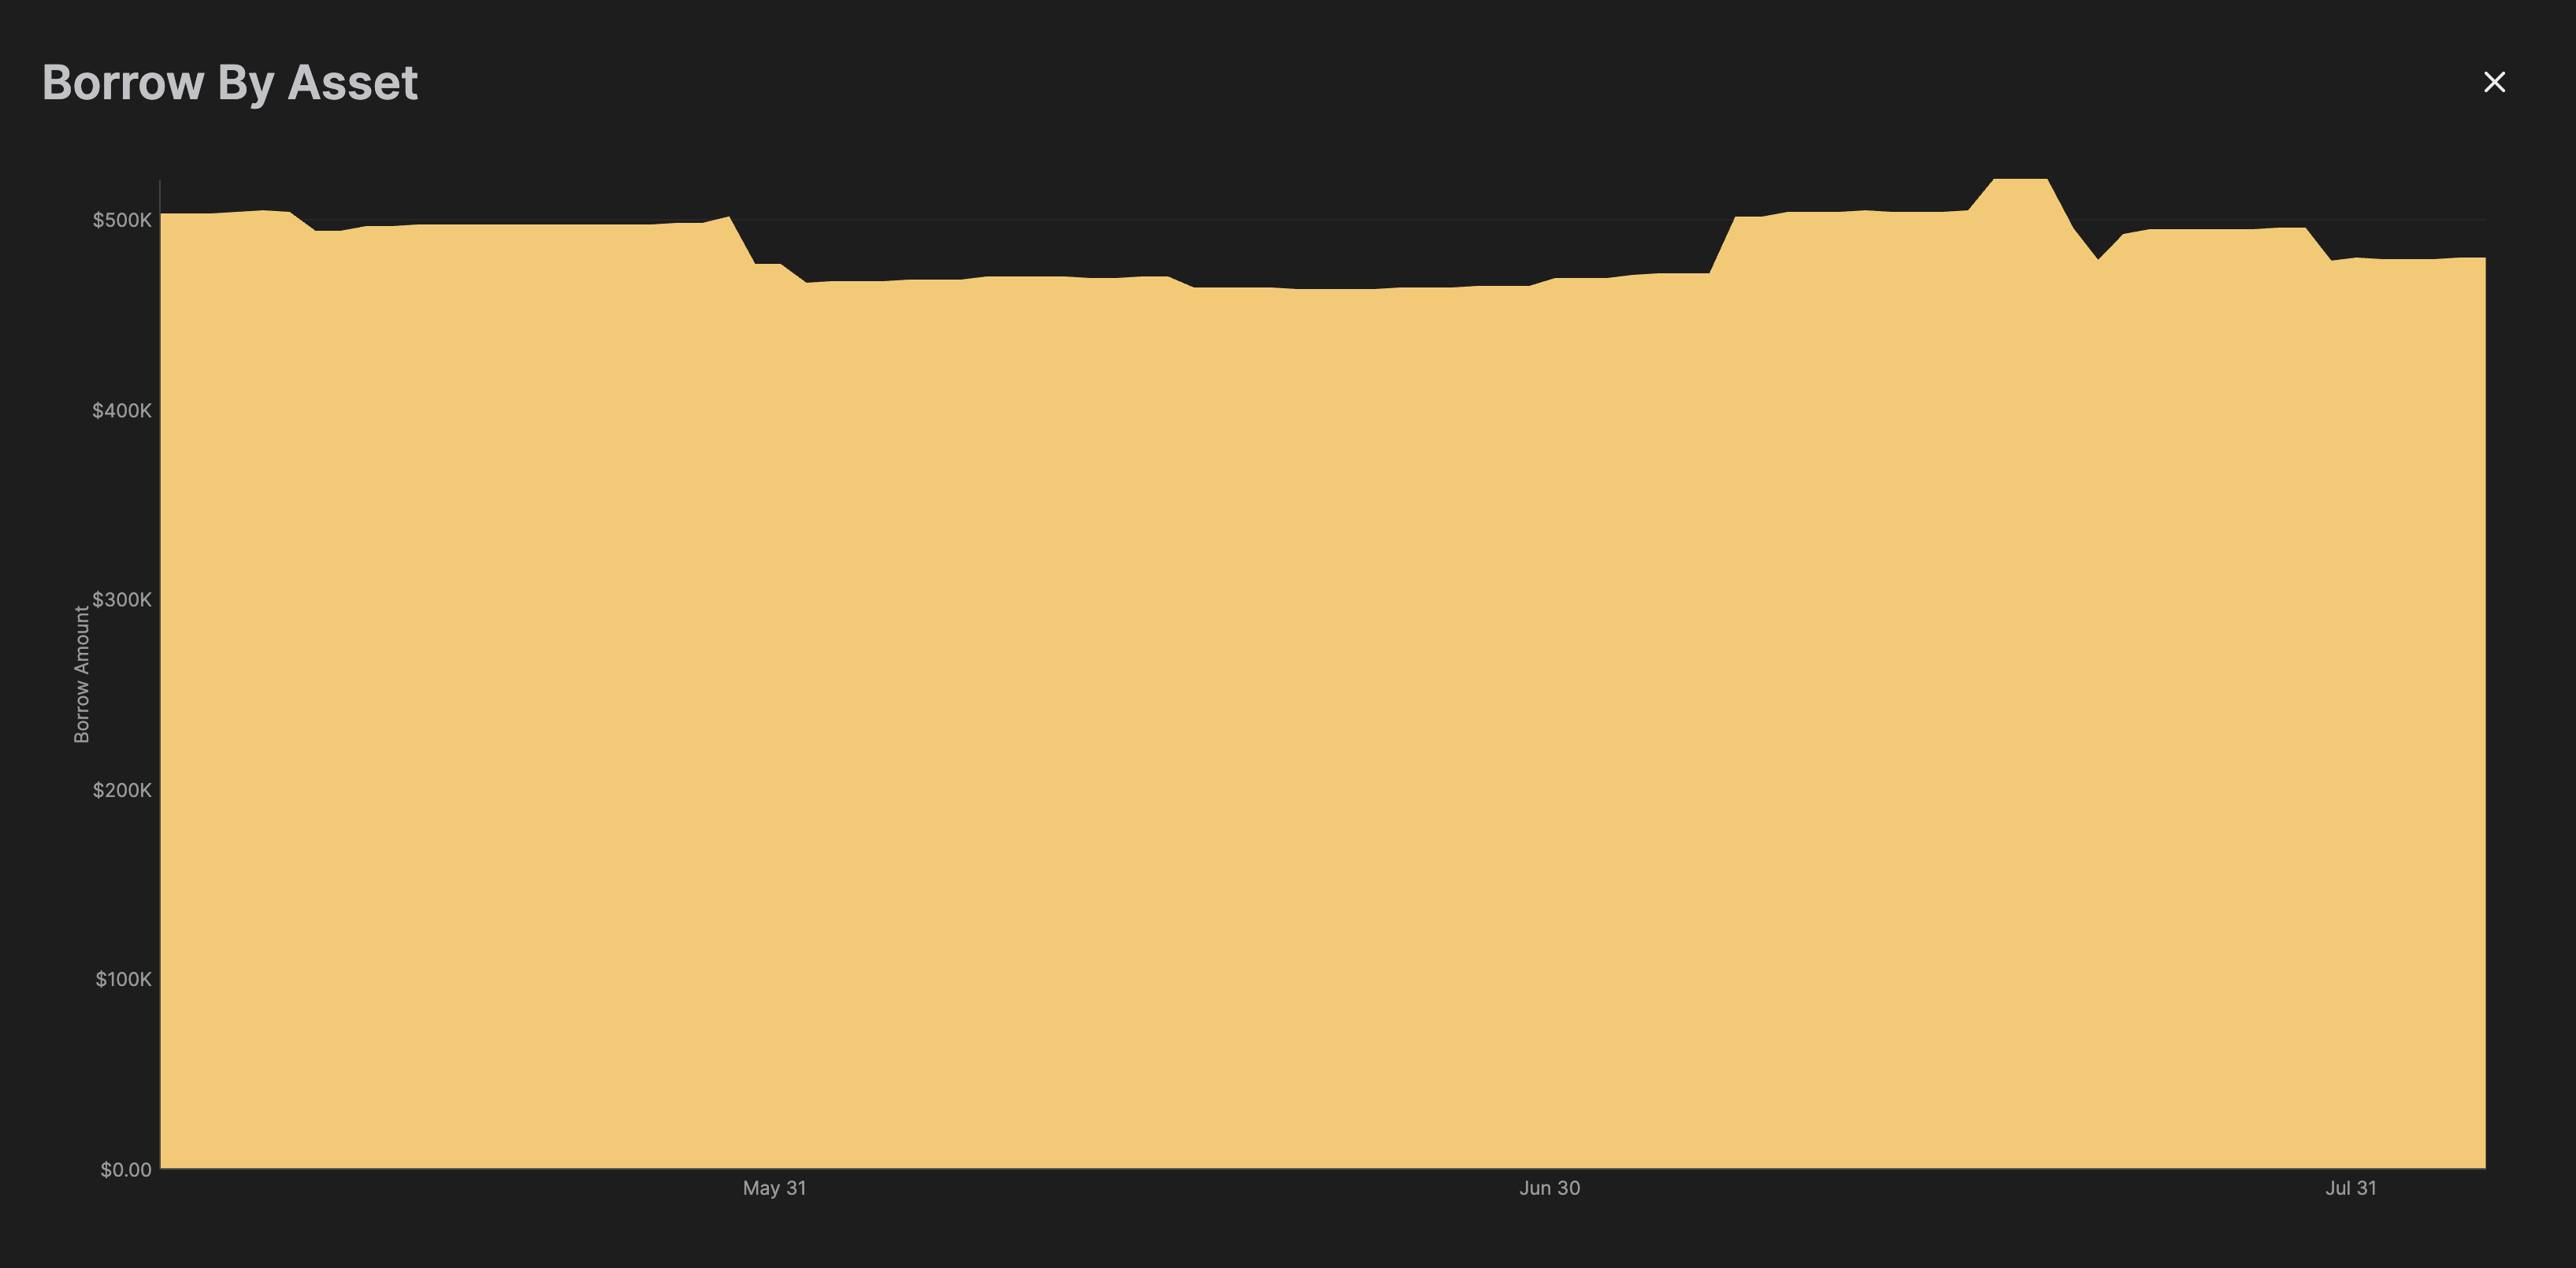
Base Asset Borrows
This graph shows the trend of total borrows of the base asset.

To see updated statistics, please see the live version of this graph here.
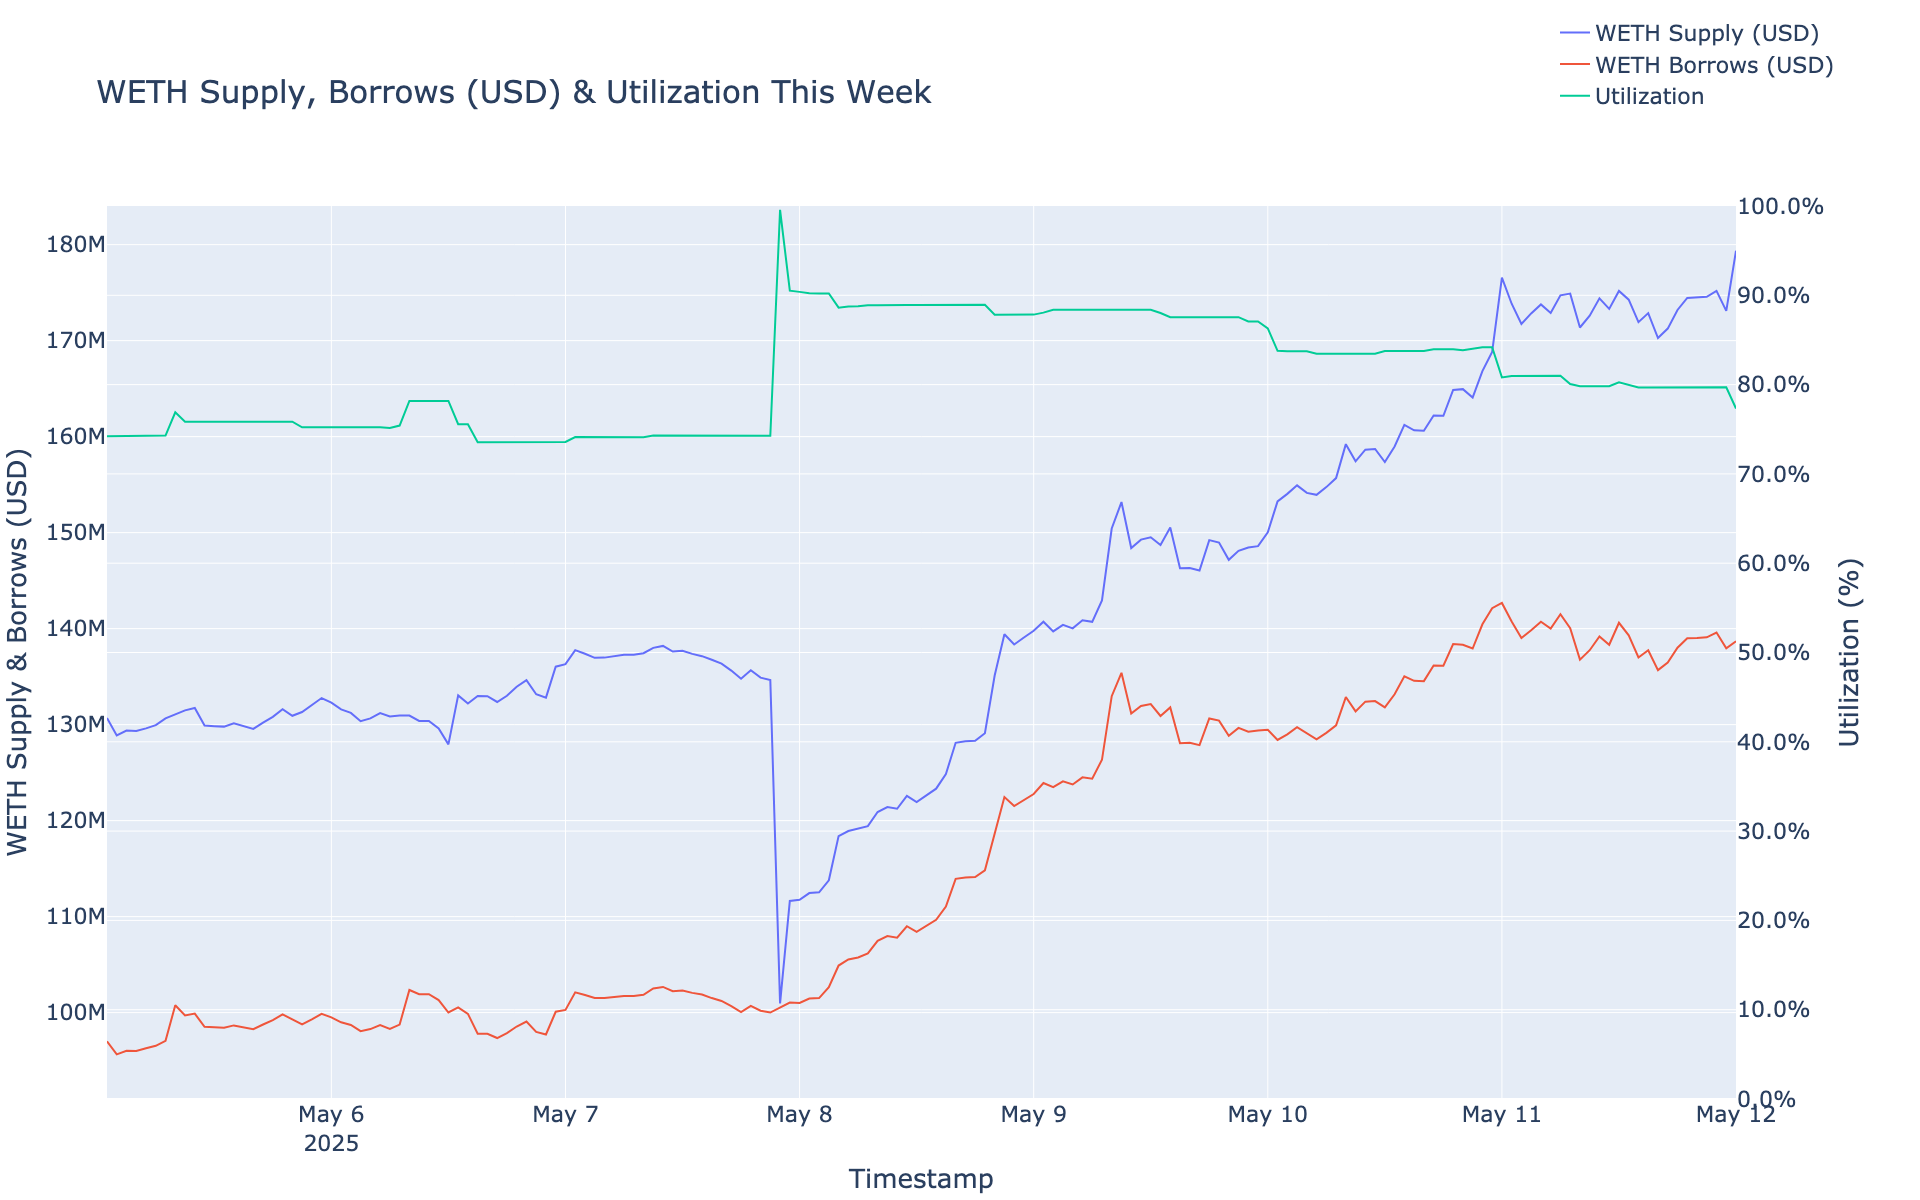
Utilization
This graph shows the utilization (borrow / supply) of the base asset over the past week.

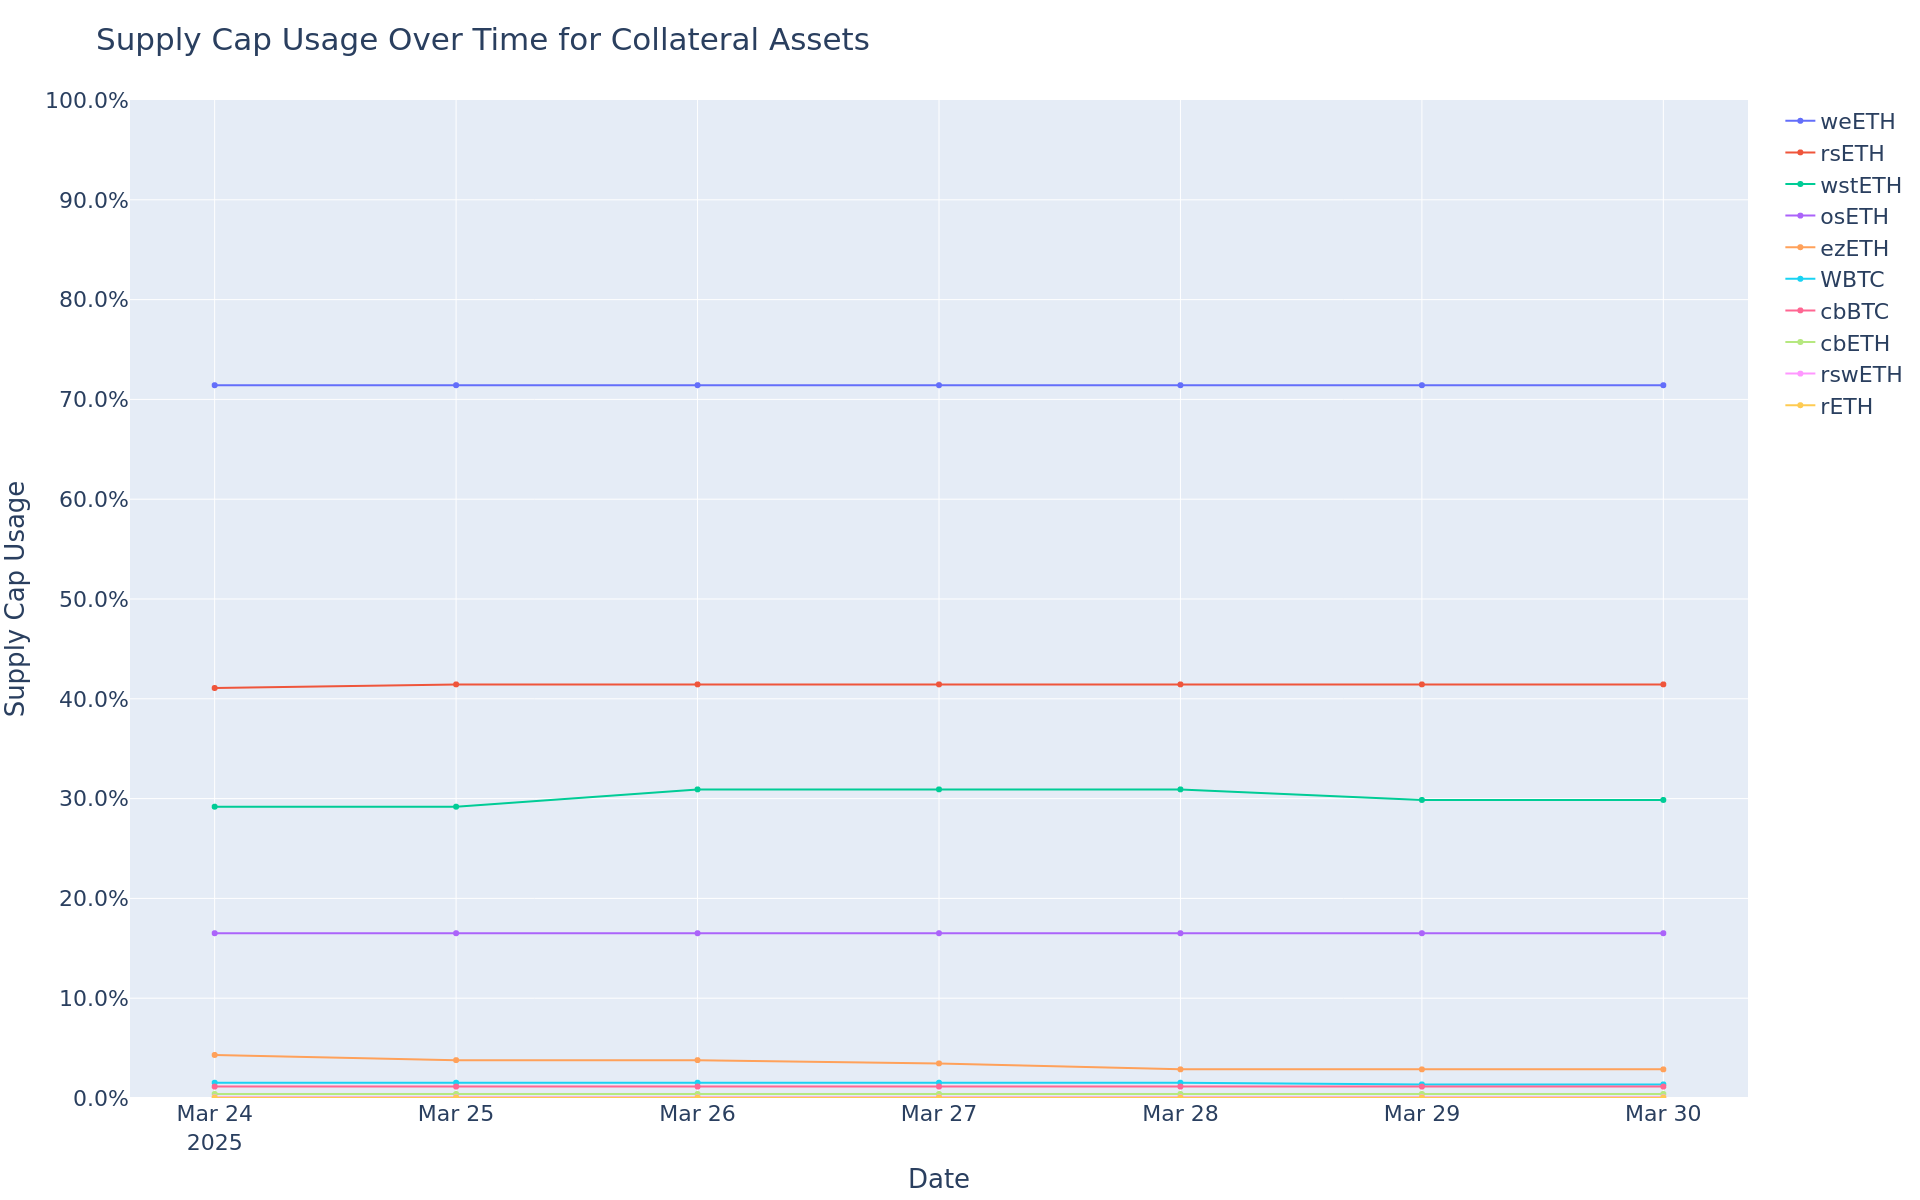
Supply Cap Usage
This graph shows the supply cap usage (supply / supply cap) of all collateral assets over the past week.

ethereum WETH Comet
Simple Summary
-
WETH Borrows decreased 11.18%, from $128.00M to $113.68M.
-
WETH Supply decreased 6.66%, from $142.39M to $132.91M.
-
WETH utilization decreased 4.85%, from 89.89% to 85.53%.
-
The minimum WETH reserve growth was 7.07%, and the maximum was 9.80%. The average WETH reserve growth was 8.28%.
-
The comet accumulated $4.57K WETH reserves while distributing 15.88K COMP rewards for a weekly Net Protocol Profit of -11.31K.
Base Asset APR Trend

Reserve Analysis

COMP Rewards Analysis
| Chain | CometRewards COMP token holdings | Daily aggregate COMP token reward distributions | Remaining days of rewards runway (not including existing claimable rewards) |
|---|---|---|---|
| ethereum | 0.00 | 358.00 | 0.00 |
Collateral Asset Supply
This graph shows the trend of total supply of all collateral assets.

To see updated statistics, please see the live version of this graph here.
Base Asset Borrows
This graph shows the trend of total borrows of the base asset.

To see updated statistics, please see the live version of this graph here.
Utilization
This graph shows the utilization (borrow / supply) of the base asset over the past week.

Supply Cap Usage
This graph shows the supply cap usage (supply / supply cap) of all collateral assets over the past week.

ethereum wstETH Comet
Simple Summary
-
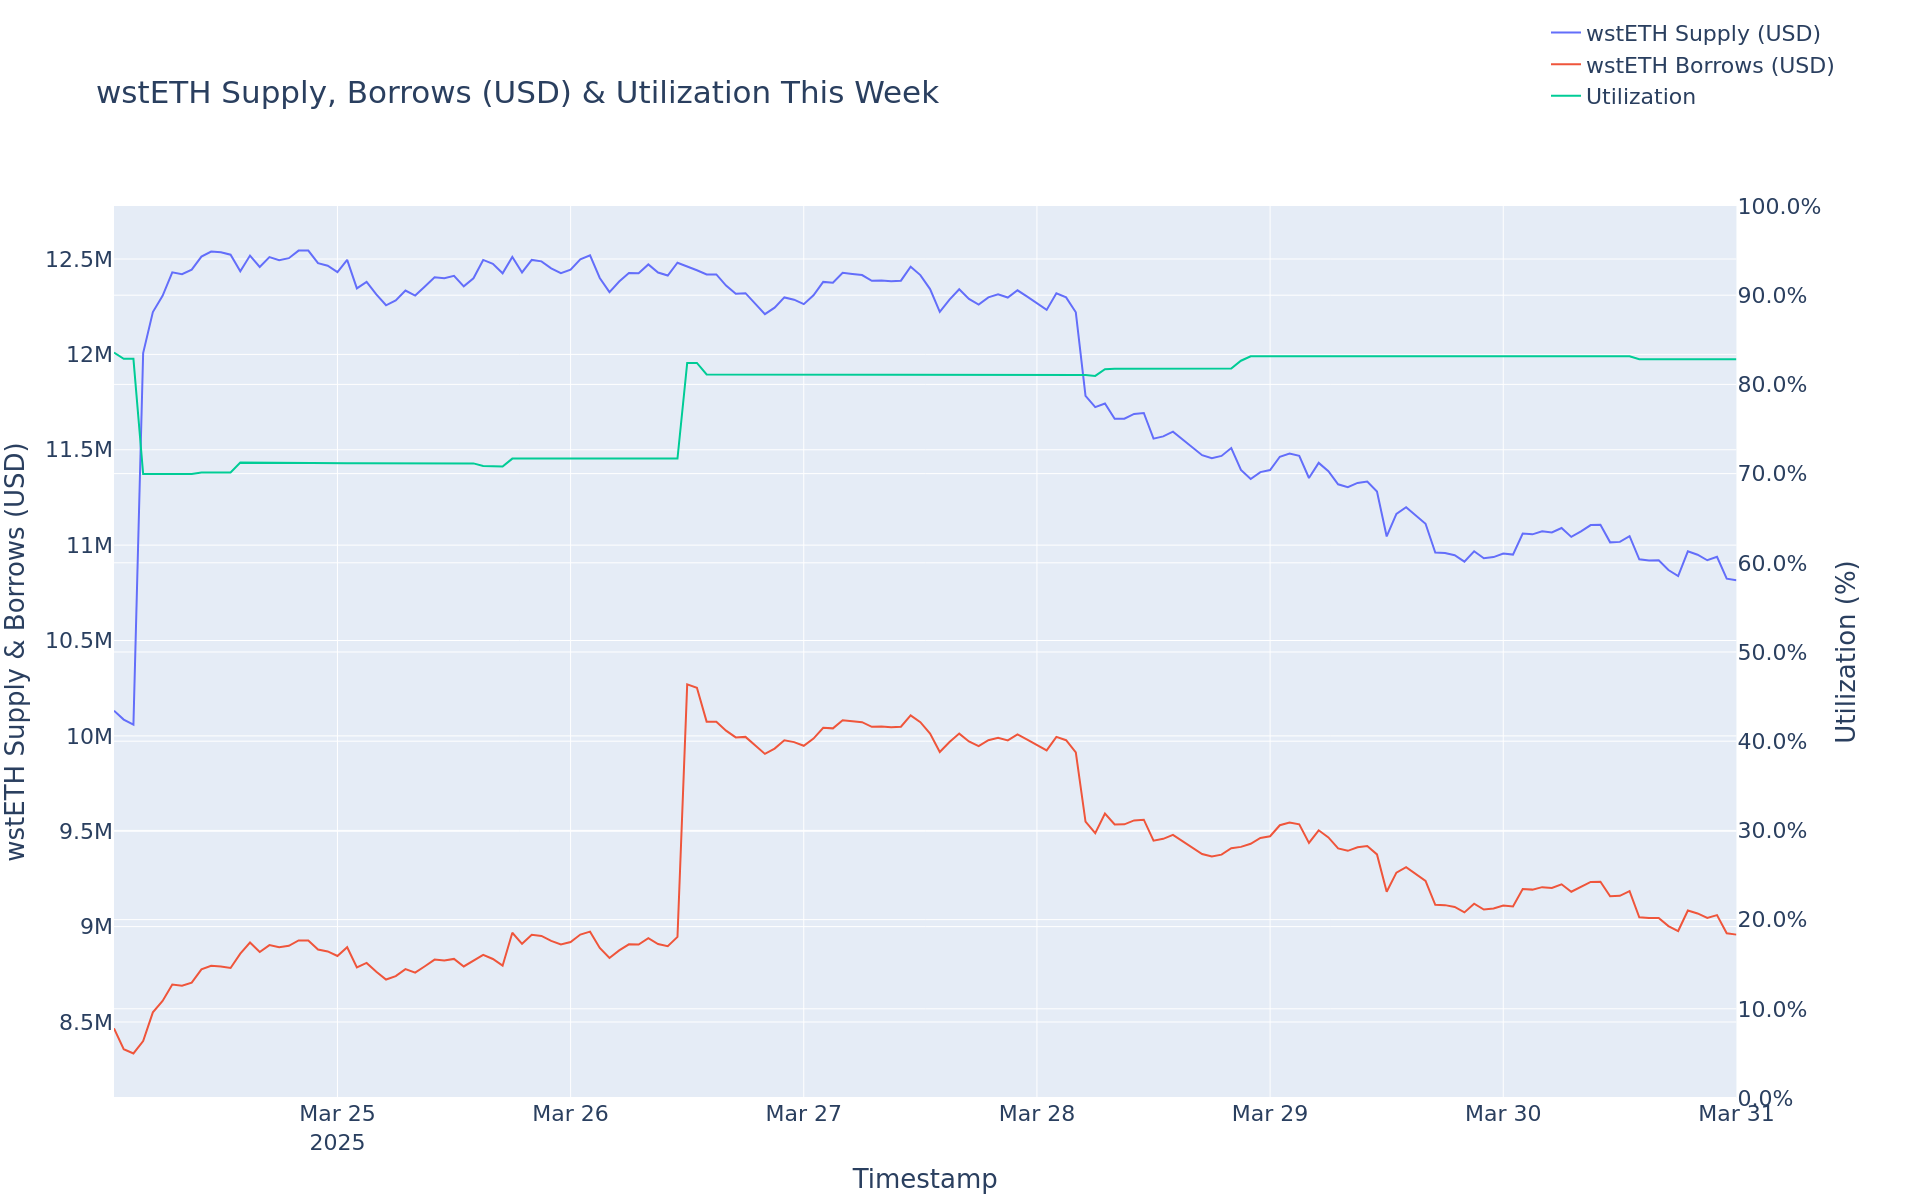
wstETH Borrows increased 10.95%, from $6.18M to $6.86M.
-
wstETH Supply decreased 17.22%, from $12.10M to $10.02M.
-
wstETH utilization increased 34.04%, from 51.07% to 68.45%.
-
The minimum wstETH reserve growth was 28.84%, and the maximum was 39.01%. The average wstETH reserve growth was 36.22%.
-
The comet accumulated $893.45 wstETH reserves while distributing 3.46K COMP rewards for a weekly Net Protocol Profit of -2.57K.
Base Asset APR Trend

Reserve Analysis

COMP Rewards Analysis
| Chain | CometRewards COMP token holdings | Daily aggregate COMP token reward distributions | Remaining days of rewards runway (not including existing claimable rewards) |
|---|---|---|---|
| ethereum | 0.00 | 358.00 | 0.00 |
Collateral Asset Supply
This graph shows the trend of total supply of all collateral assets.

To see updated statistics, please see the live version of this graph here.
Base Asset Borrows
This graph shows the trend of total borrows of the base asset.

To see updated statistics, please see the live version of this graph here.
Utilization
This graph shows the utilization (borrow / supply) of the base asset over the past week.

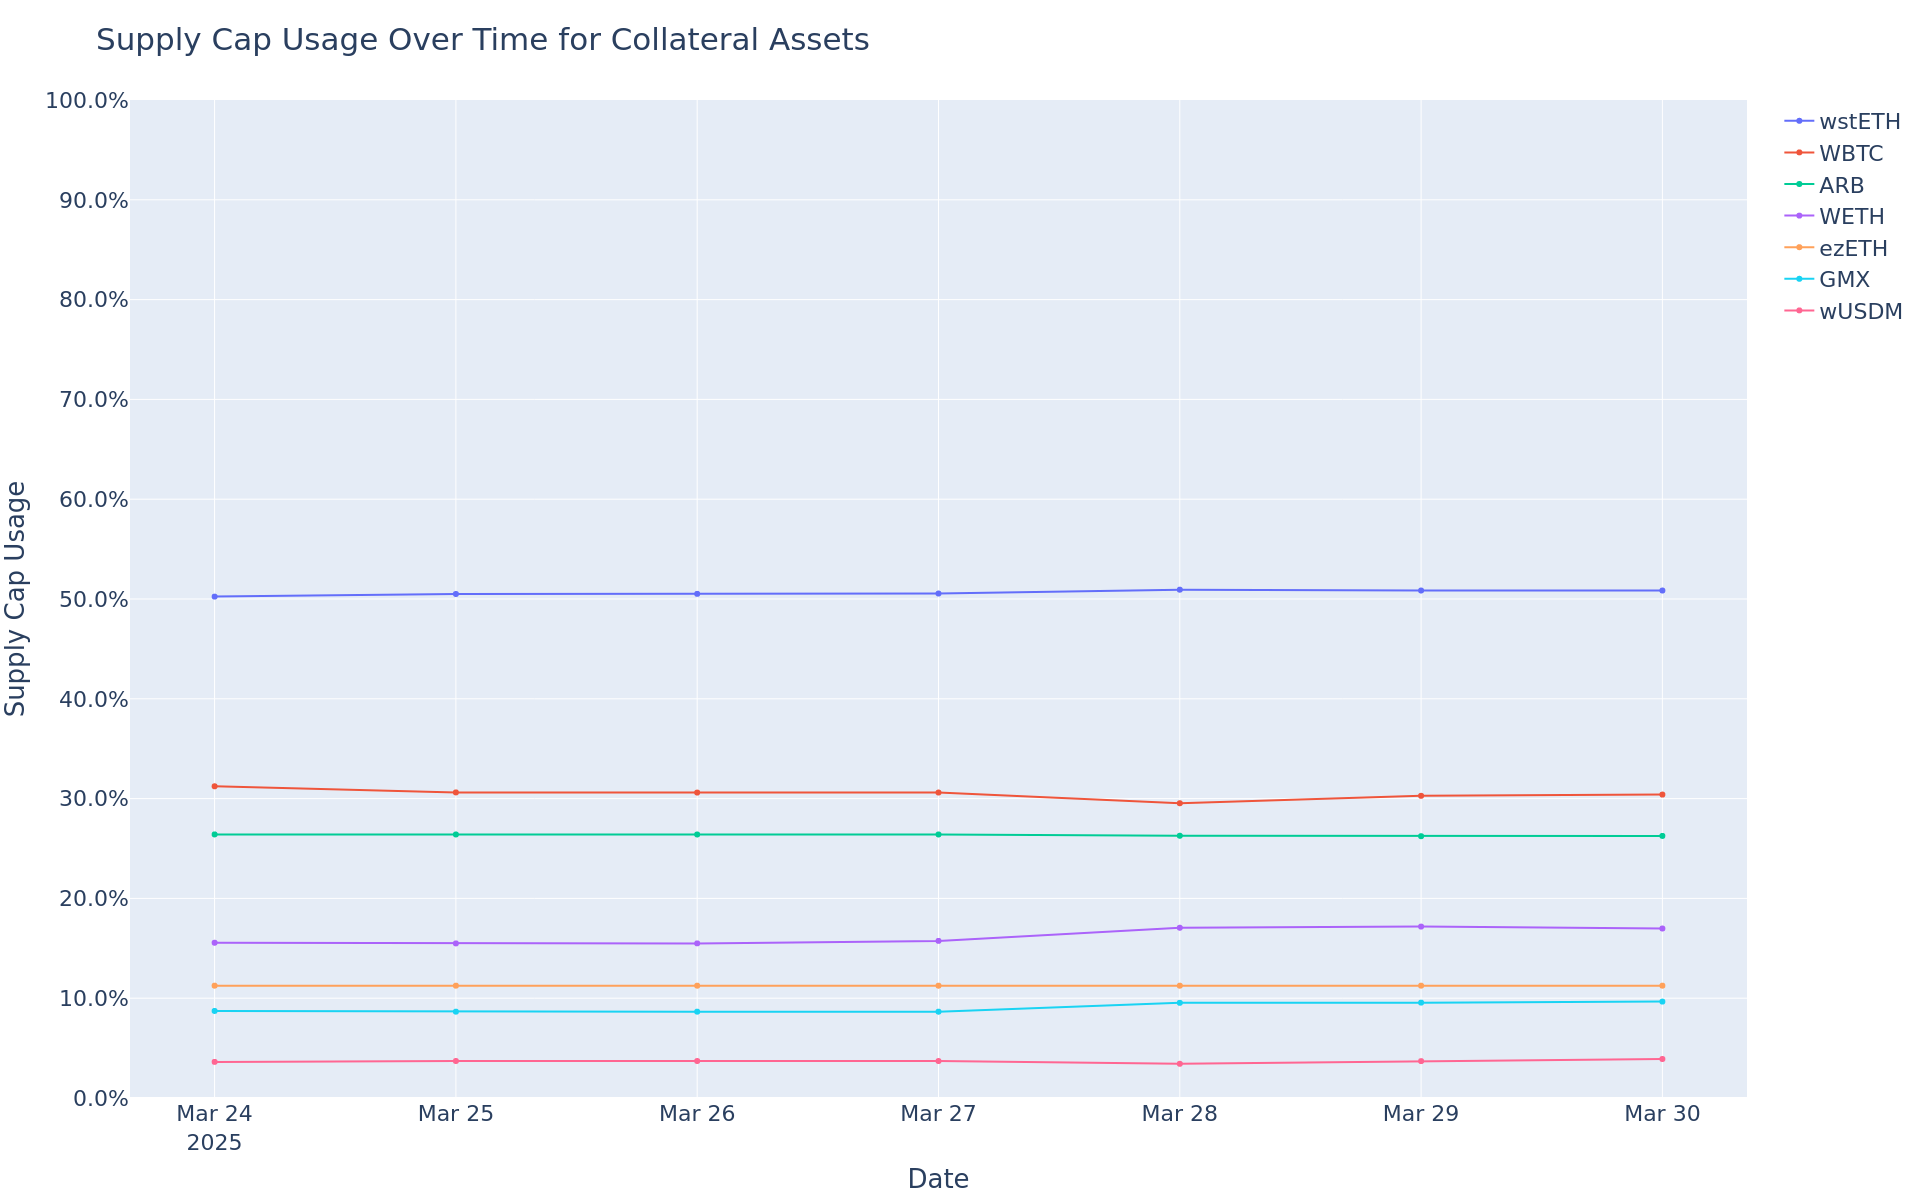
Supply Cap Usage
This graph shows the supply cap usage (supply / supply cap) of all collateral assets over the past week.

ethereum USDS Comet
Simple Summary
-
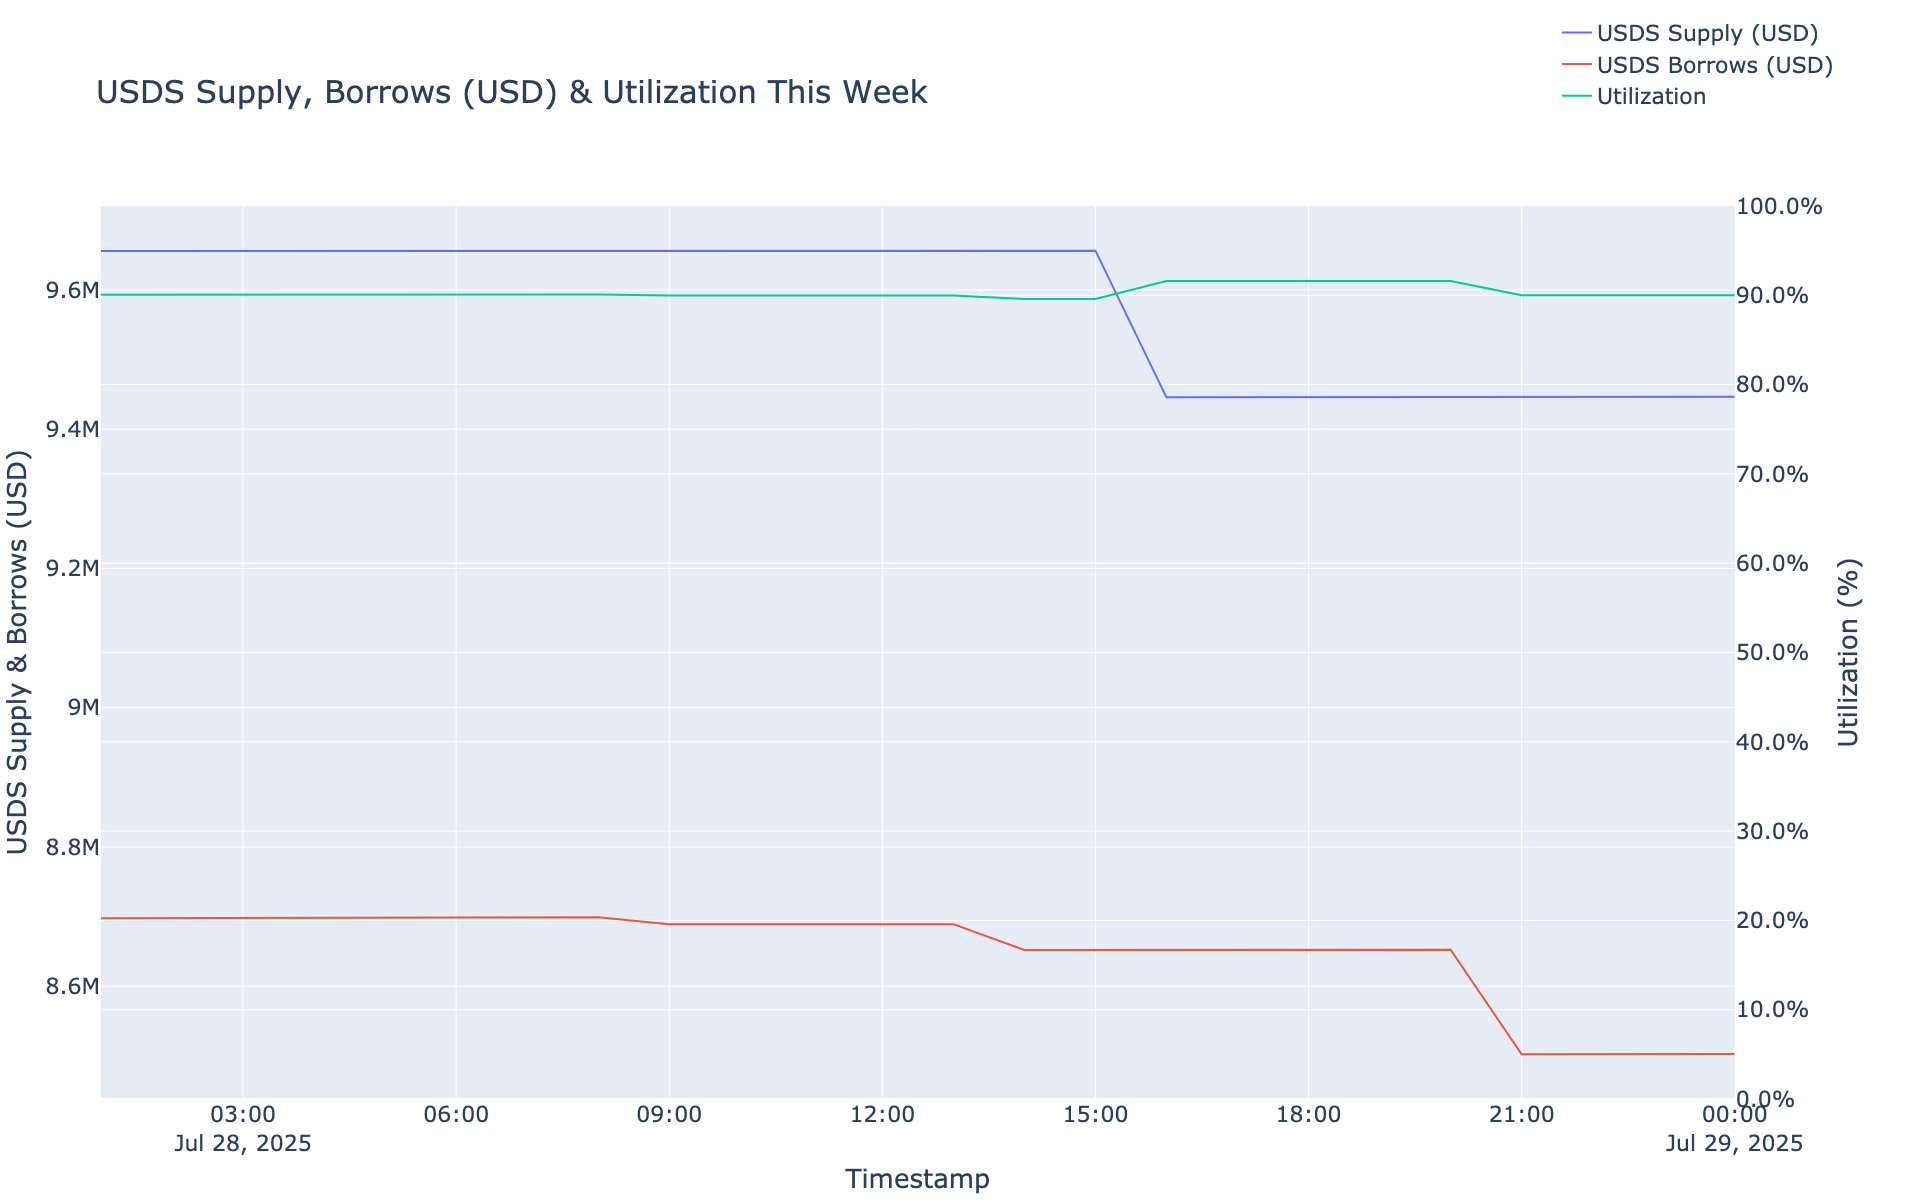
USDS Borrows increased 16.50%, from $9.26M to $10.79M.
-
USDS Supply increased 4.81%, from $12.97M to $13.59M.
-
USDS utilization increased 11.16%, from 71.45% to 79.42%.
-
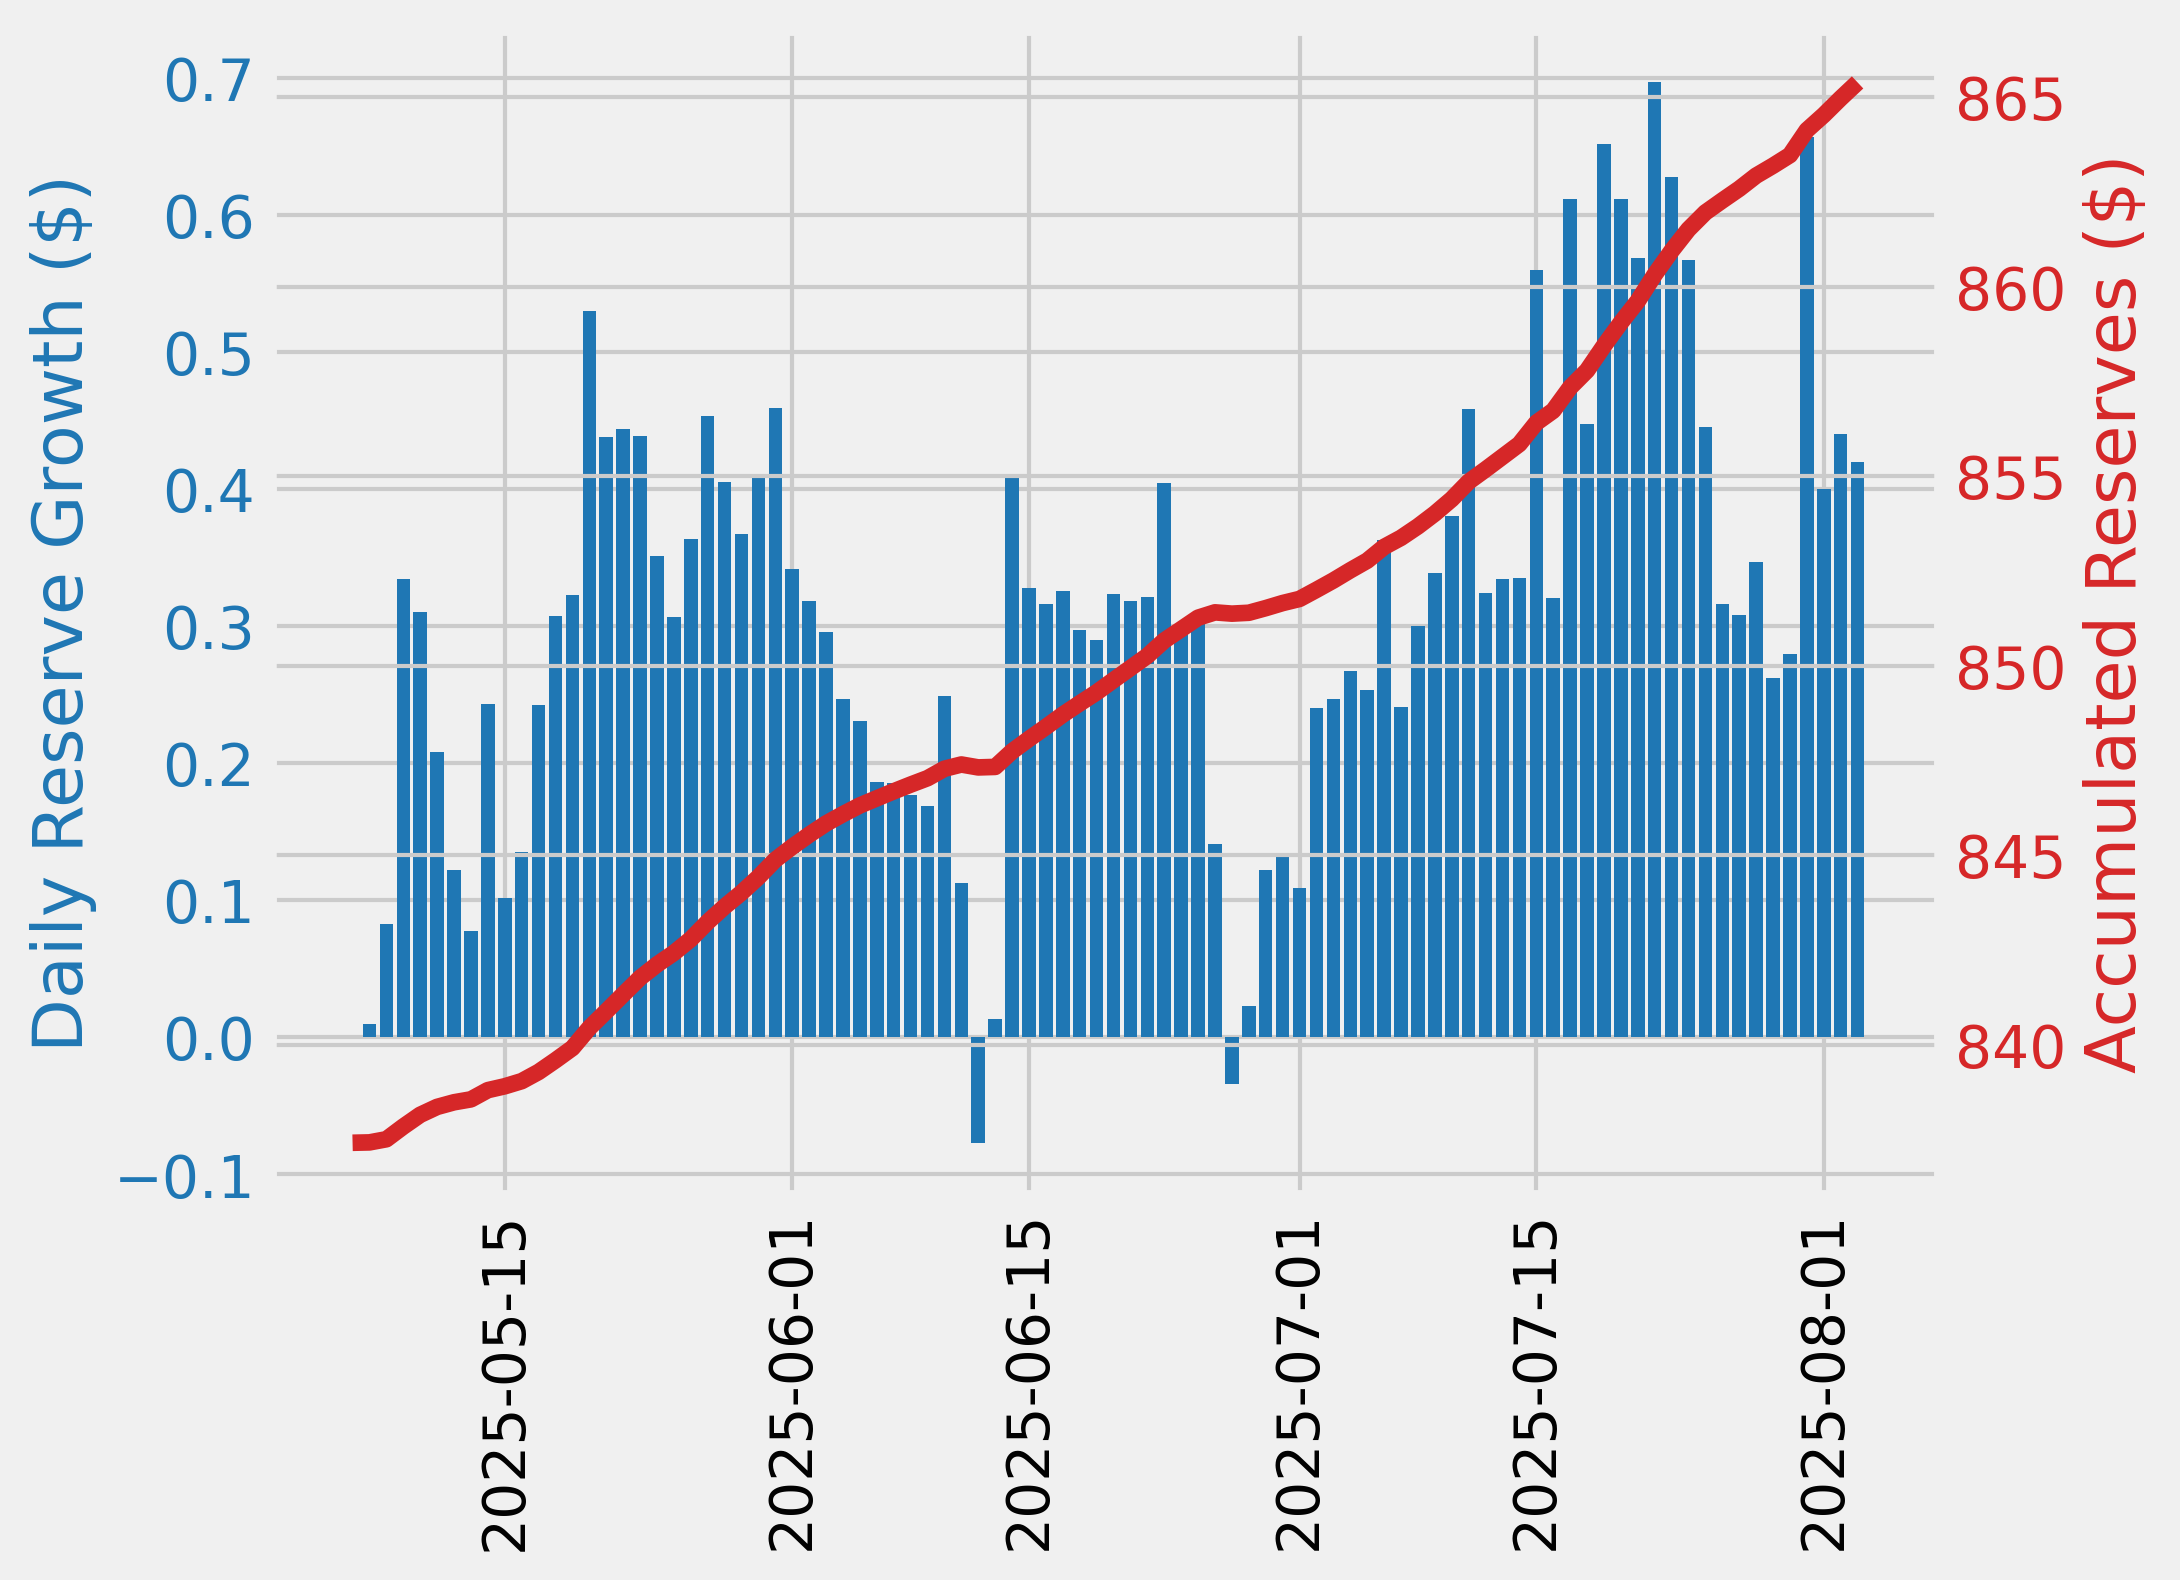
The minimum USDS reserve growth was -12.76%, and the maximum was 2.64%. The average USDS reserve growth was -2.49%.
-
The comet accumulated $-190.16 USDS reserves while distributing 8.66K COMP rewards for a weekly Net Protocol Profit of -8.85K.
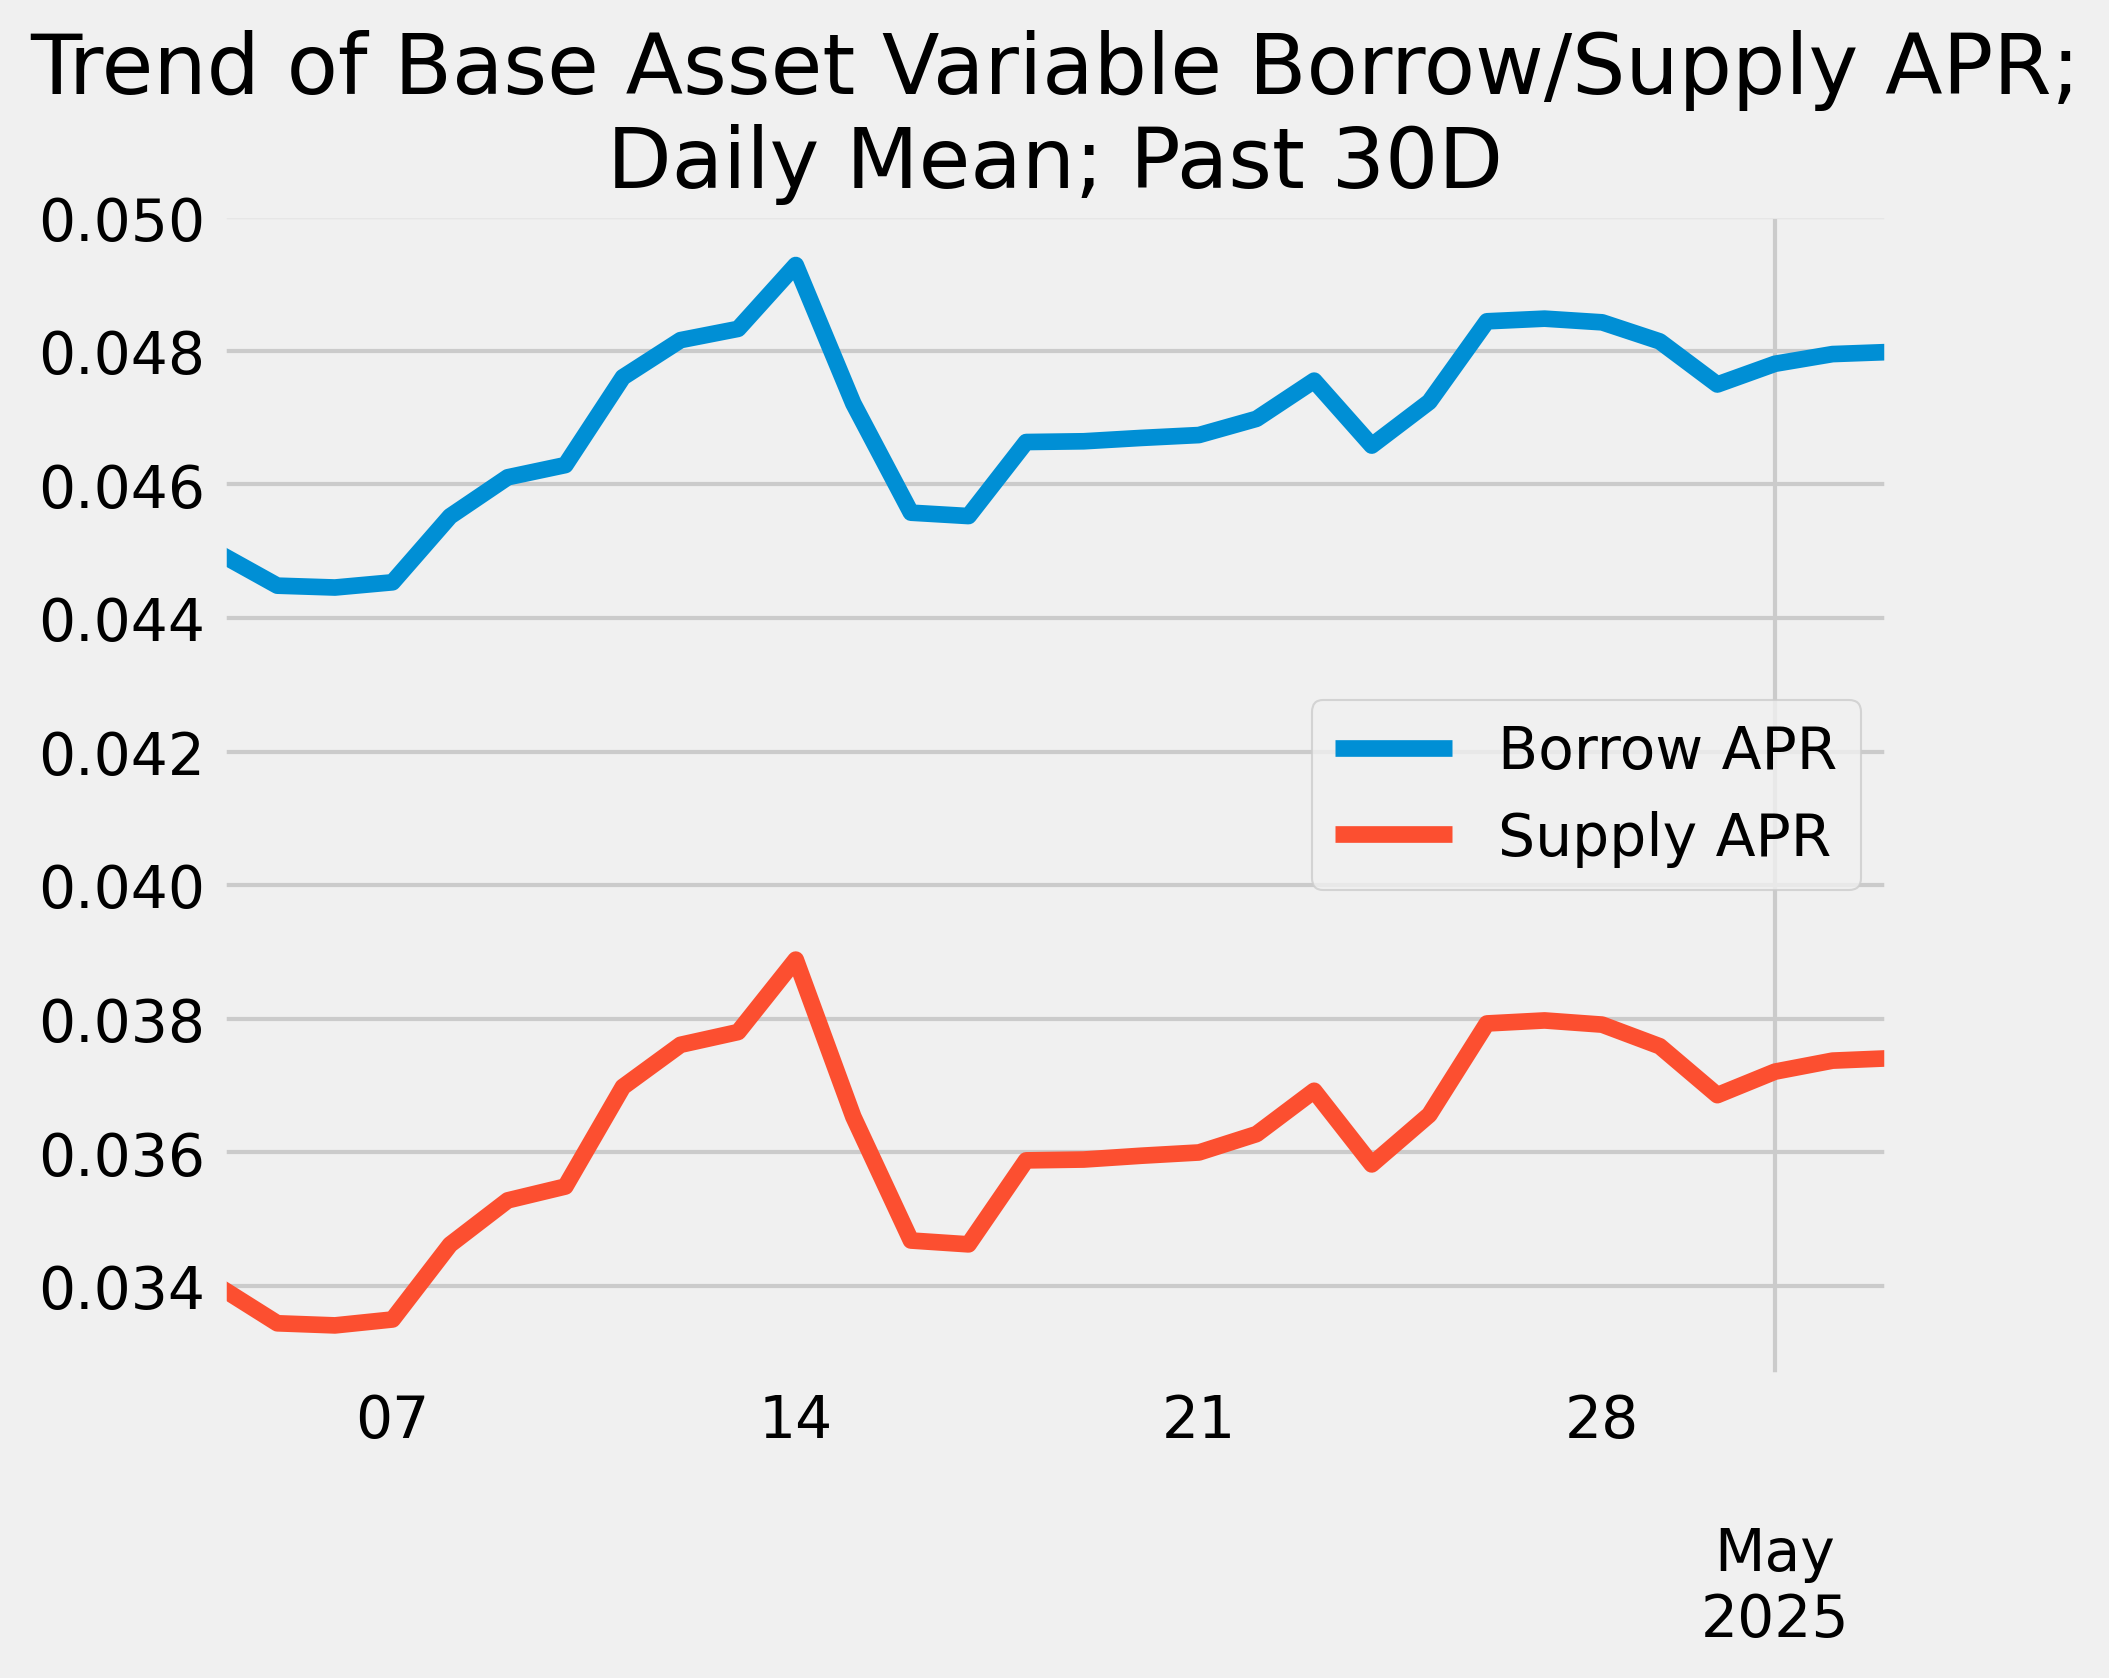
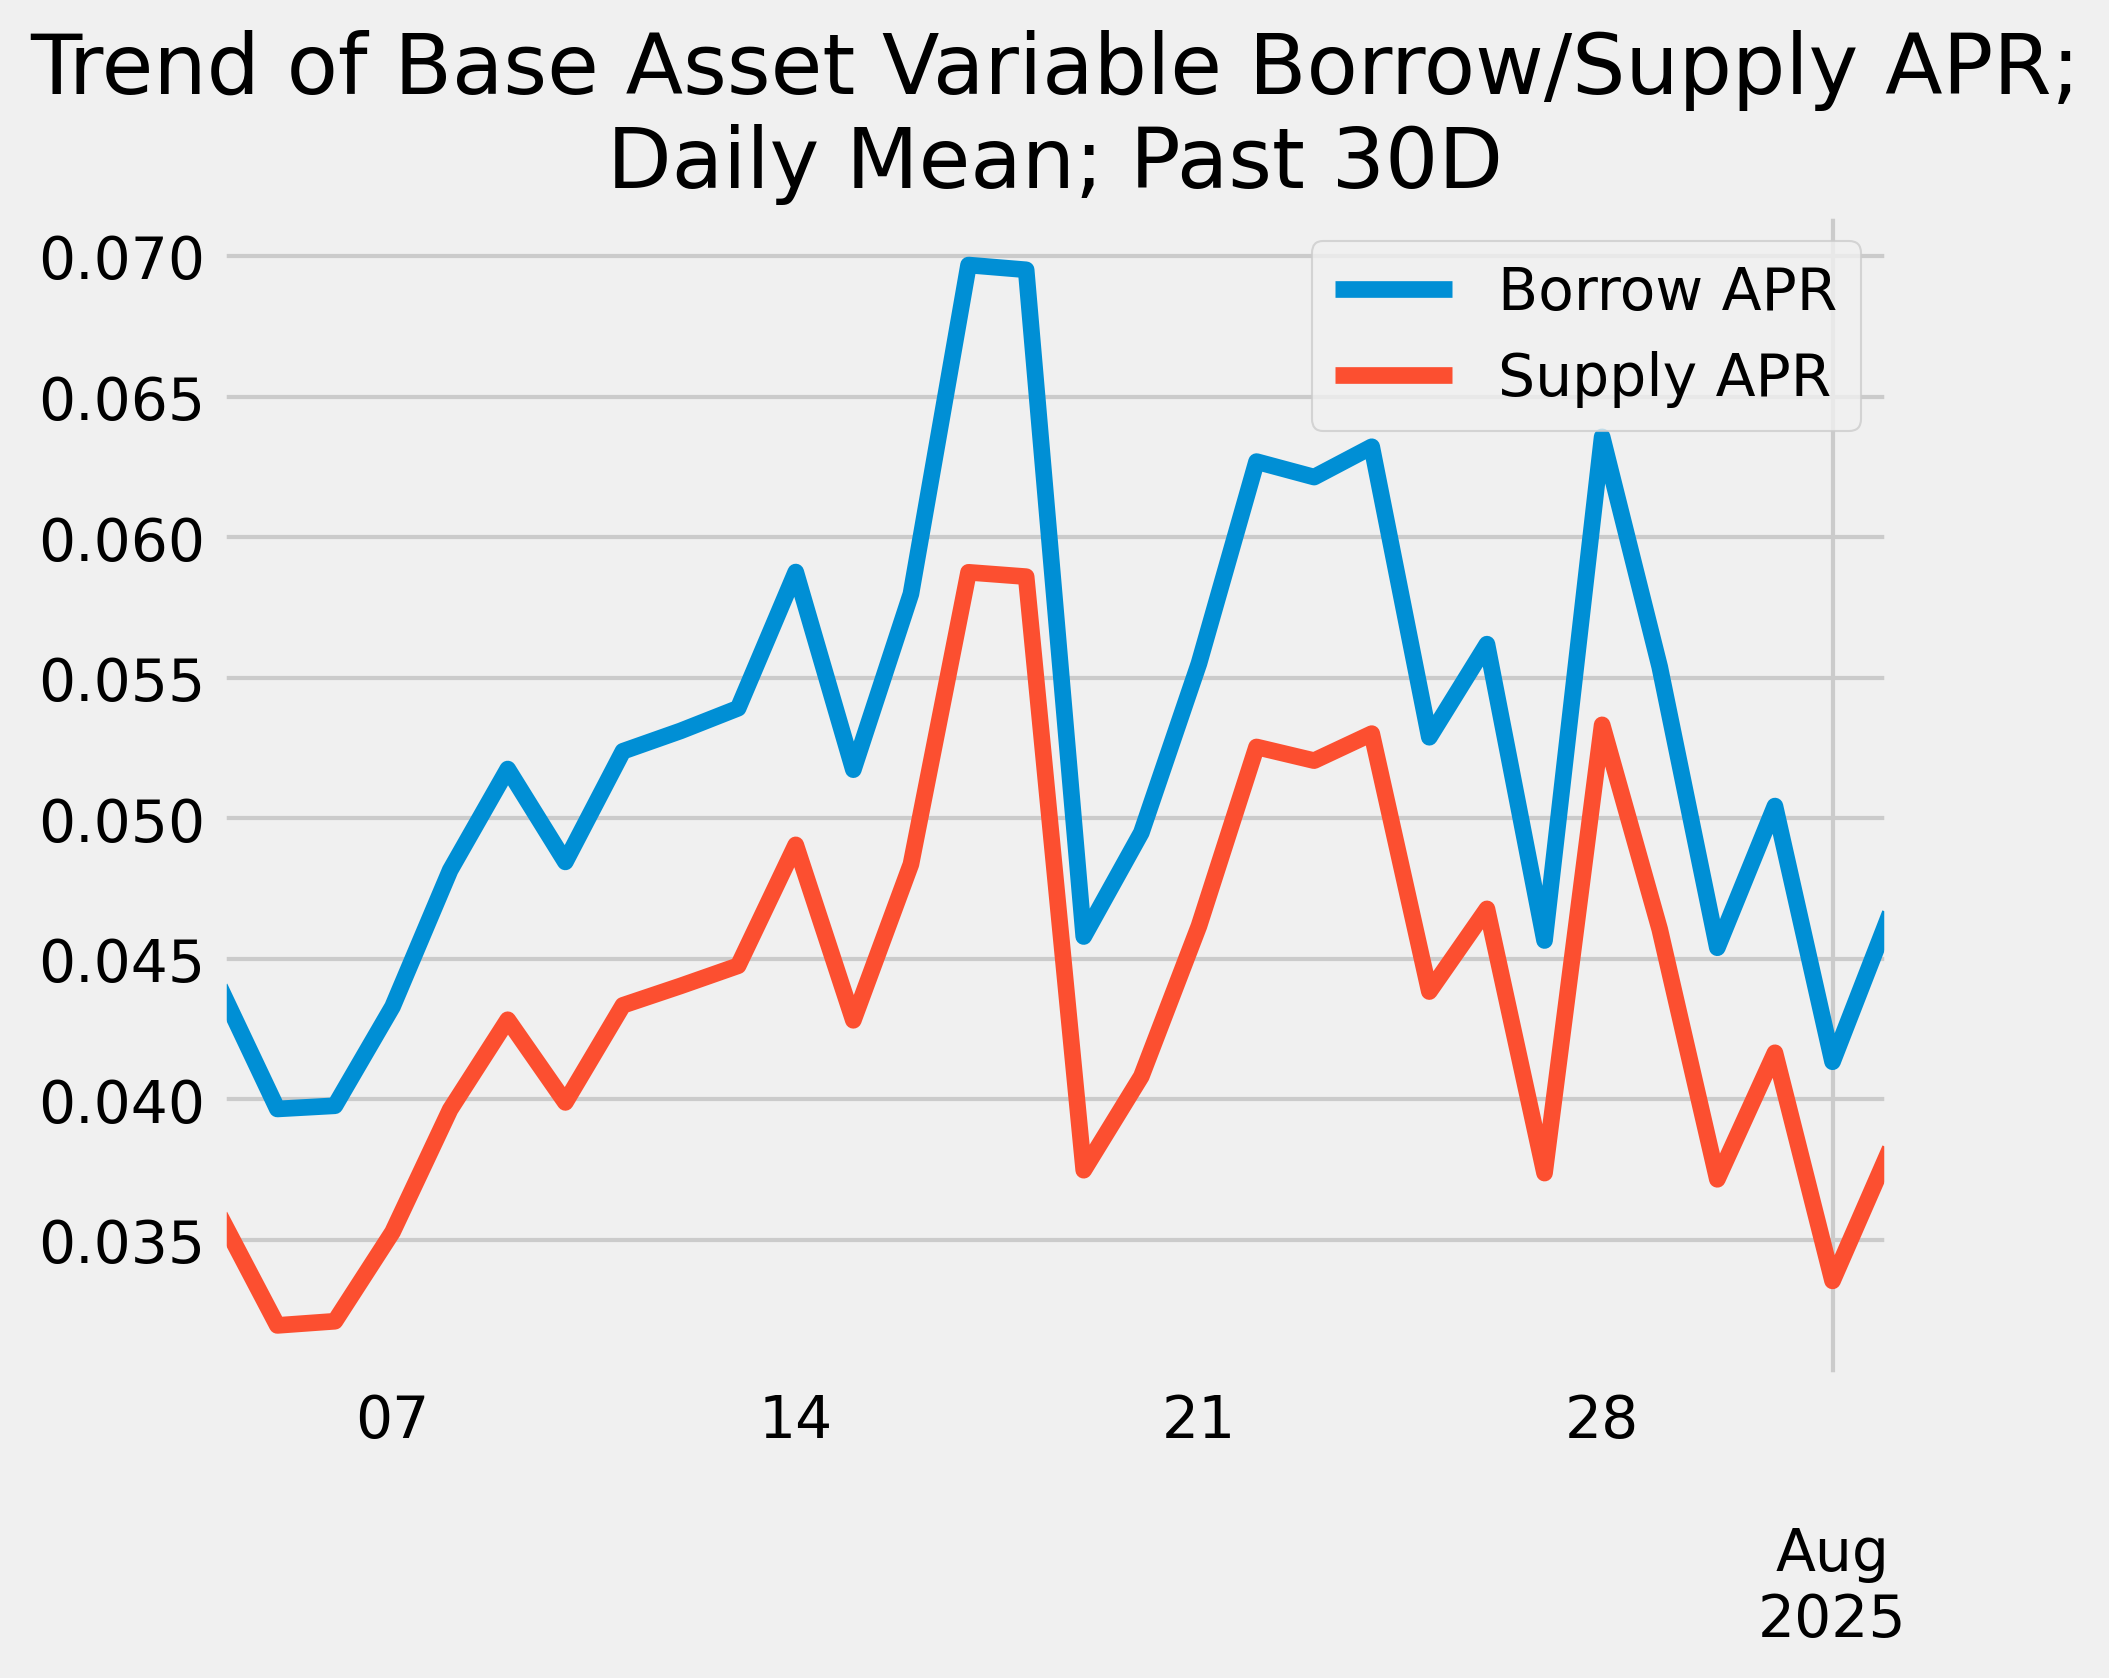
Base Asset APR Trend

Reserve Analysis

COMP Rewards Analysis
| Chain | CometRewards COMP token holdings | Daily aggregate COMP token reward distributions | Remaining days of rewards runway (not including existing claimable rewards) |
|---|---|---|---|
| ethereum | 0.00 | 358.00 | 0.00 |
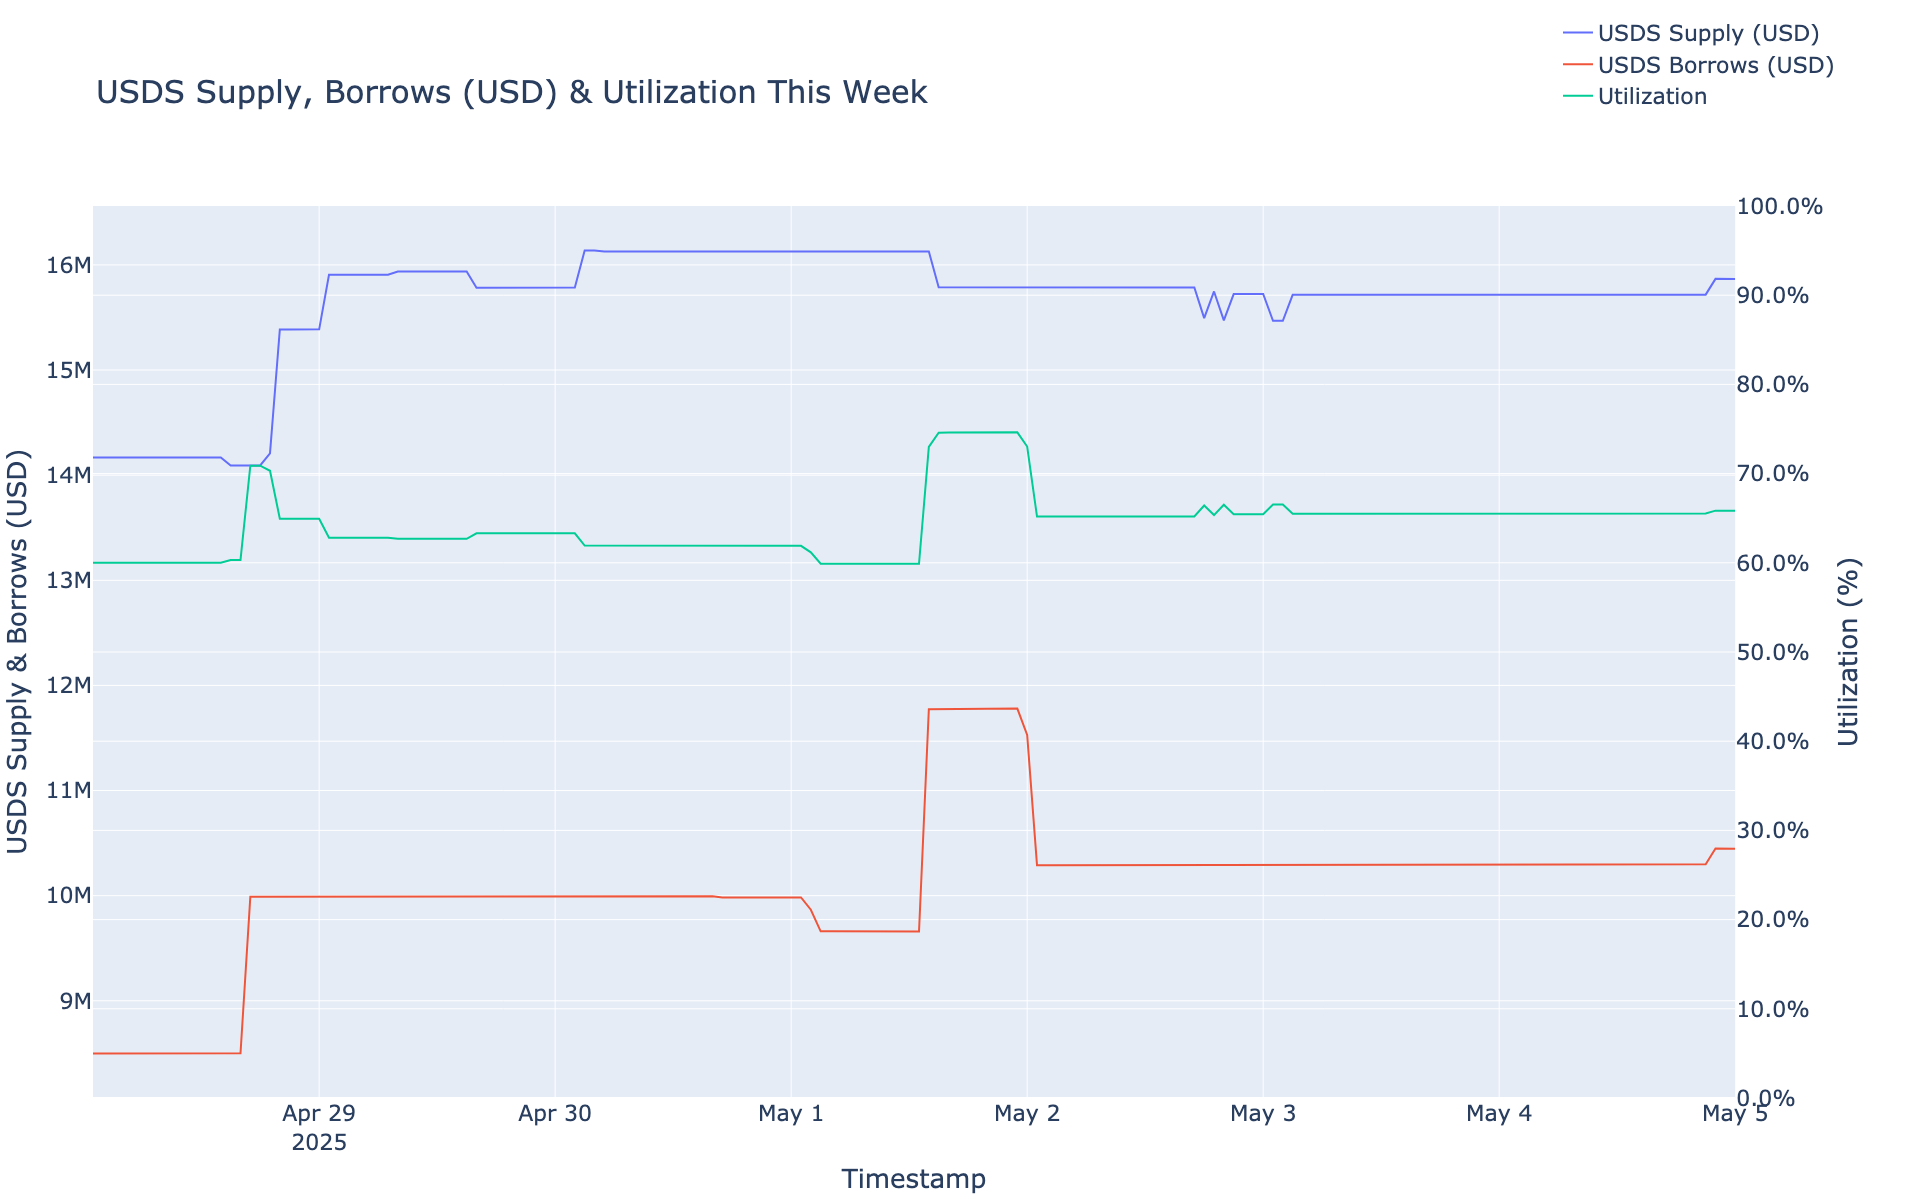
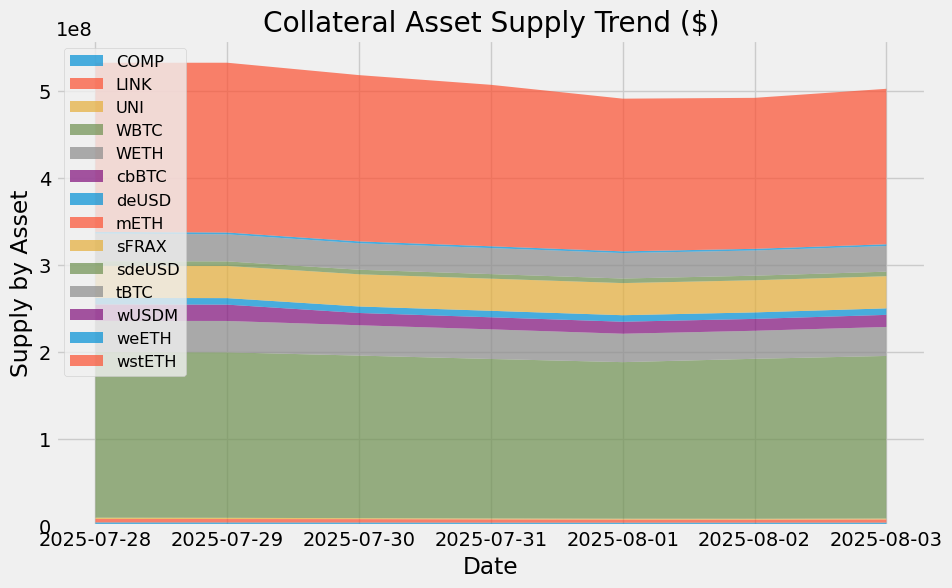
Collateral Asset Supply
This graph shows the trend of total supply of all collateral assets.

To see updated statistics, please see the live version of this graph here.
Base Asset Borrows
This graph shows the trend of total borrows of the base asset.

To see updated statistics, please see the live version of this graph here.
Utilization
This graph shows the utilization (borrow / supply) of the base asset over the past week.

Supply Cap Usage
This graph shows the supply cap usage (supply / supply cap) of all collateral assets over the past week.

ethereum USDT Comet
Simple Summary
-
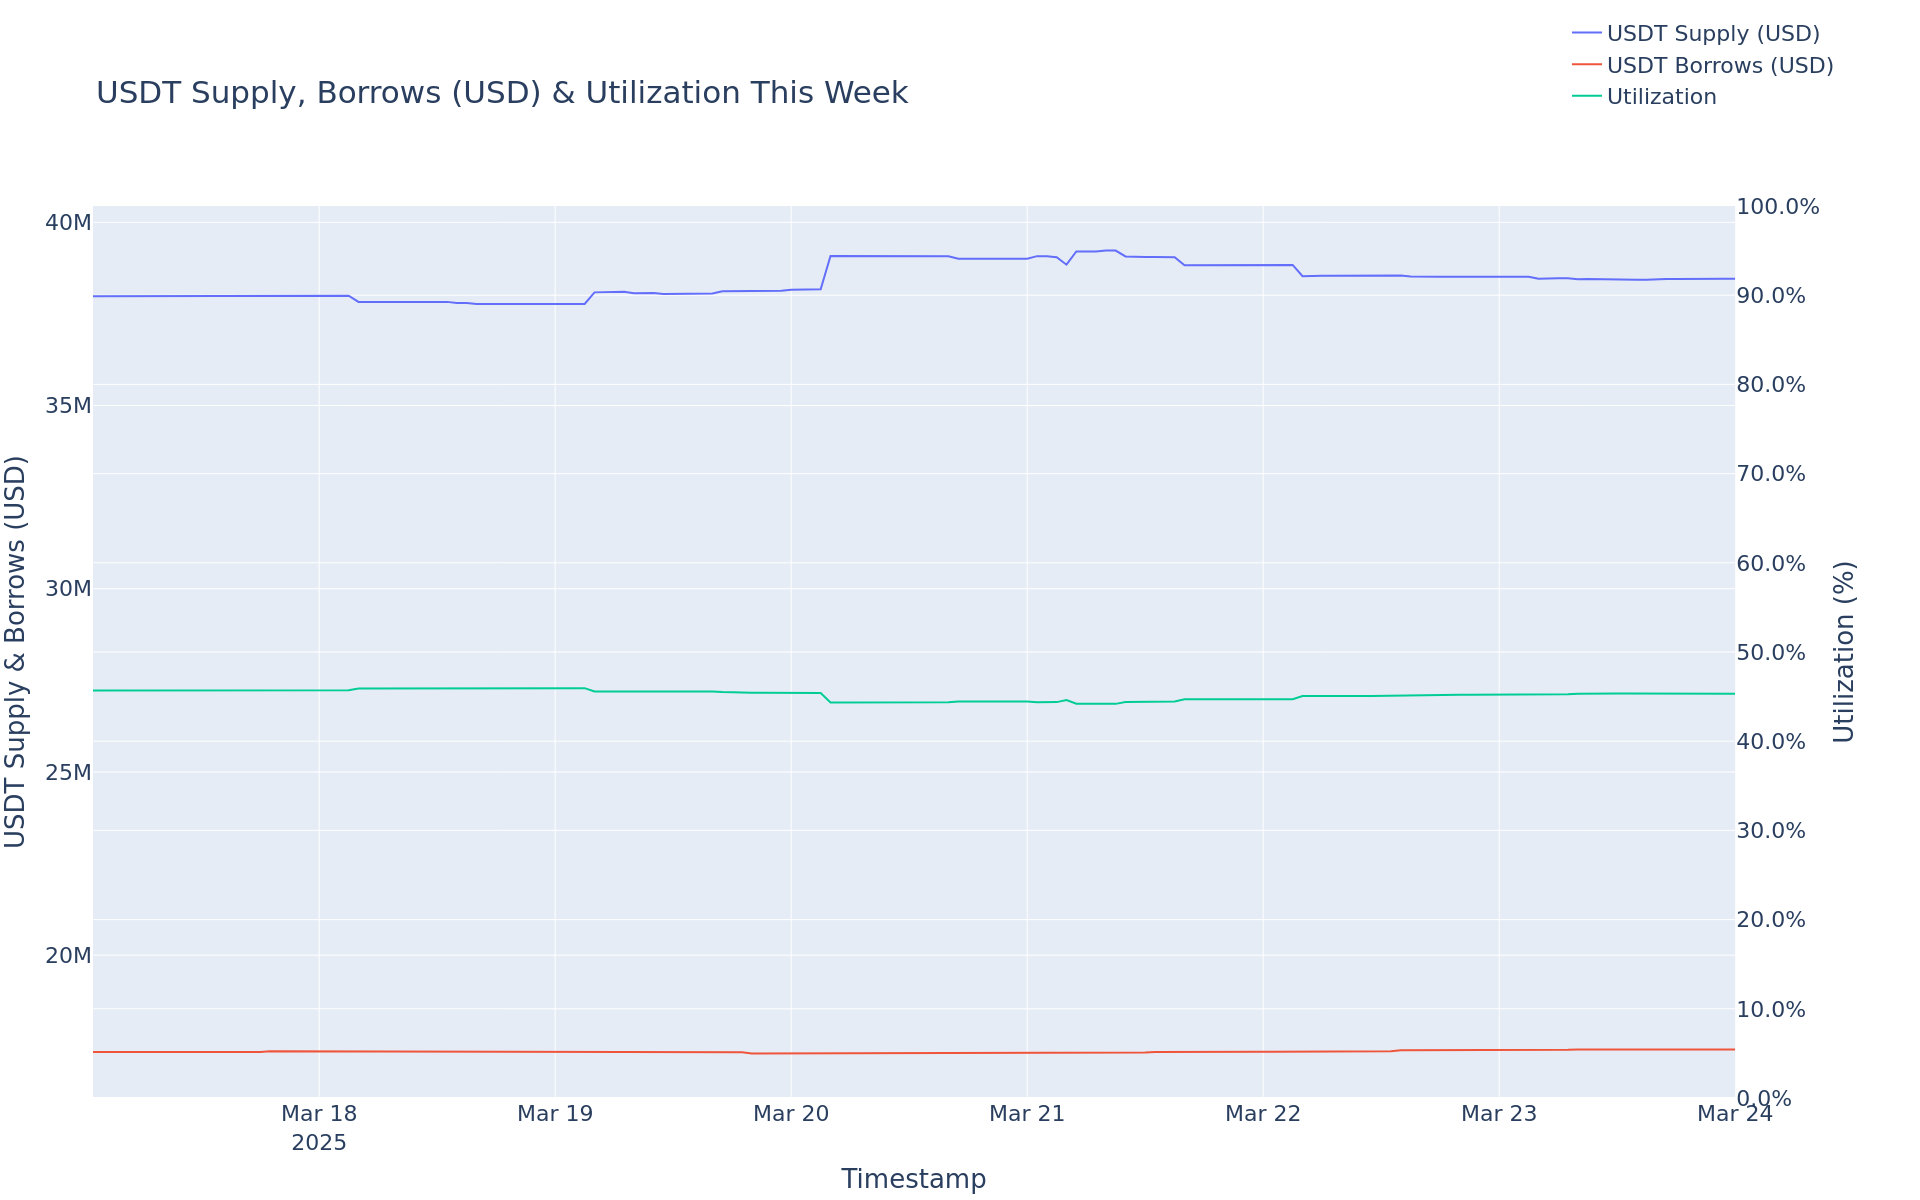
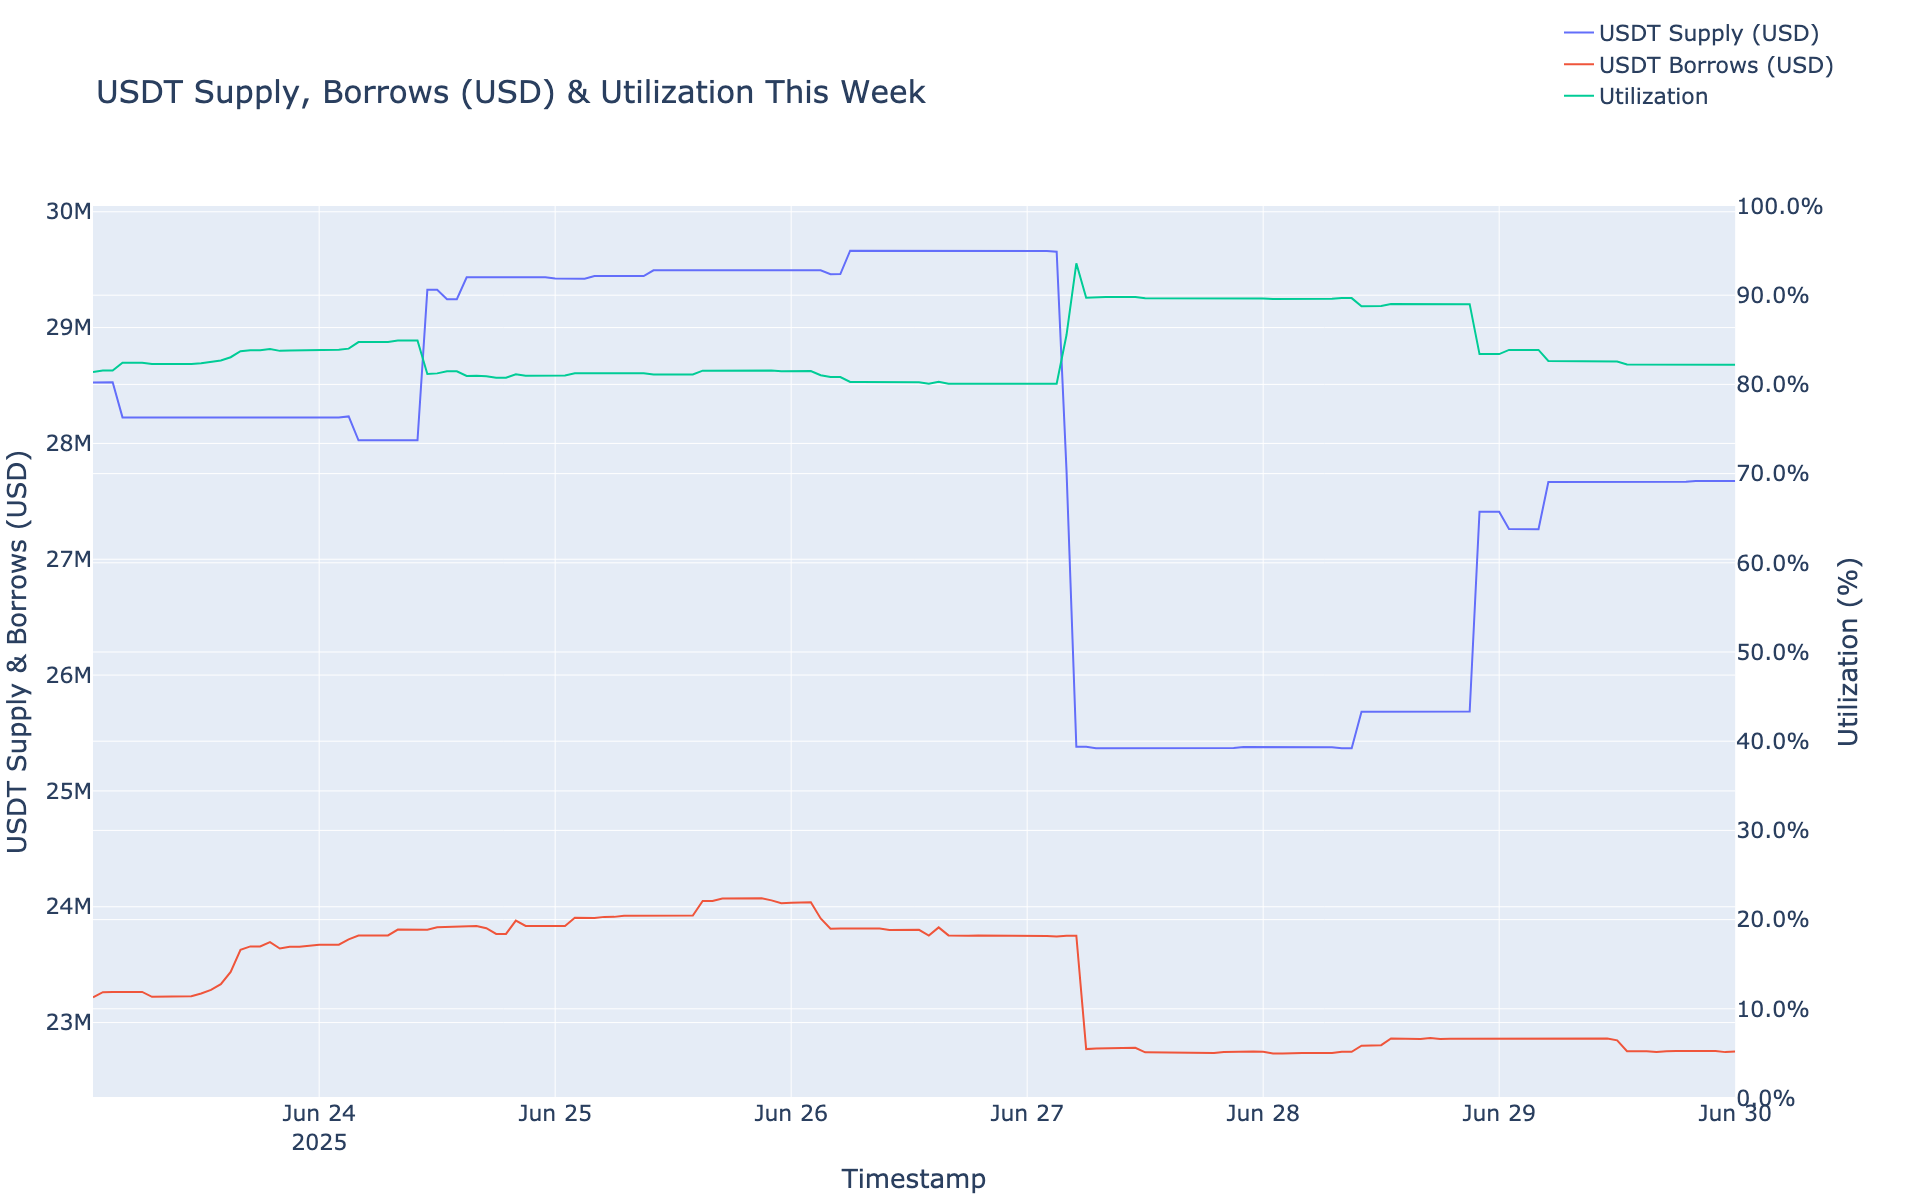
USDT Borrows decreased 10.00%, from $126.94M to $114.24M.
-
USDT Supply increased 7.69%, from $173.42M to $186.75M.
-
USDT utilization decreased 16.43%, from 73.20% to 61.18%.
-
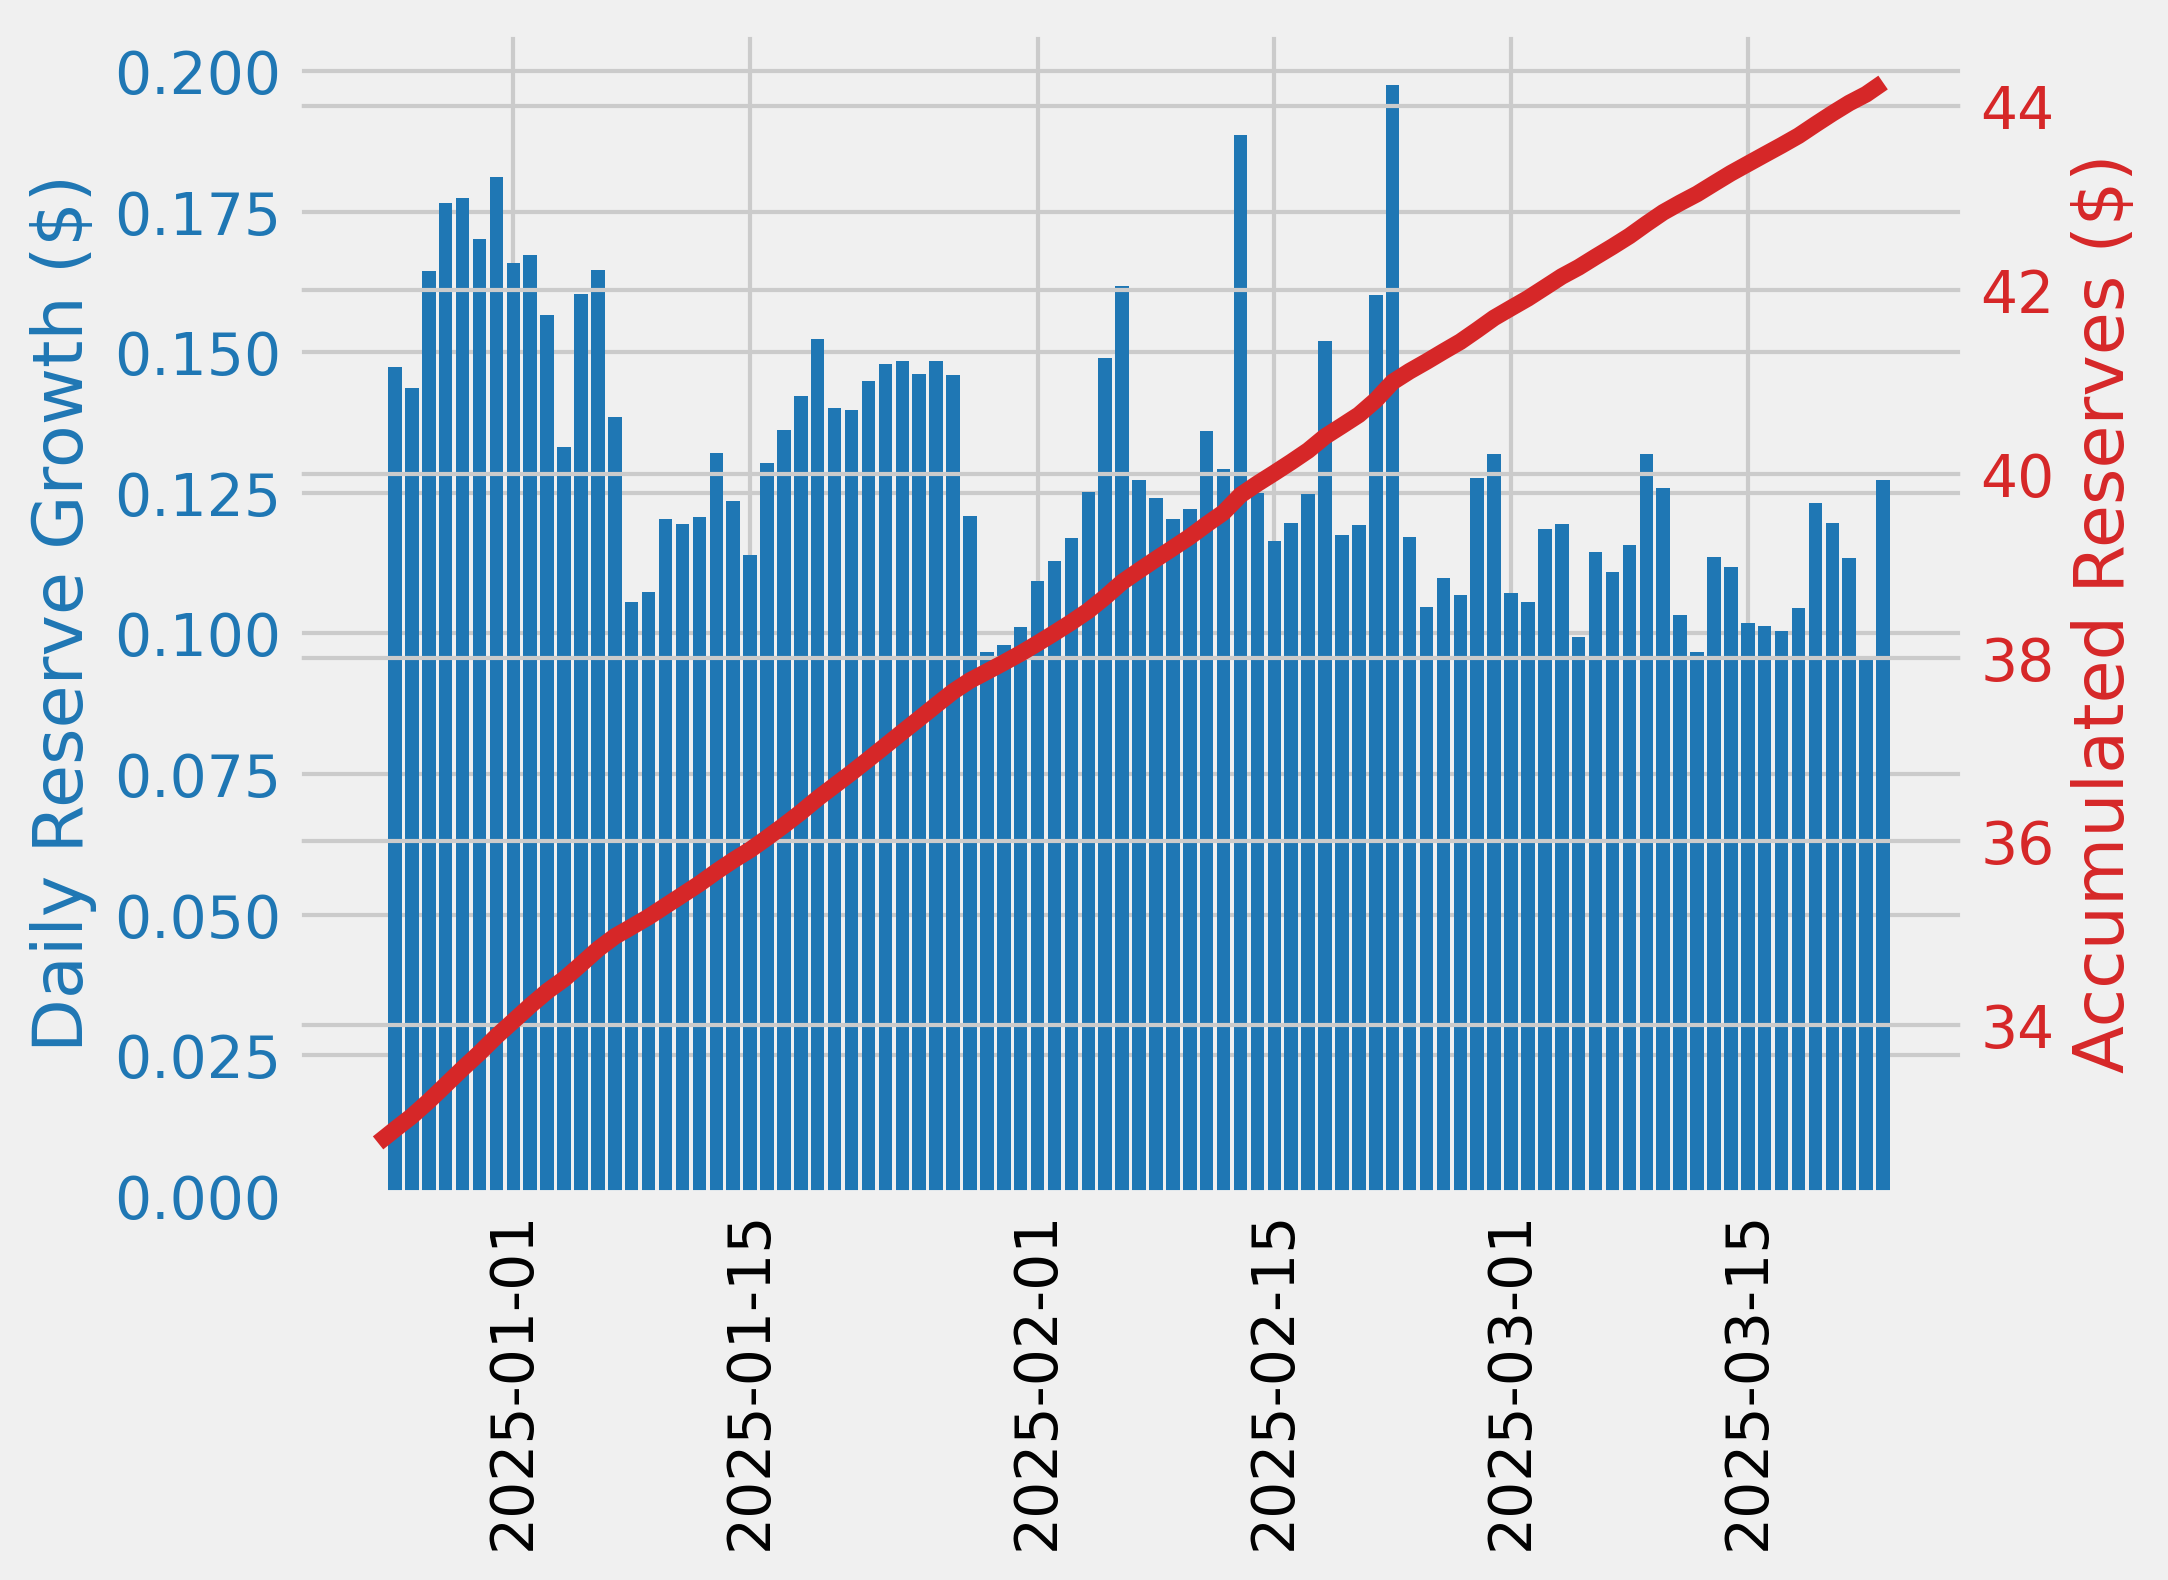
The minimum USDT reserve growth was -19.07%, and the maximum was -4.43%. The average USDT reserve growth was -16.23%.
-
The comet accumulated $-16.80K USDT reserves while distributing 34.64K COMP rewards for a weekly Net Protocol Profit of -51.45K.
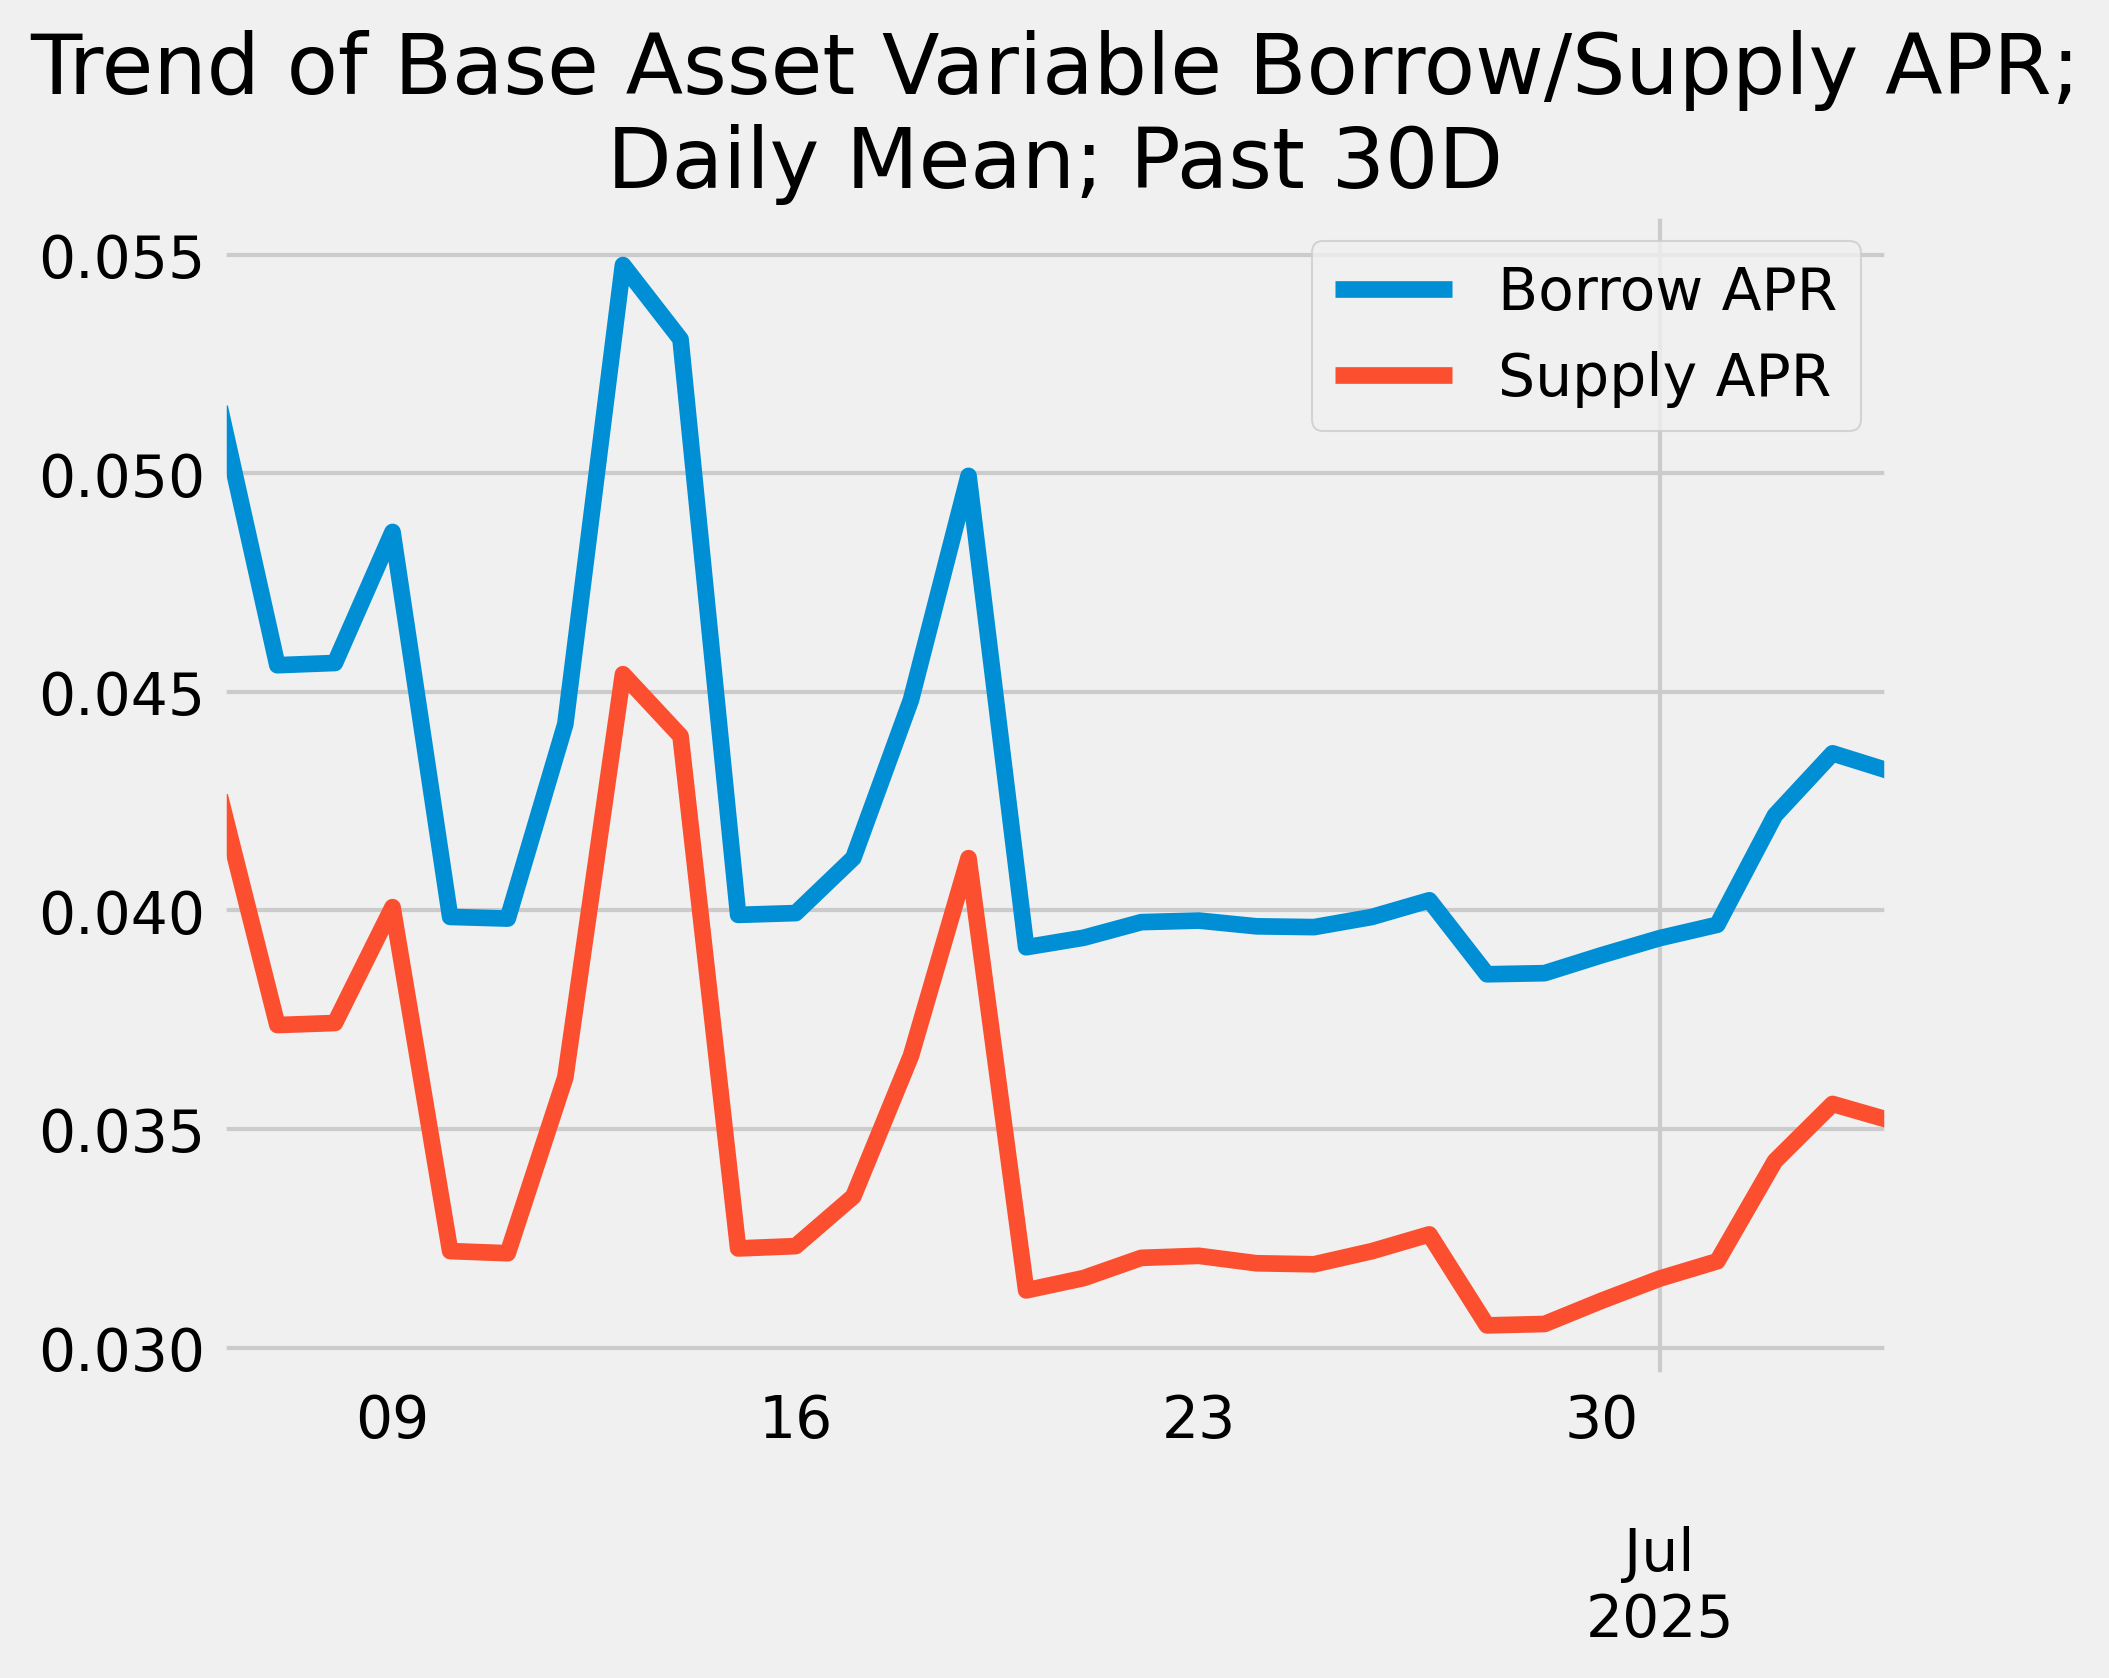
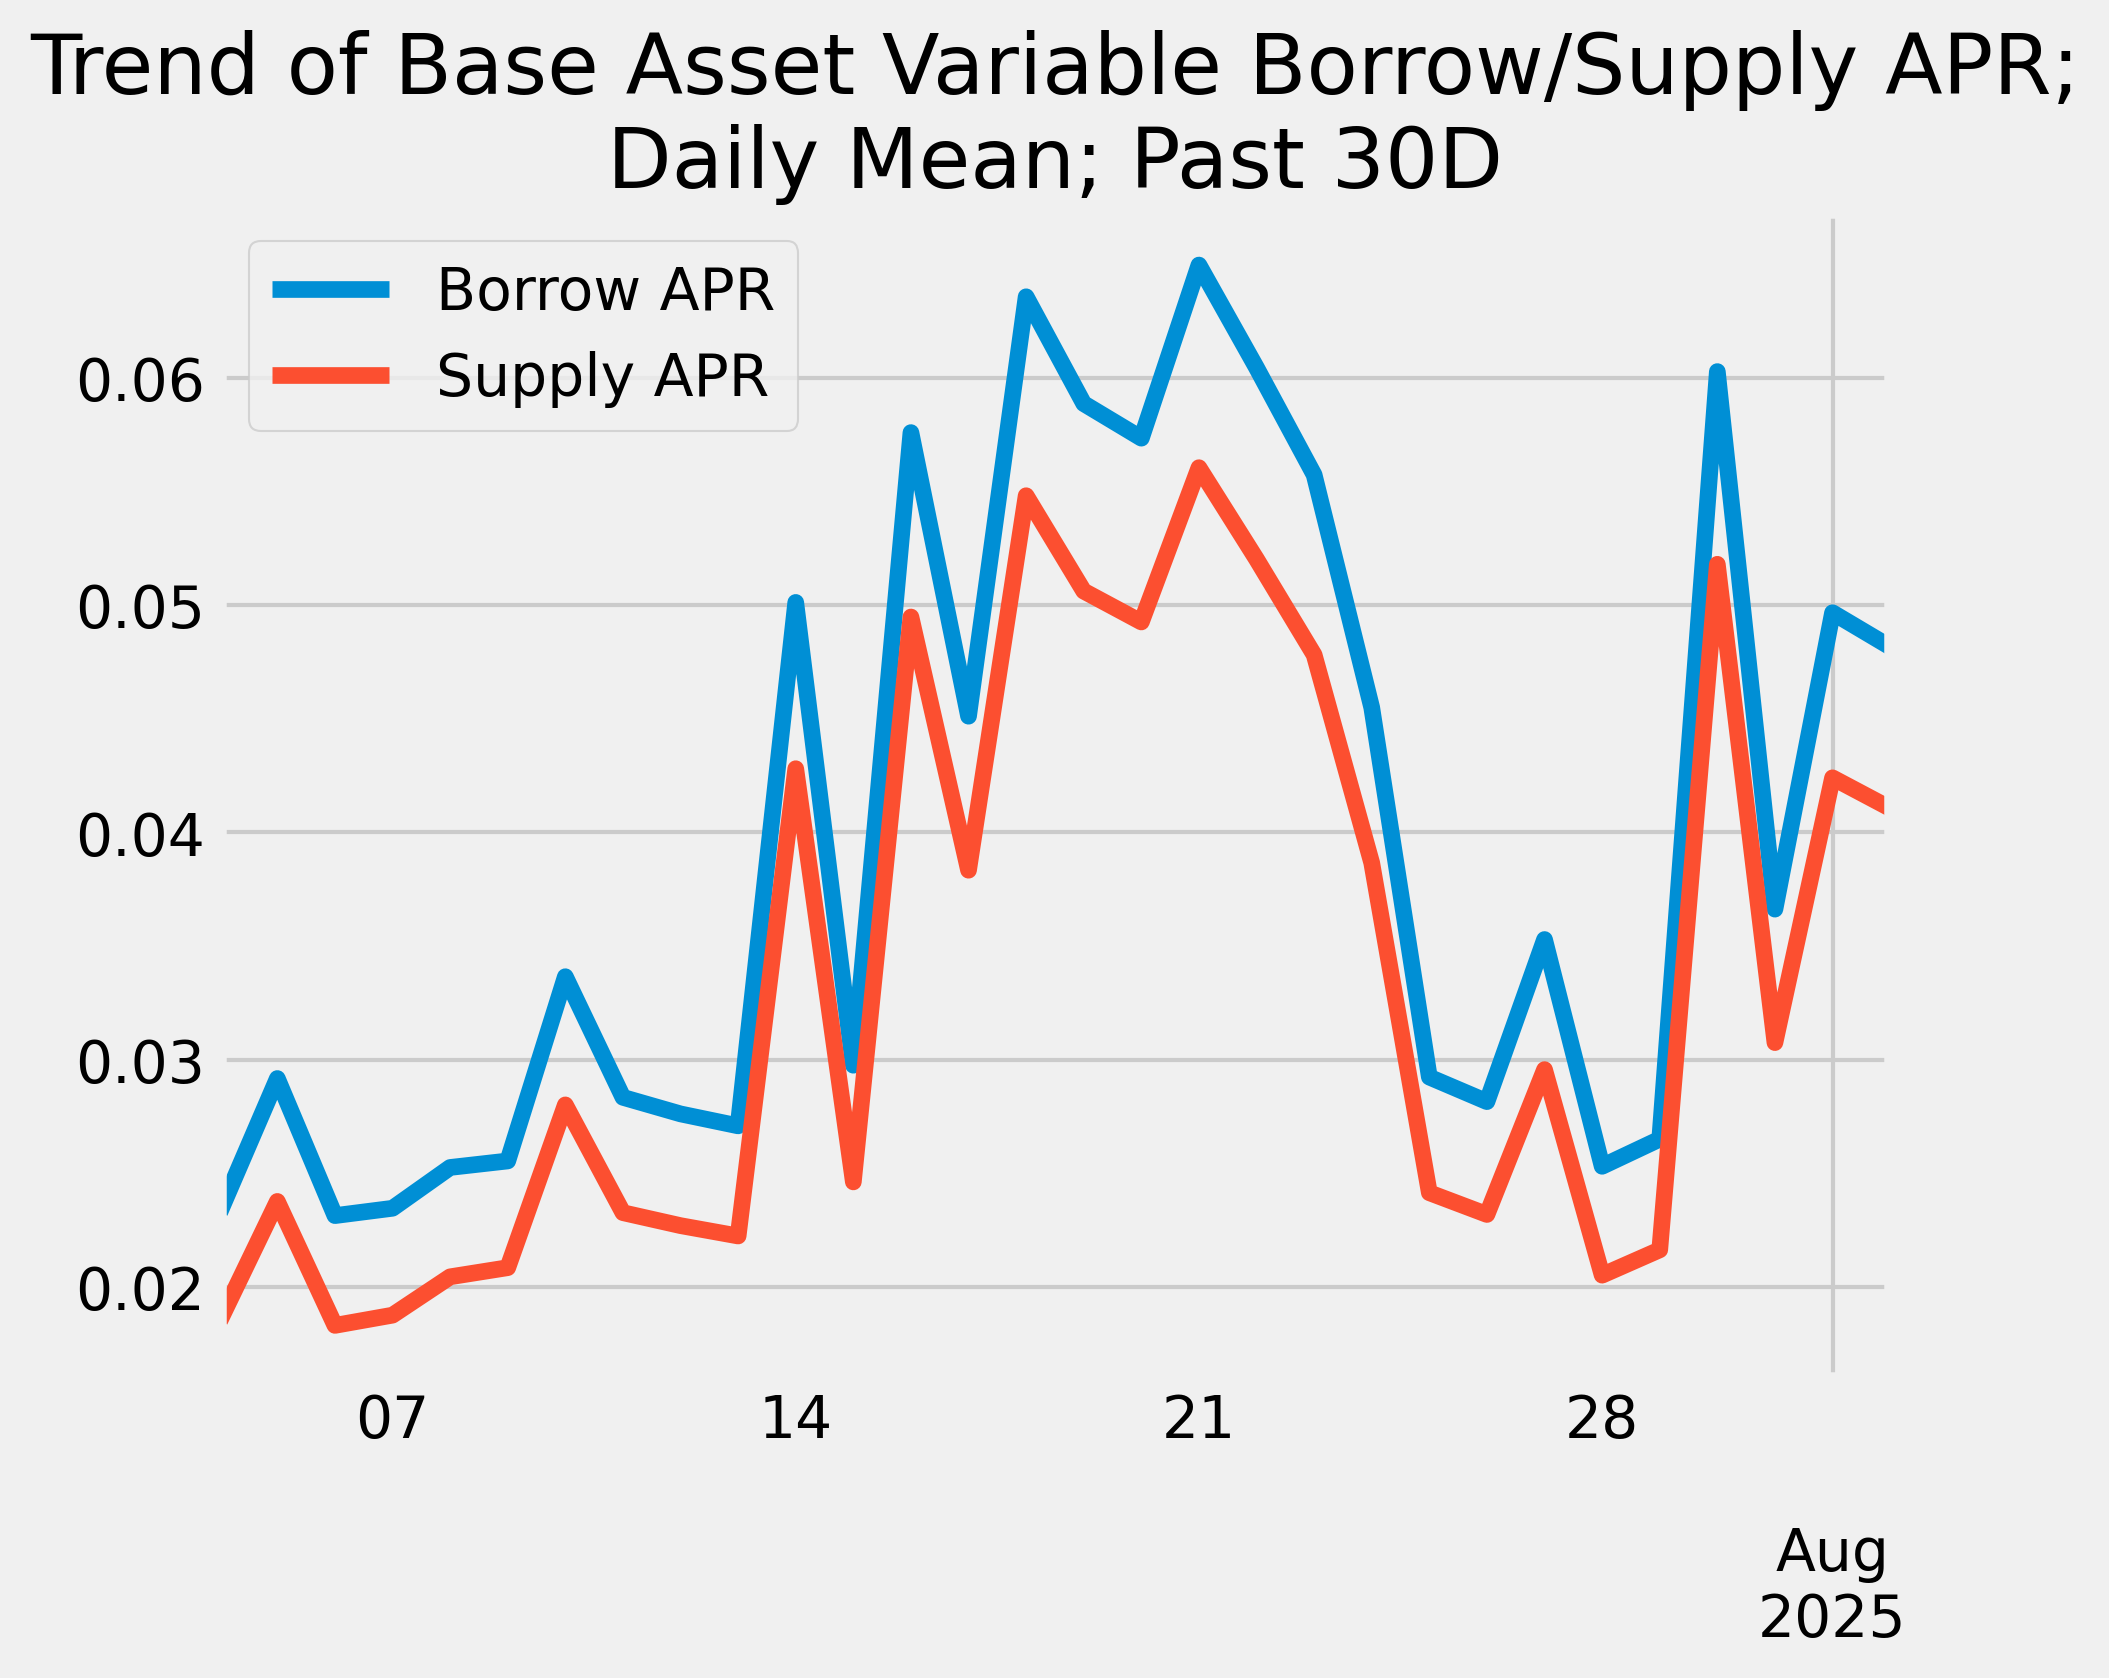
Base Asset APR Trend

Reserve Analysis

COMP Rewards Analysis
| Chain | CometRewards COMP token holdings | Daily aggregate COMP token reward distributions | Remaining days of rewards runway (not including existing claimable rewards) |
|---|---|---|---|
| ethereum | 0.00 | 358.00 | 0.00 |
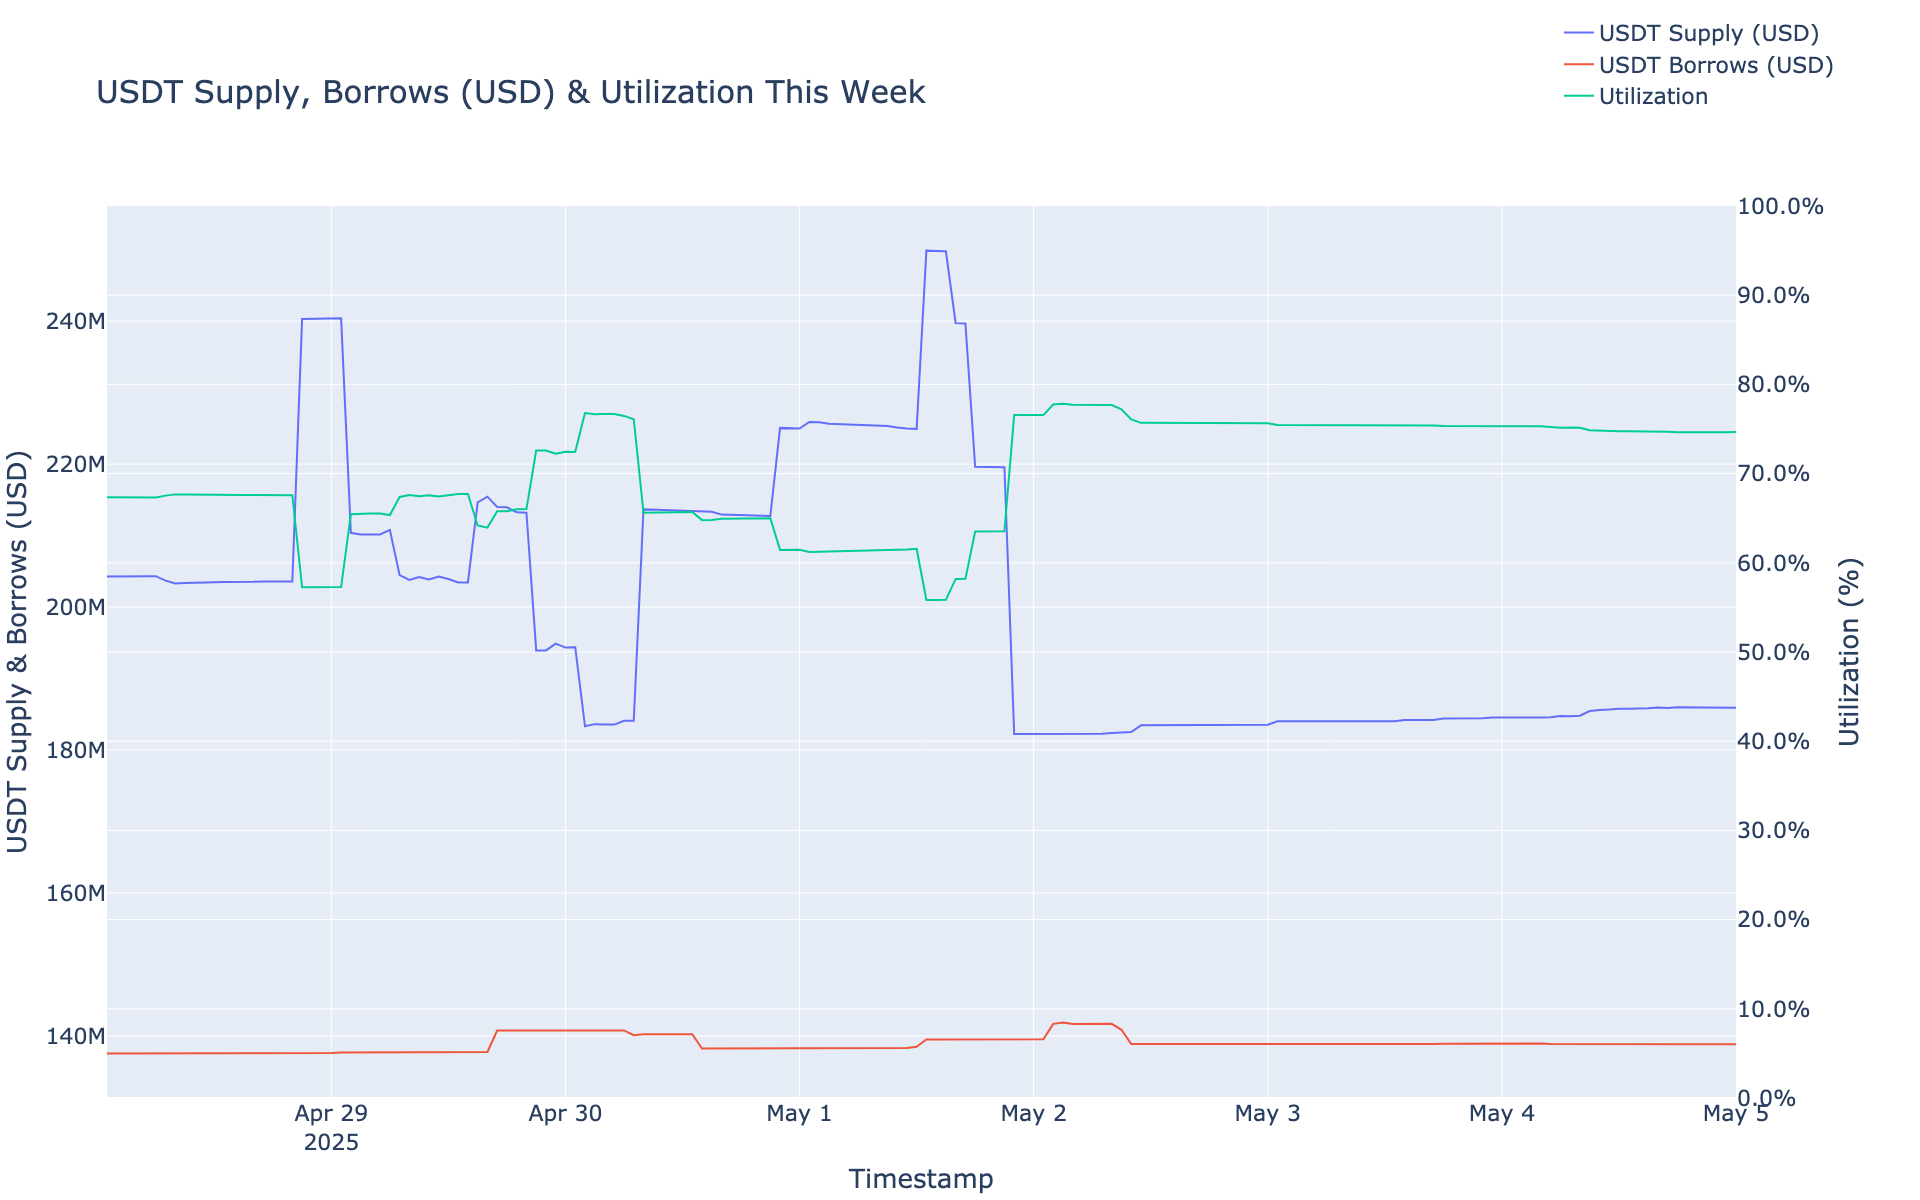
Collateral Asset Supply
This graph shows the trend of total supply of all collateral assets.

To see updated statistics, please see the live version of this graph here.
Base Asset Borrows
This graph shows the trend of total borrows of the base asset.

To see updated statistics, please see the live version of this graph here.
Utilization
This graph shows the utilization (borrow / supply) of the base asset over the past week.

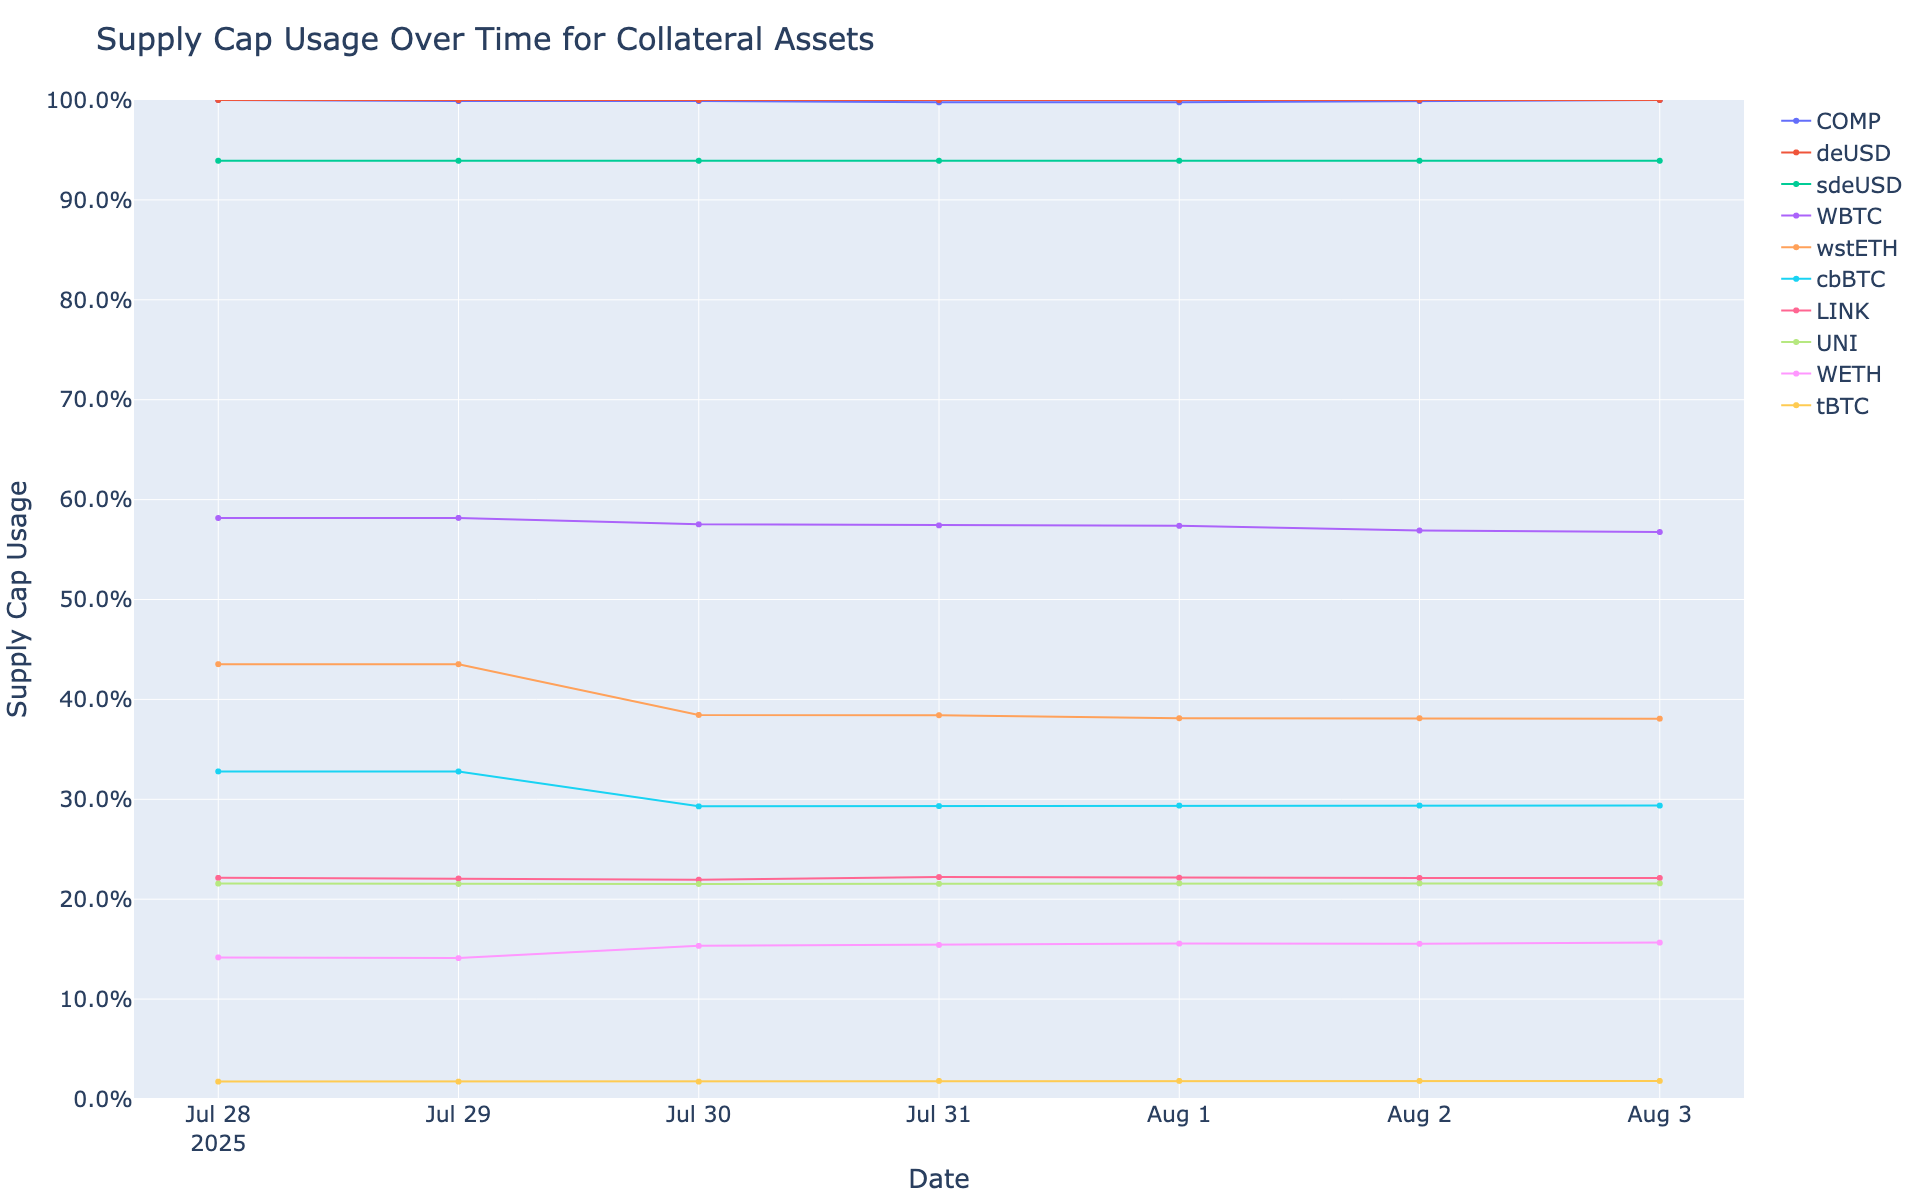
Supply Cap Usage
This graph shows the supply cap usage (supply / supply cap) of all collateral assets over the past week.

Arbitrum Ecosystem Update
arbitrum USDC.e Comet
Simple Summary
-
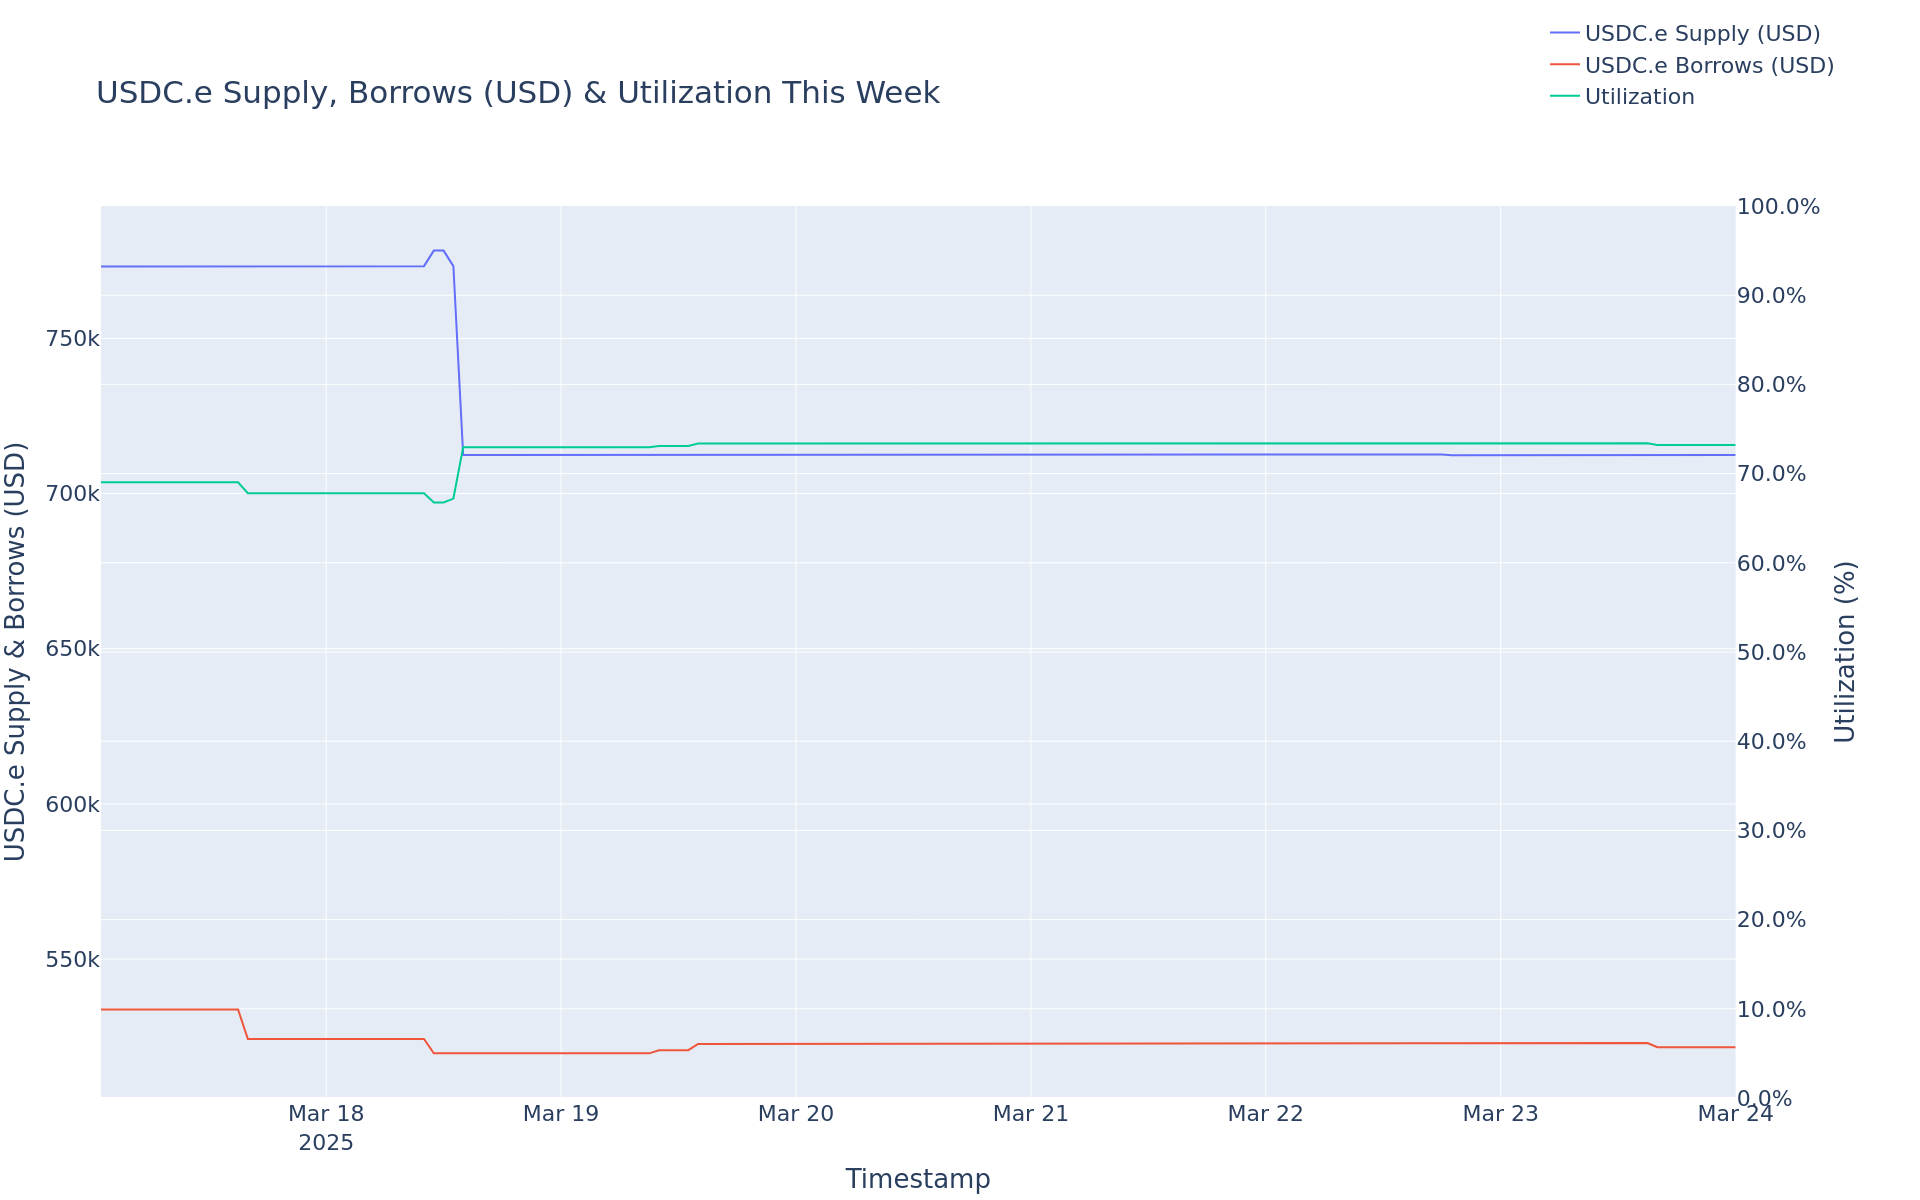
USDC.e Borrows decreased 9.37%, from $588.95K to $533.74K.
-
USDC.e Supply has not changed, remaining at $773.23K.
-
USDC.e utilization decreased 9.37%, from 76.17% to 69.03%.
-
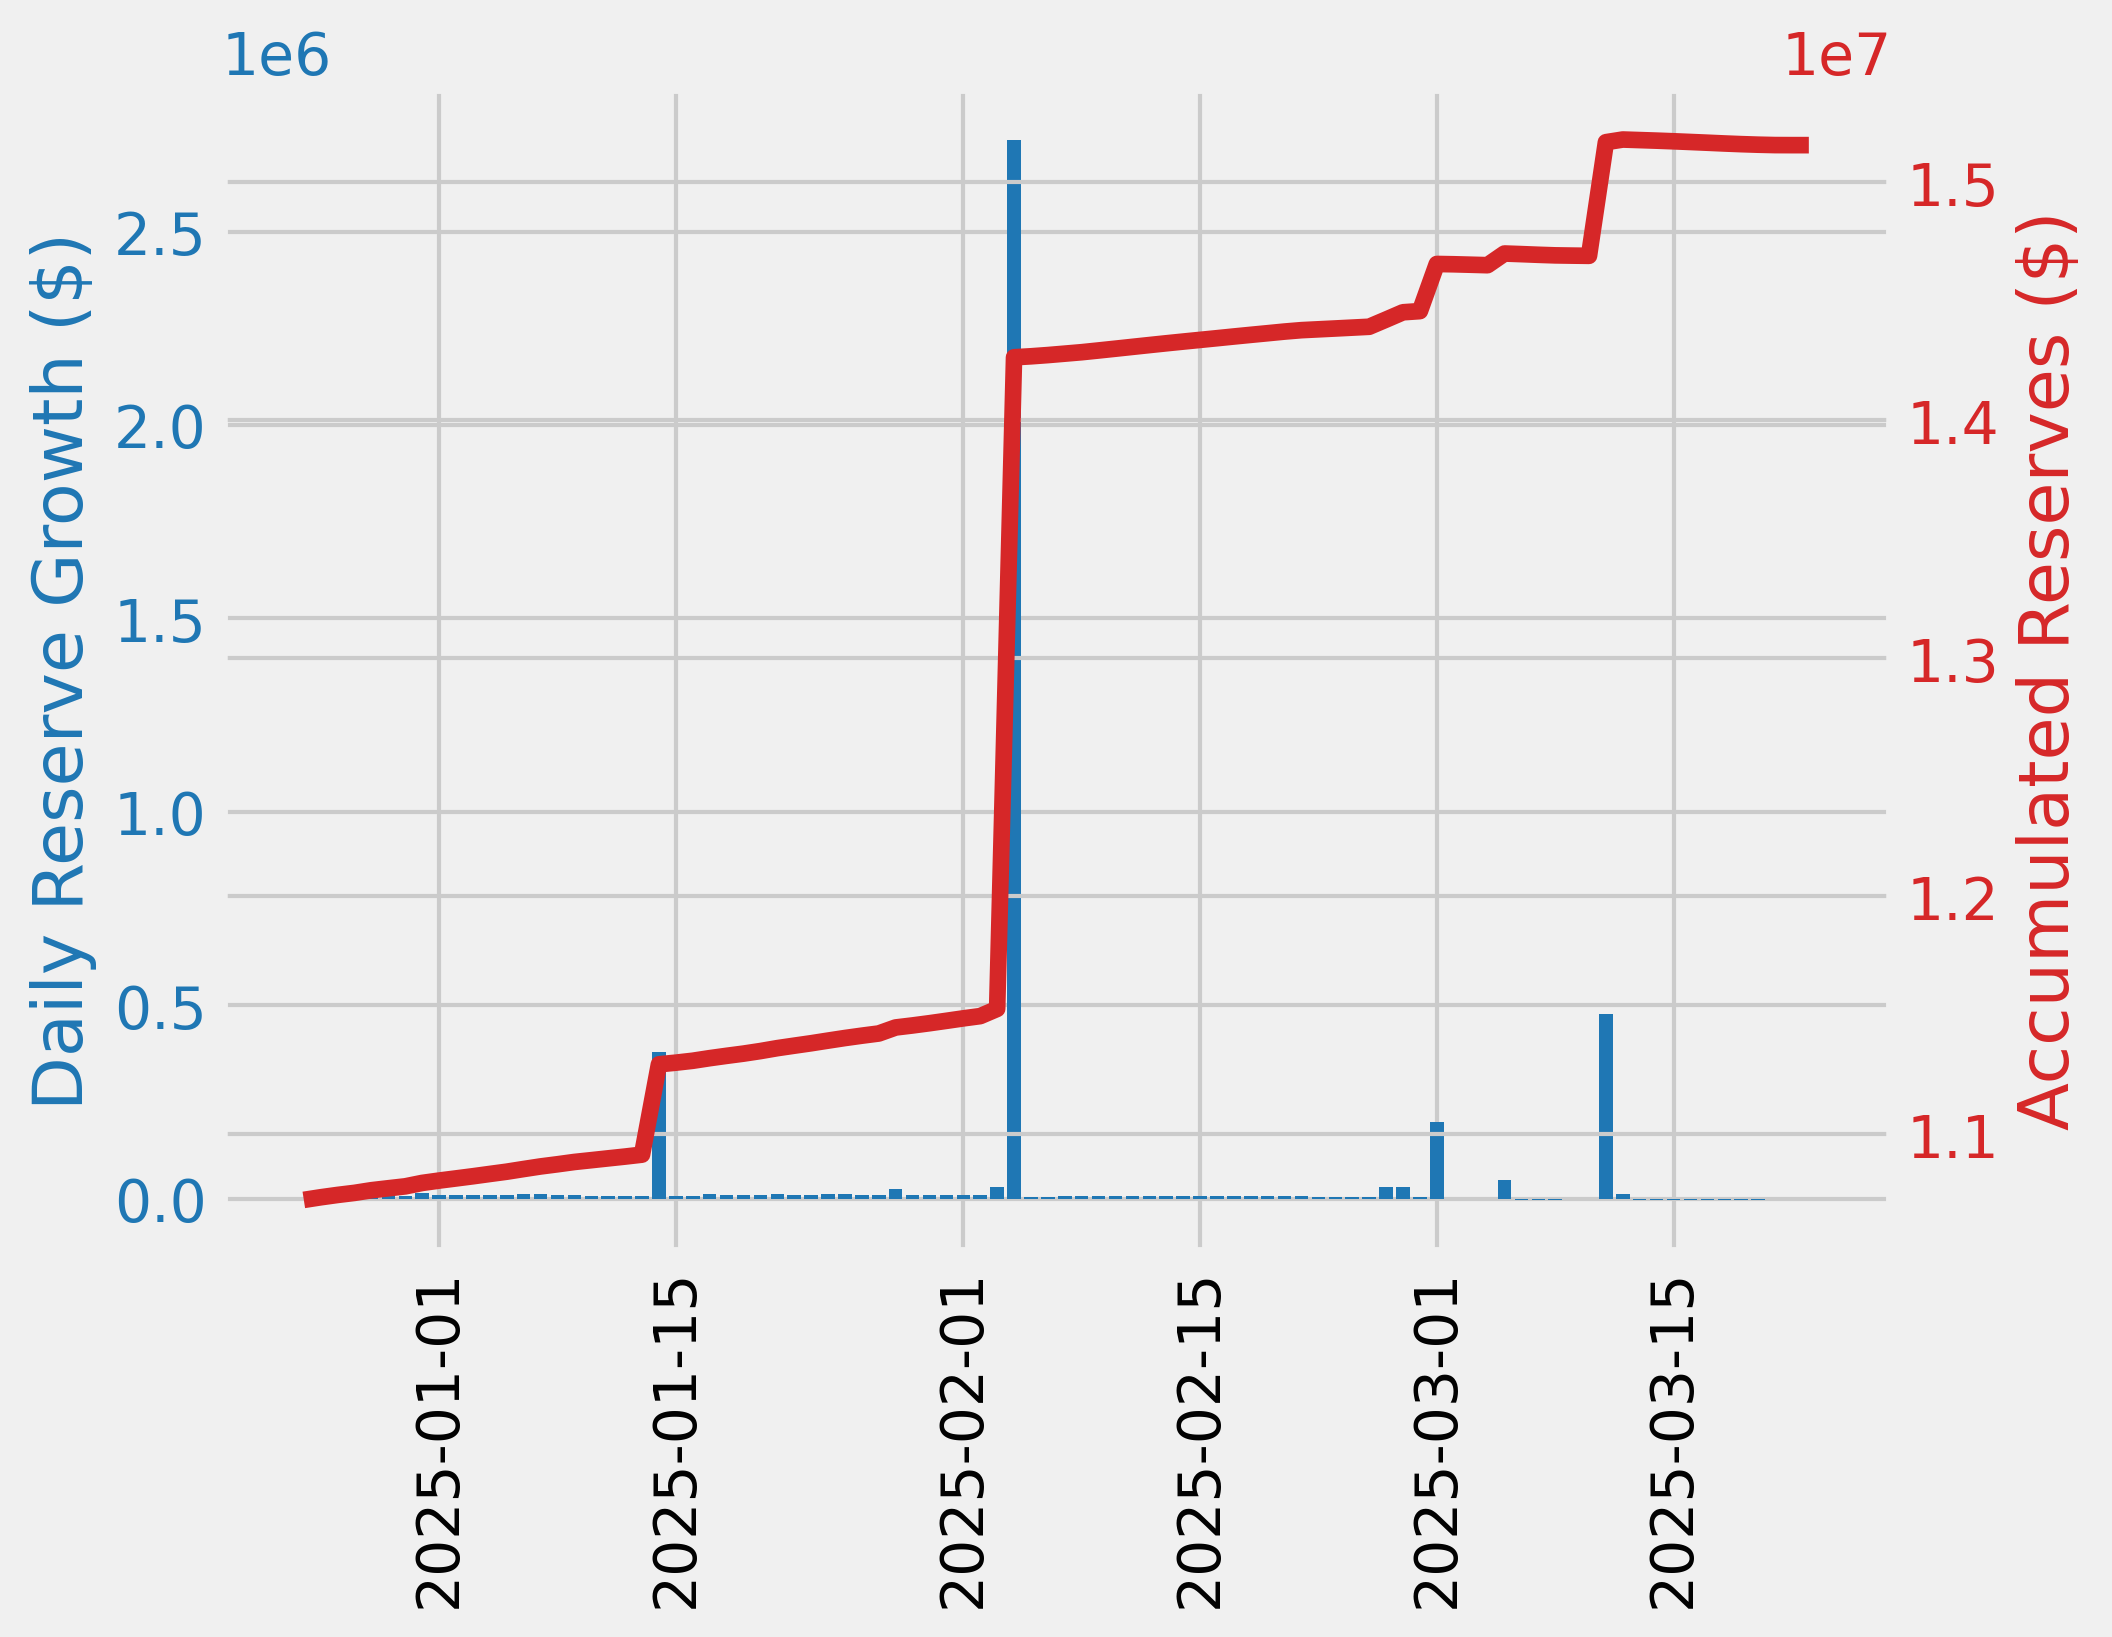
The minimum USDC.e reserve growth was -2.67%, and the maximum was 3.38%. The average USDC.e reserve growth was -1.60%.
-
The comet accumulated $-6.19 USDC.e reserves while distributing 0.00 COMP rewards for a weekly Net Protocol Profit of -6.19.
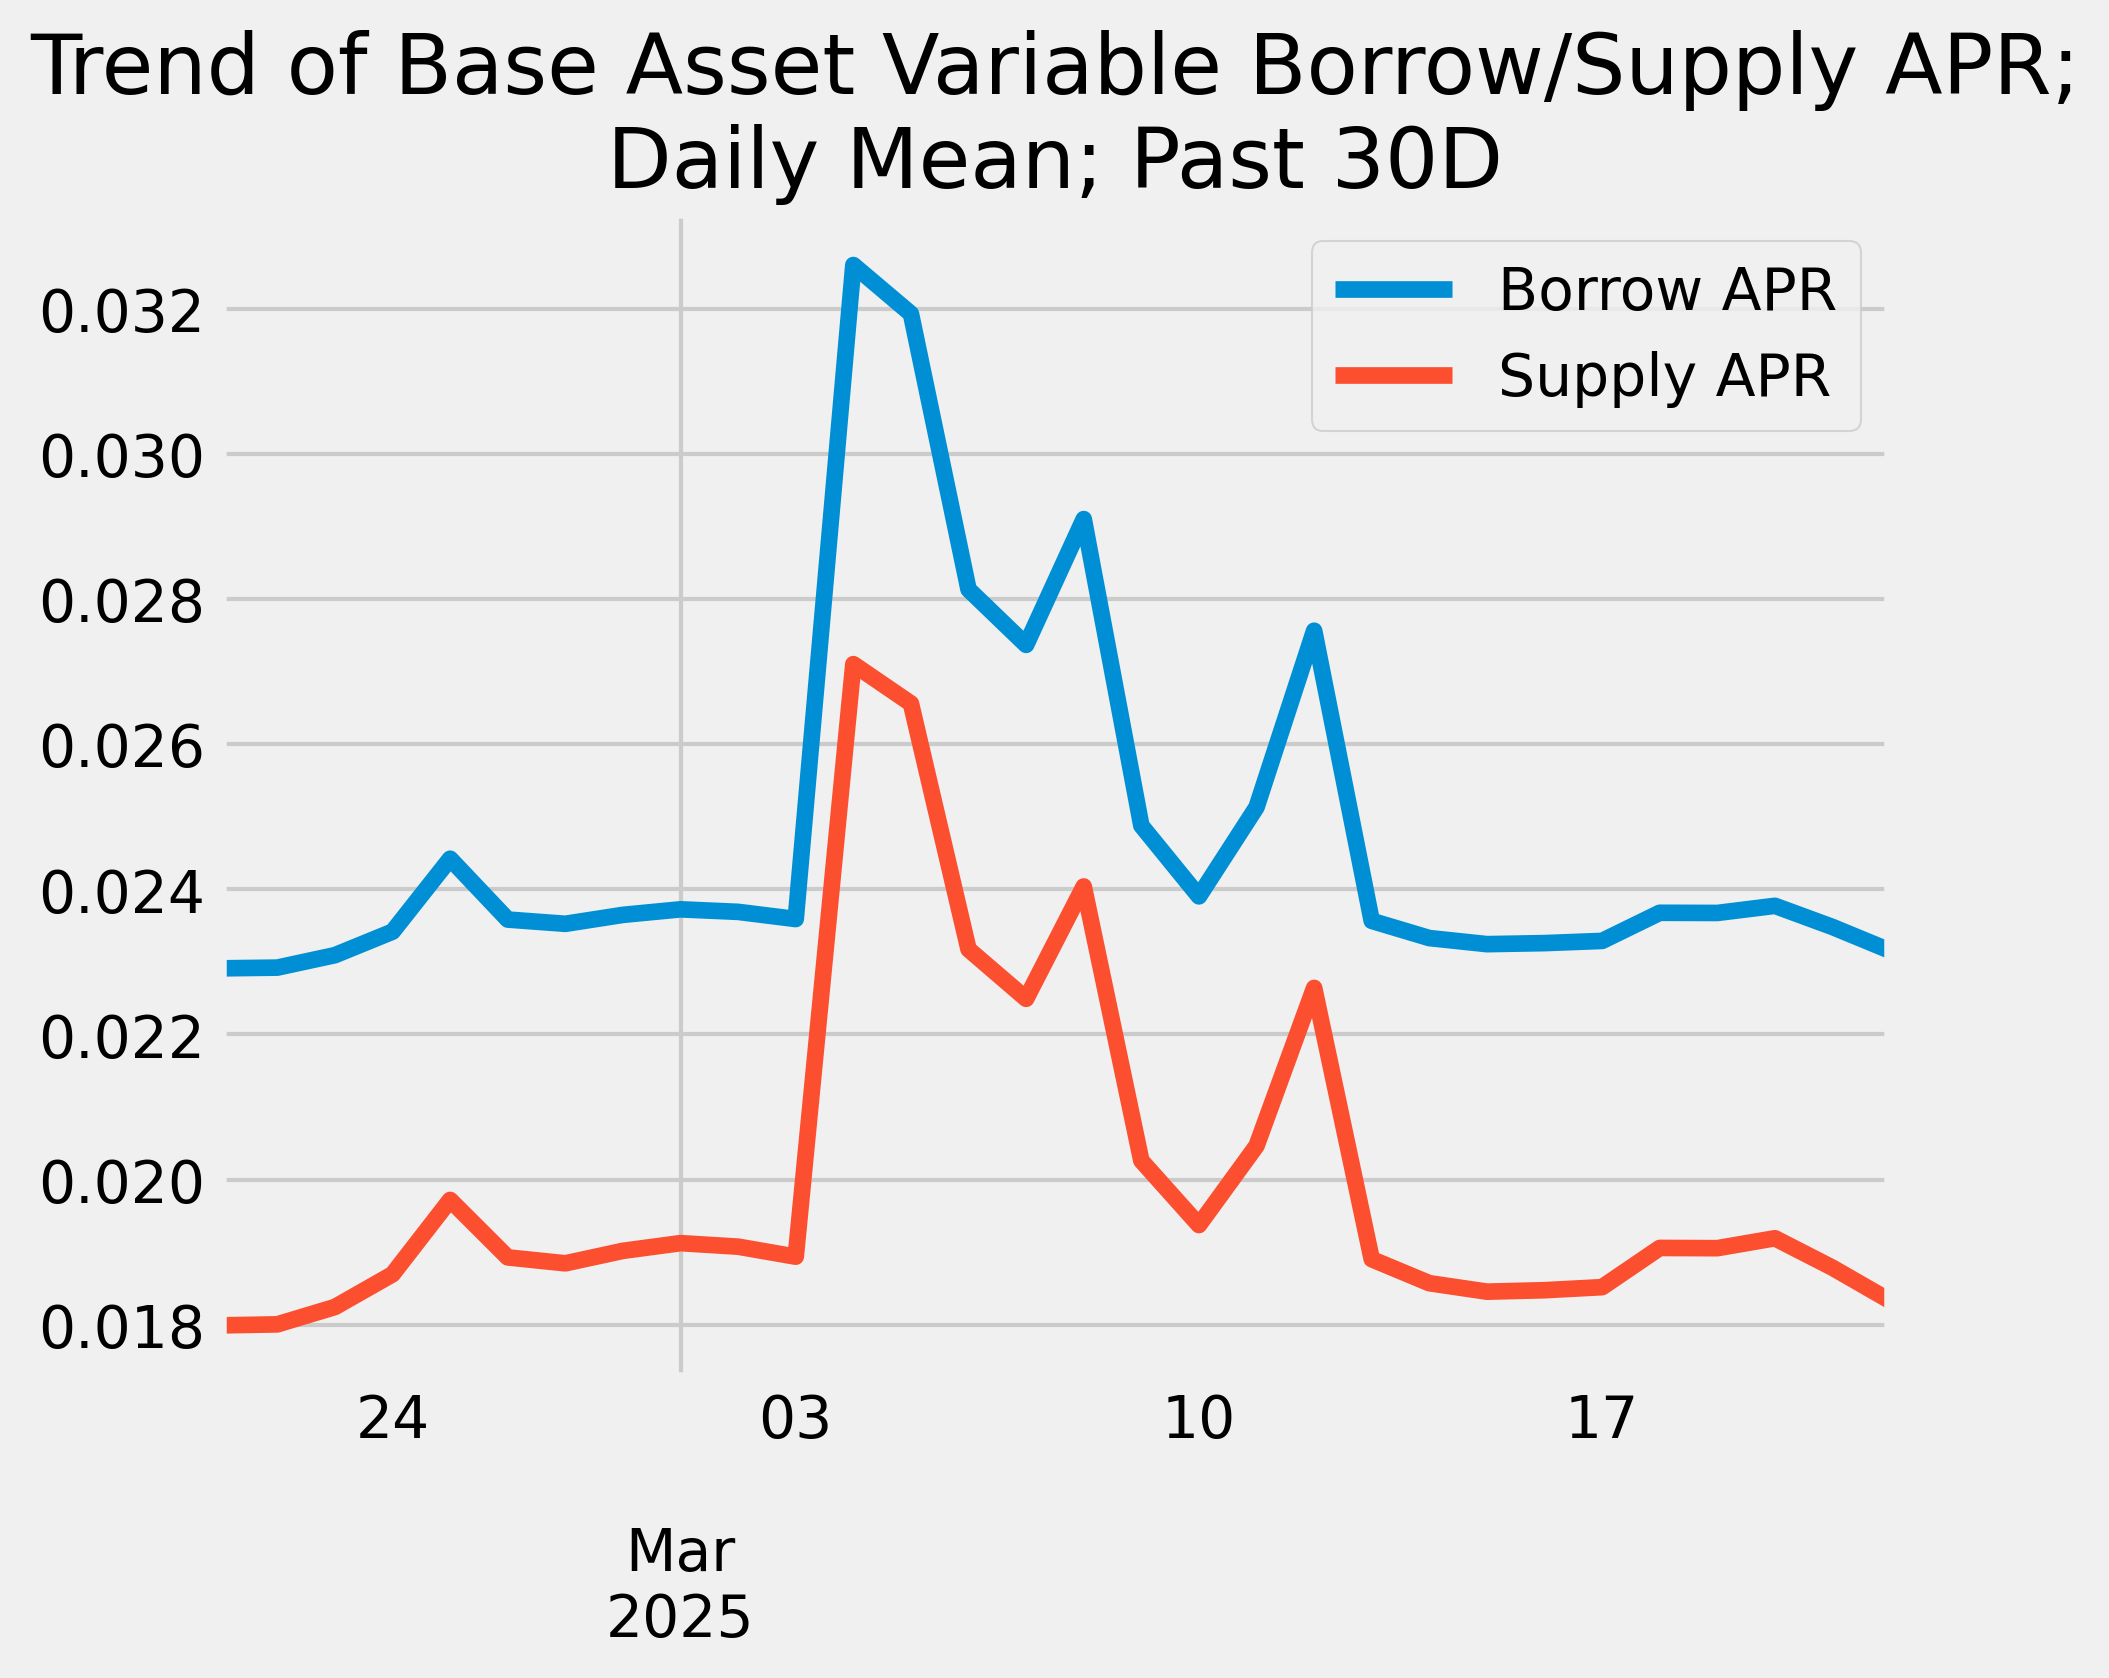
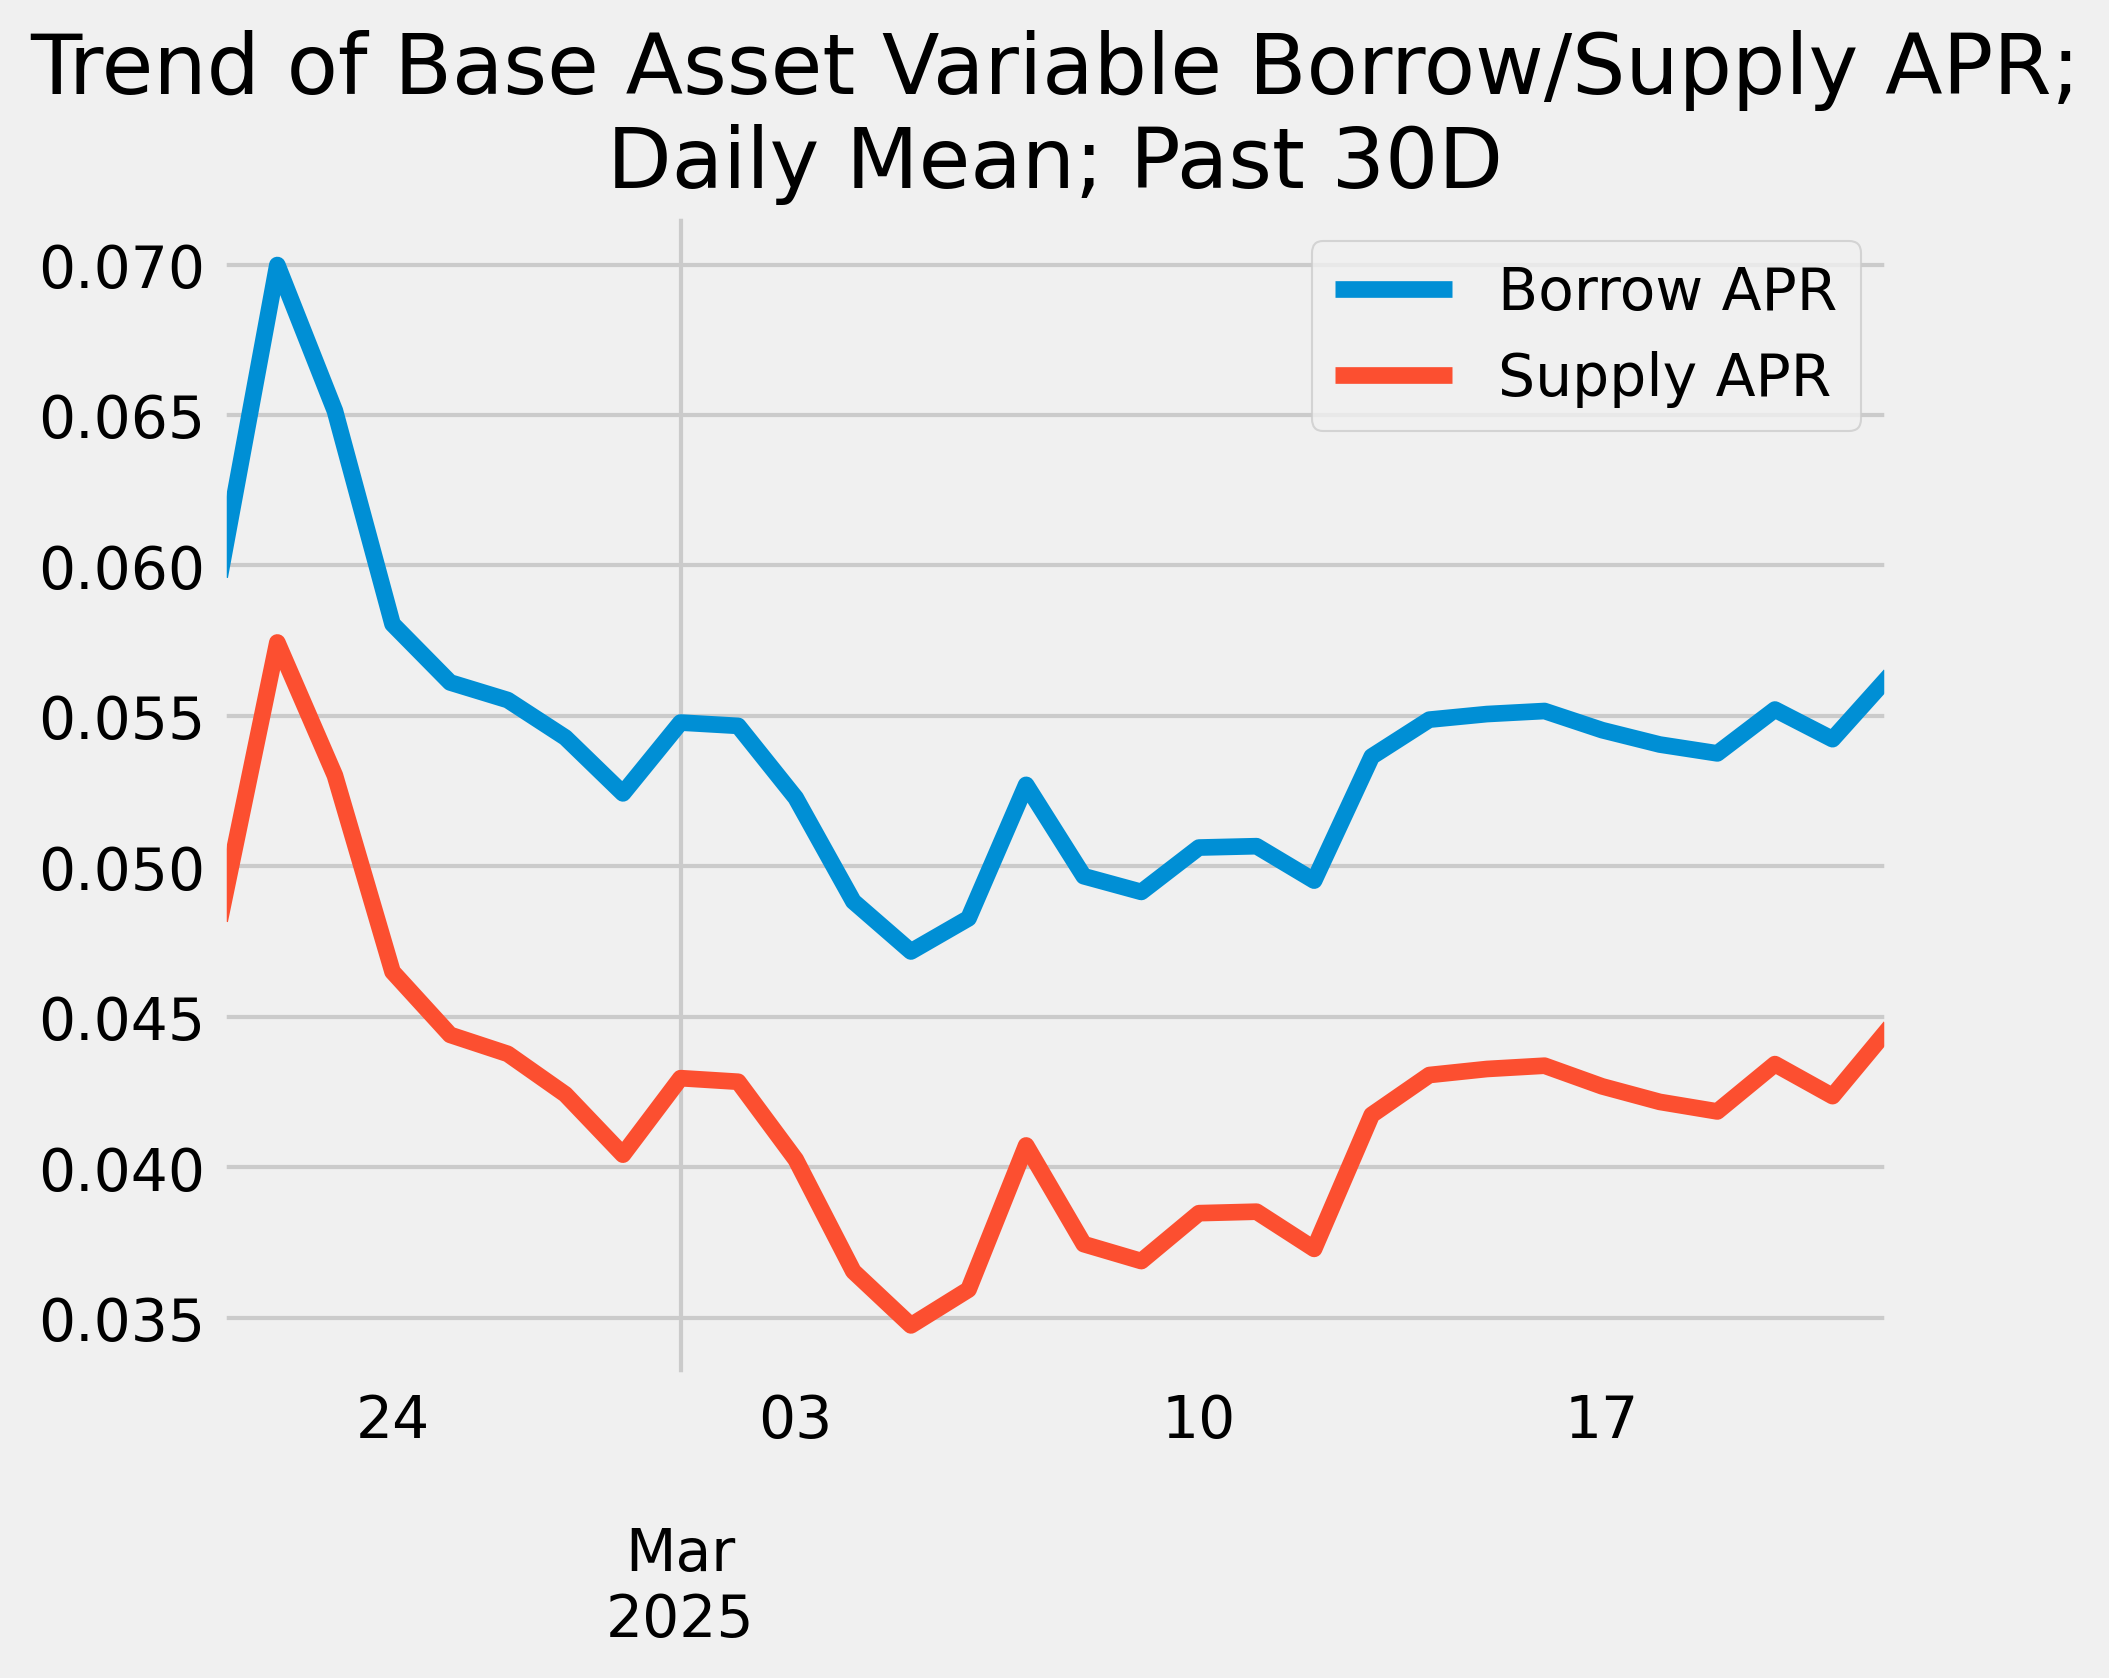
Base Asset APR Trend

Reserve Analysis

COMP Rewards Analysis
| Chain | CometRewards COMP token holdings | Daily aggregate COMP token reward distributions | Remaining days of rewards runway (not including existing claimable rewards) |
|---|---|---|---|
| arbitrum | 5.83K | 66.00 | 88.30 |
Collateral Asset Supply
This graph shows the trend of total supply of all collateral assets.

To see updated statistics, please see the live version of this graph here.
Base Asset Borrows
This graph shows the trend of total borrows of the base asset.

To see updated statistics, please see the live version of this graph here.
Utilization
This graph shows the utilization (borrow / supply) of the base asset over the past week.

Supply Cap Usage
This graph shows the supply cap usage (supply / supply cap) of all collateral assets over the past week.

arbitrum USDC Comet
Simple Summary
-
USDC Borrows decreased 5.46%, from $30.14M to $28.49M.
-
USDC Supply increased 1.36%, from $37.09M to $37.60M.
-
USDC utilization decreased 6.73%, from 81.26% to 75.79%.
-
The minimum USDC reserve growth was 1.00%, and the maximum was 12.23%. The average USDC reserve growth was 6.46%.
-
The comet accumulated $1.60K USDC reserves while distributing 8.66K COMP rewards for a weekly Net Protocol Profit of -7.06K.
Base Asset APR Trend

Reserve Analysis

COMP Rewards Analysis
| Chain | CometRewards COMP token holdings | Daily aggregate COMP token reward distributions | Remaining days of rewards runway (not including existing claimable rewards) |
|---|---|---|---|
| arbitrum | 5.83K | 66.00 | 88.30 |
Collateral Asset Supply
This graph shows the trend of total supply of all collateral assets.

To see updated statistics, please see the live version of this graph here.
Base Asset Borrows
This graph shows the trend of total borrows of the base asset.

To see updated statistics, please see the live version of this graph here.
Utilization
This graph shows the utilization (borrow / supply) of the base asset over the past week.

Supply Cap Usage
This graph shows the supply cap usage (supply / supply cap) of all collateral assets over the past week.

arbitrum WETH Comet
Simple Summary
-
WETH Borrows decreased 9.29%, from $11.67M to $10.59M.
-
WETH Supply decreased 8.43%, from $12.92M to $11.83M.
-
WETH utilization did not change, remaining at 90.38%.
-
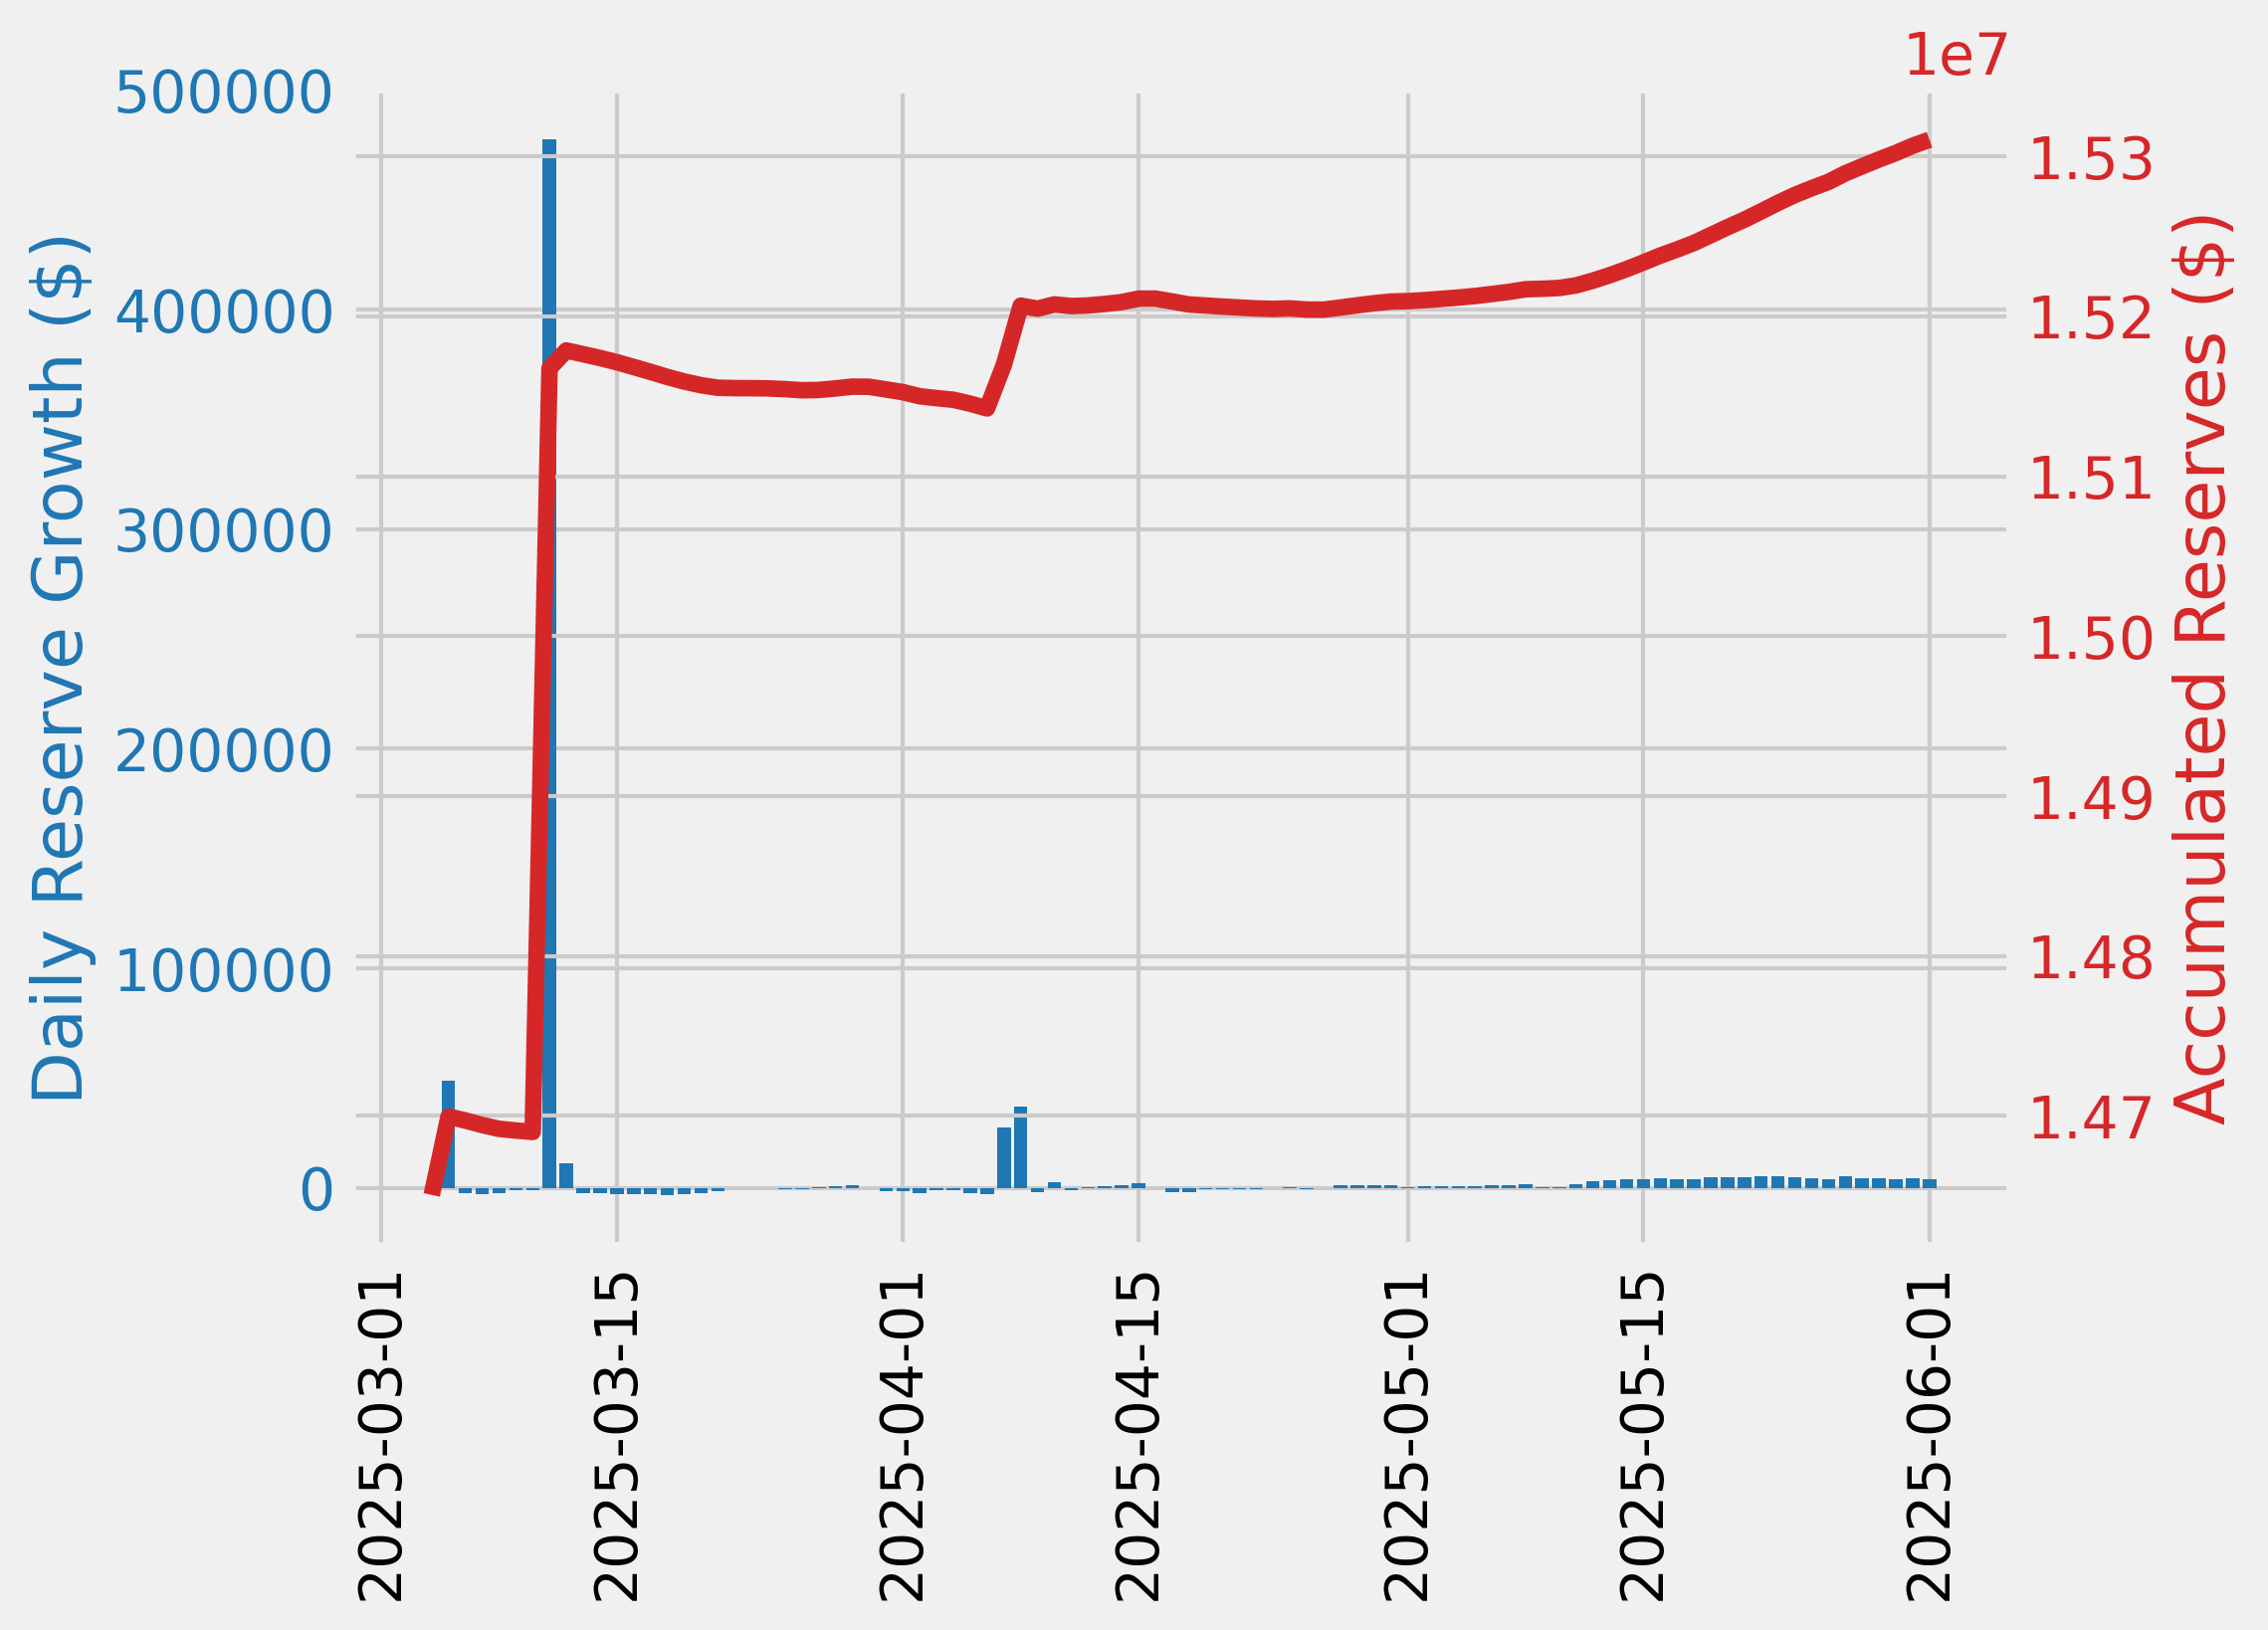
The minimum WETH reserve growth was 20.78%, and the maximum was 28.41%. The average WETH reserve growth was 27.24%.
-
The comet accumulated $1.40K WETH reserves while distributing 3.18K COMP rewards for a weekly Net Protocol Profit of -1.78K.
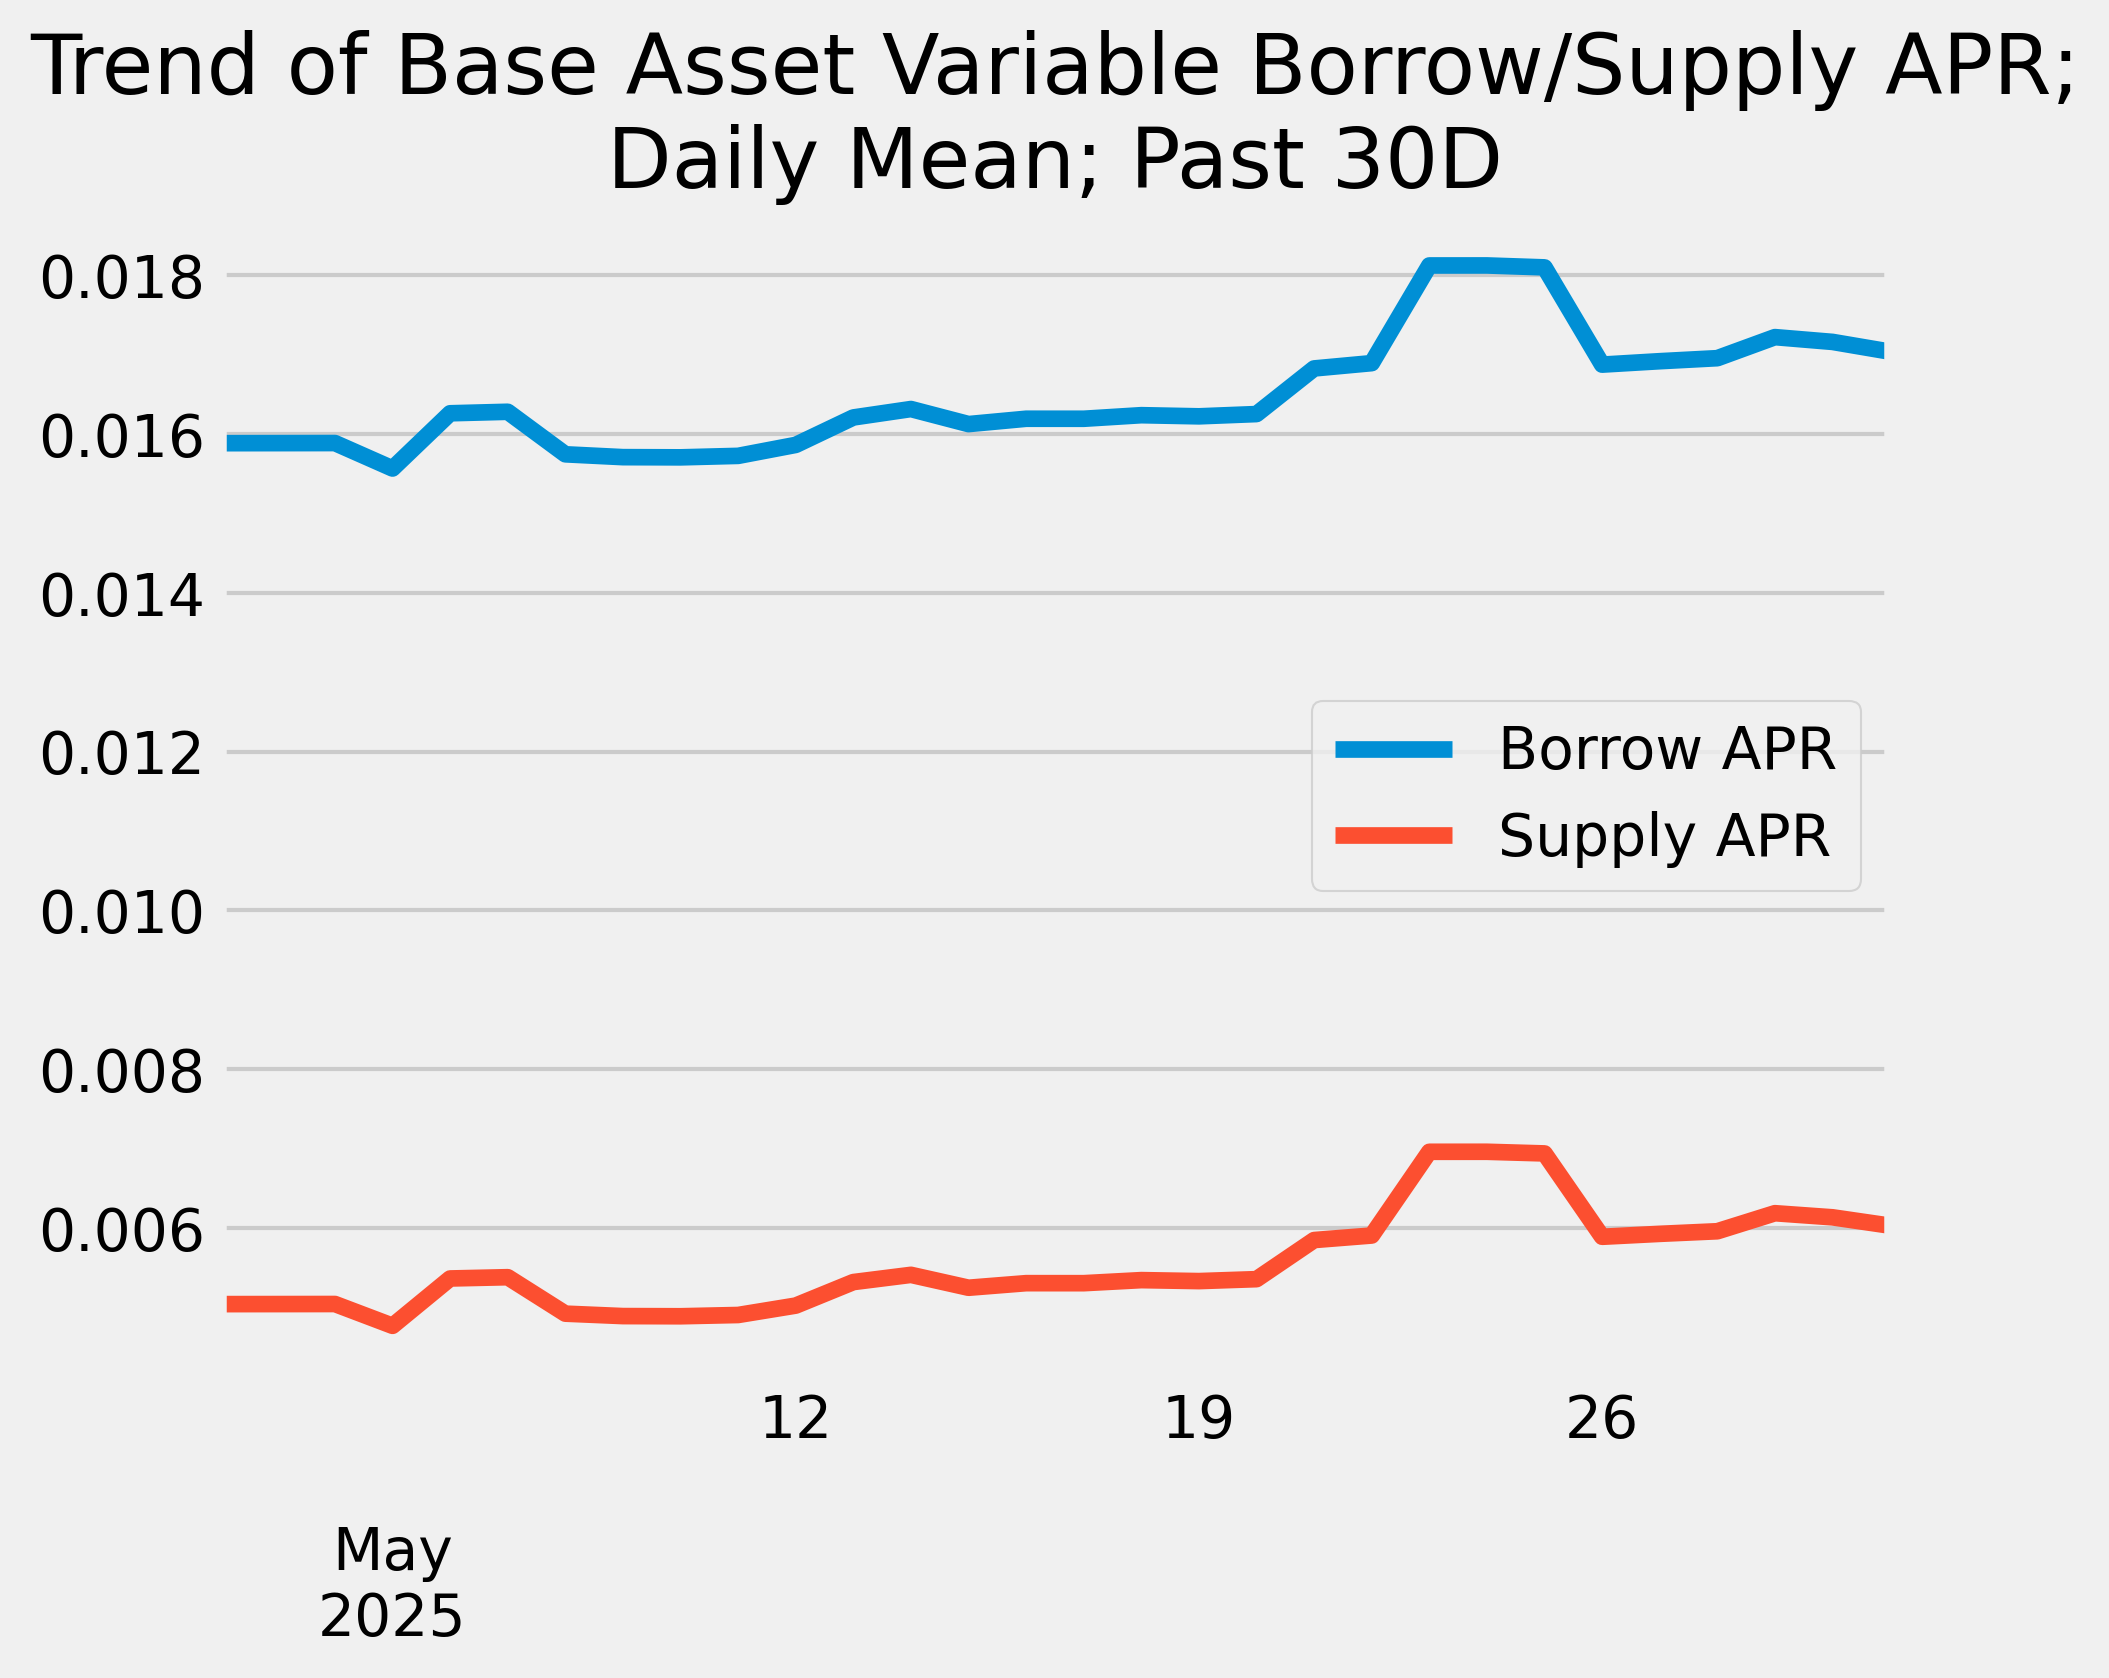
Base Asset APR Trend

Reserve Analysis

COMP Rewards Analysis
| Chain | CometRewards COMP token holdings | Daily aggregate COMP token reward distributions | Remaining days of rewards runway (not including existing claimable rewards) |
|---|---|---|---|
| arbitrum | 5.83K | 66.00 | 88.30 |
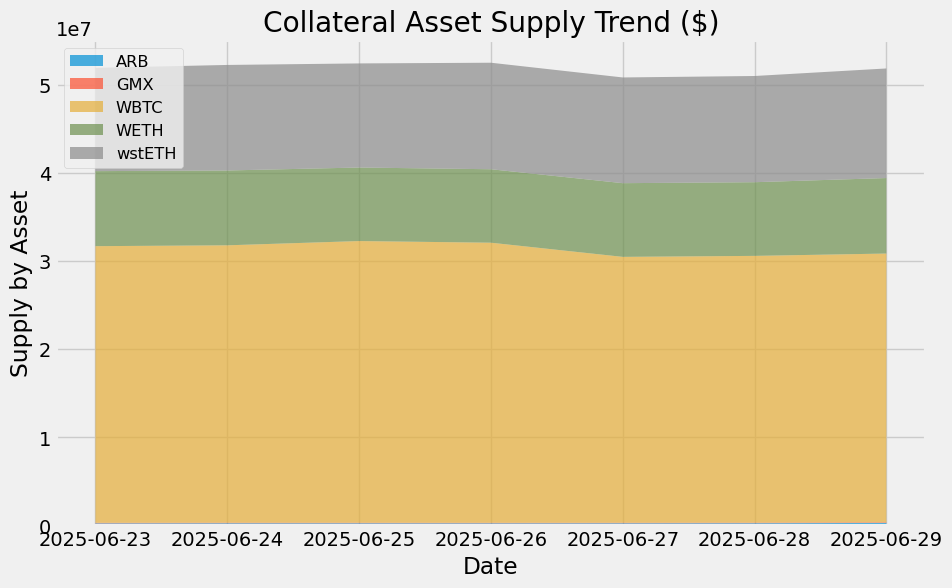
Collateral Asset Supply
This graph shows the trend of total supply of all collateral assets.

To see updated statistics, please see the live version of this graph here.
Base Asset Borrows
This graph shows the trend of total borrows of the base asset.

To see updated statistics, please see the live version of this graph here.
Utilization
This graph shows the utilization (borrow / supply) of the base asset over the past week.

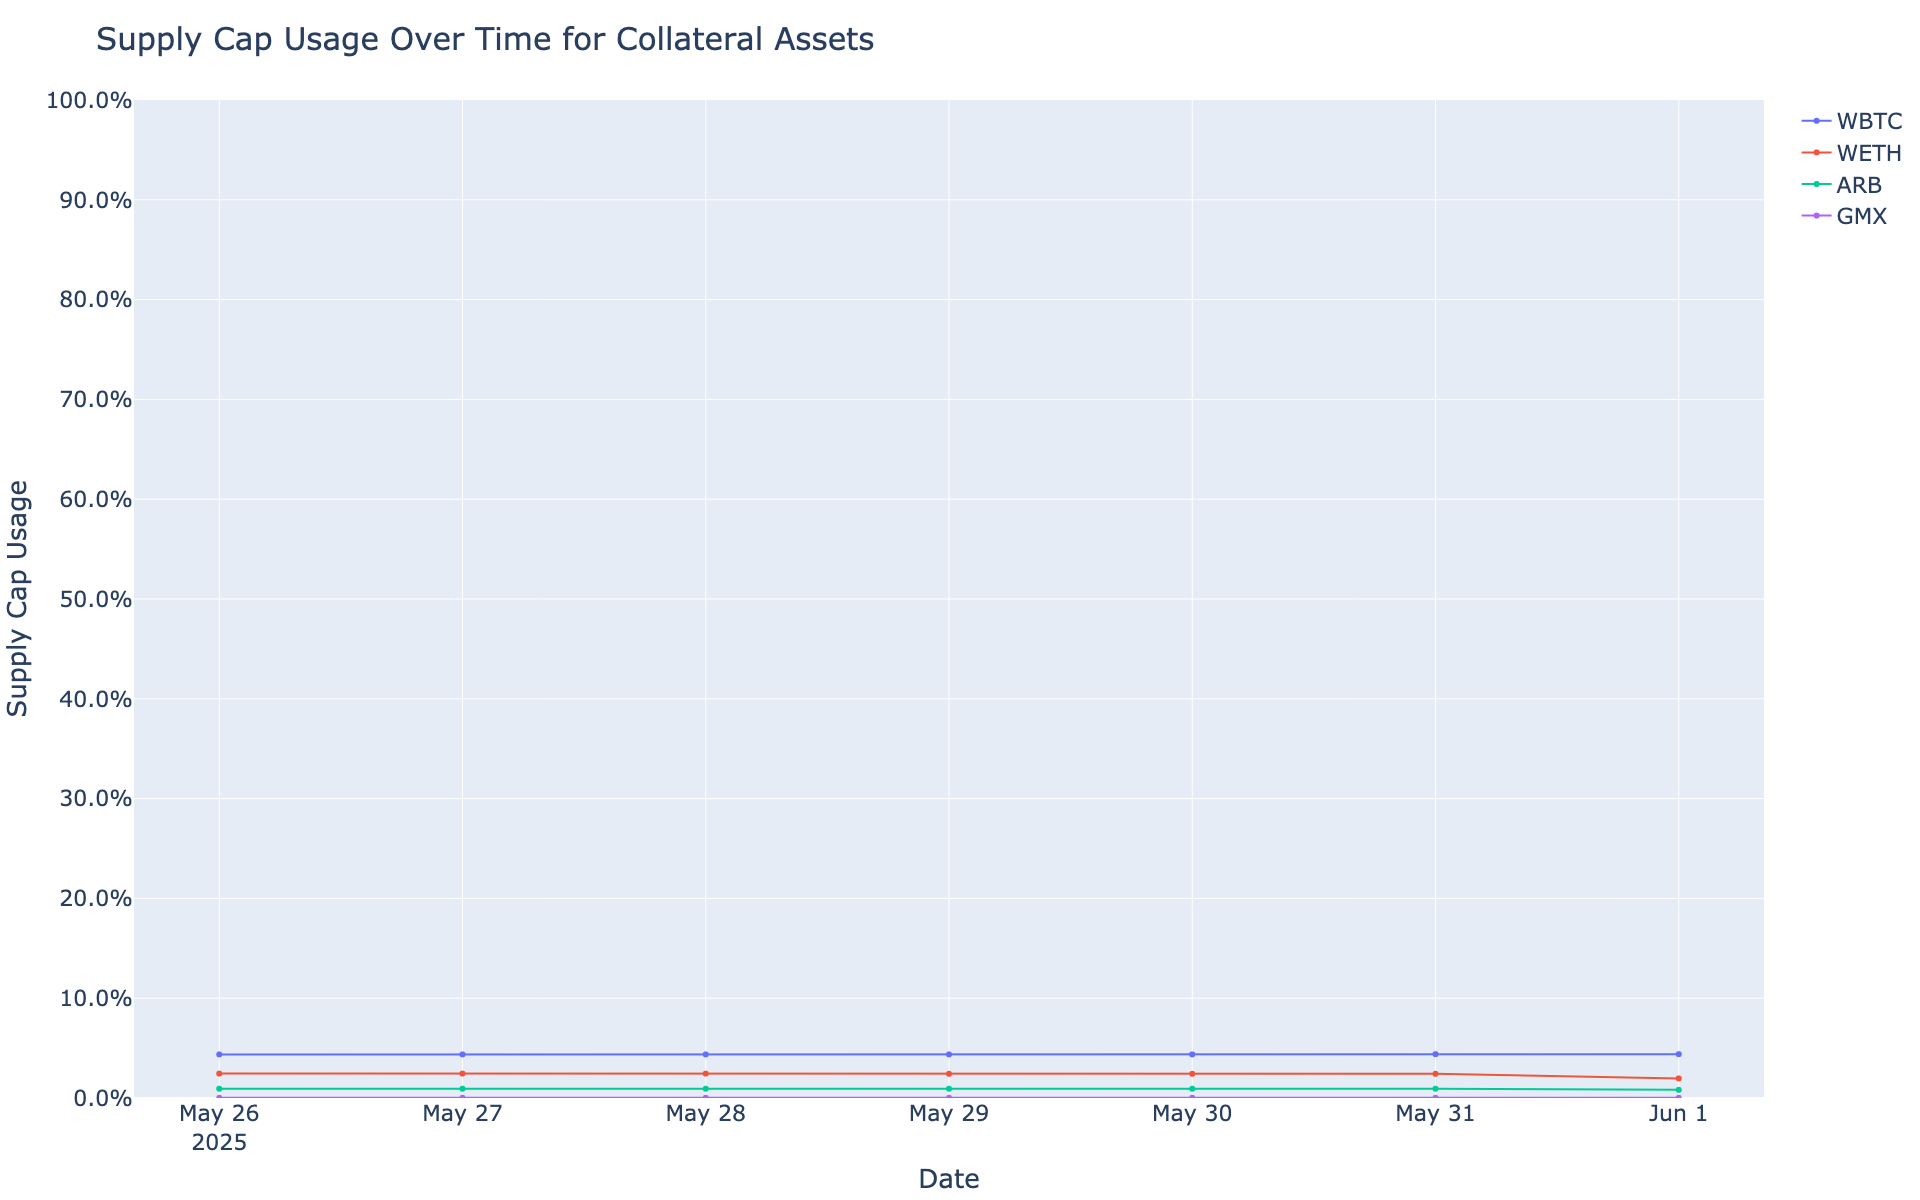
Supply Cap Usage
This graph shows the supply cap usage (supply / supply cap) of all collateral assets over the past week.

arbitrum USDT Comet
Simple Summary
-
USDT Borrows decreased 8.67%, from $19.00M to $17.36M.
-
USDT Supply increased 5.62%, from $35.96M to $37.98M.
-
USDT utilization decreased 13.53%, from 52.84% to 45.69%.
-
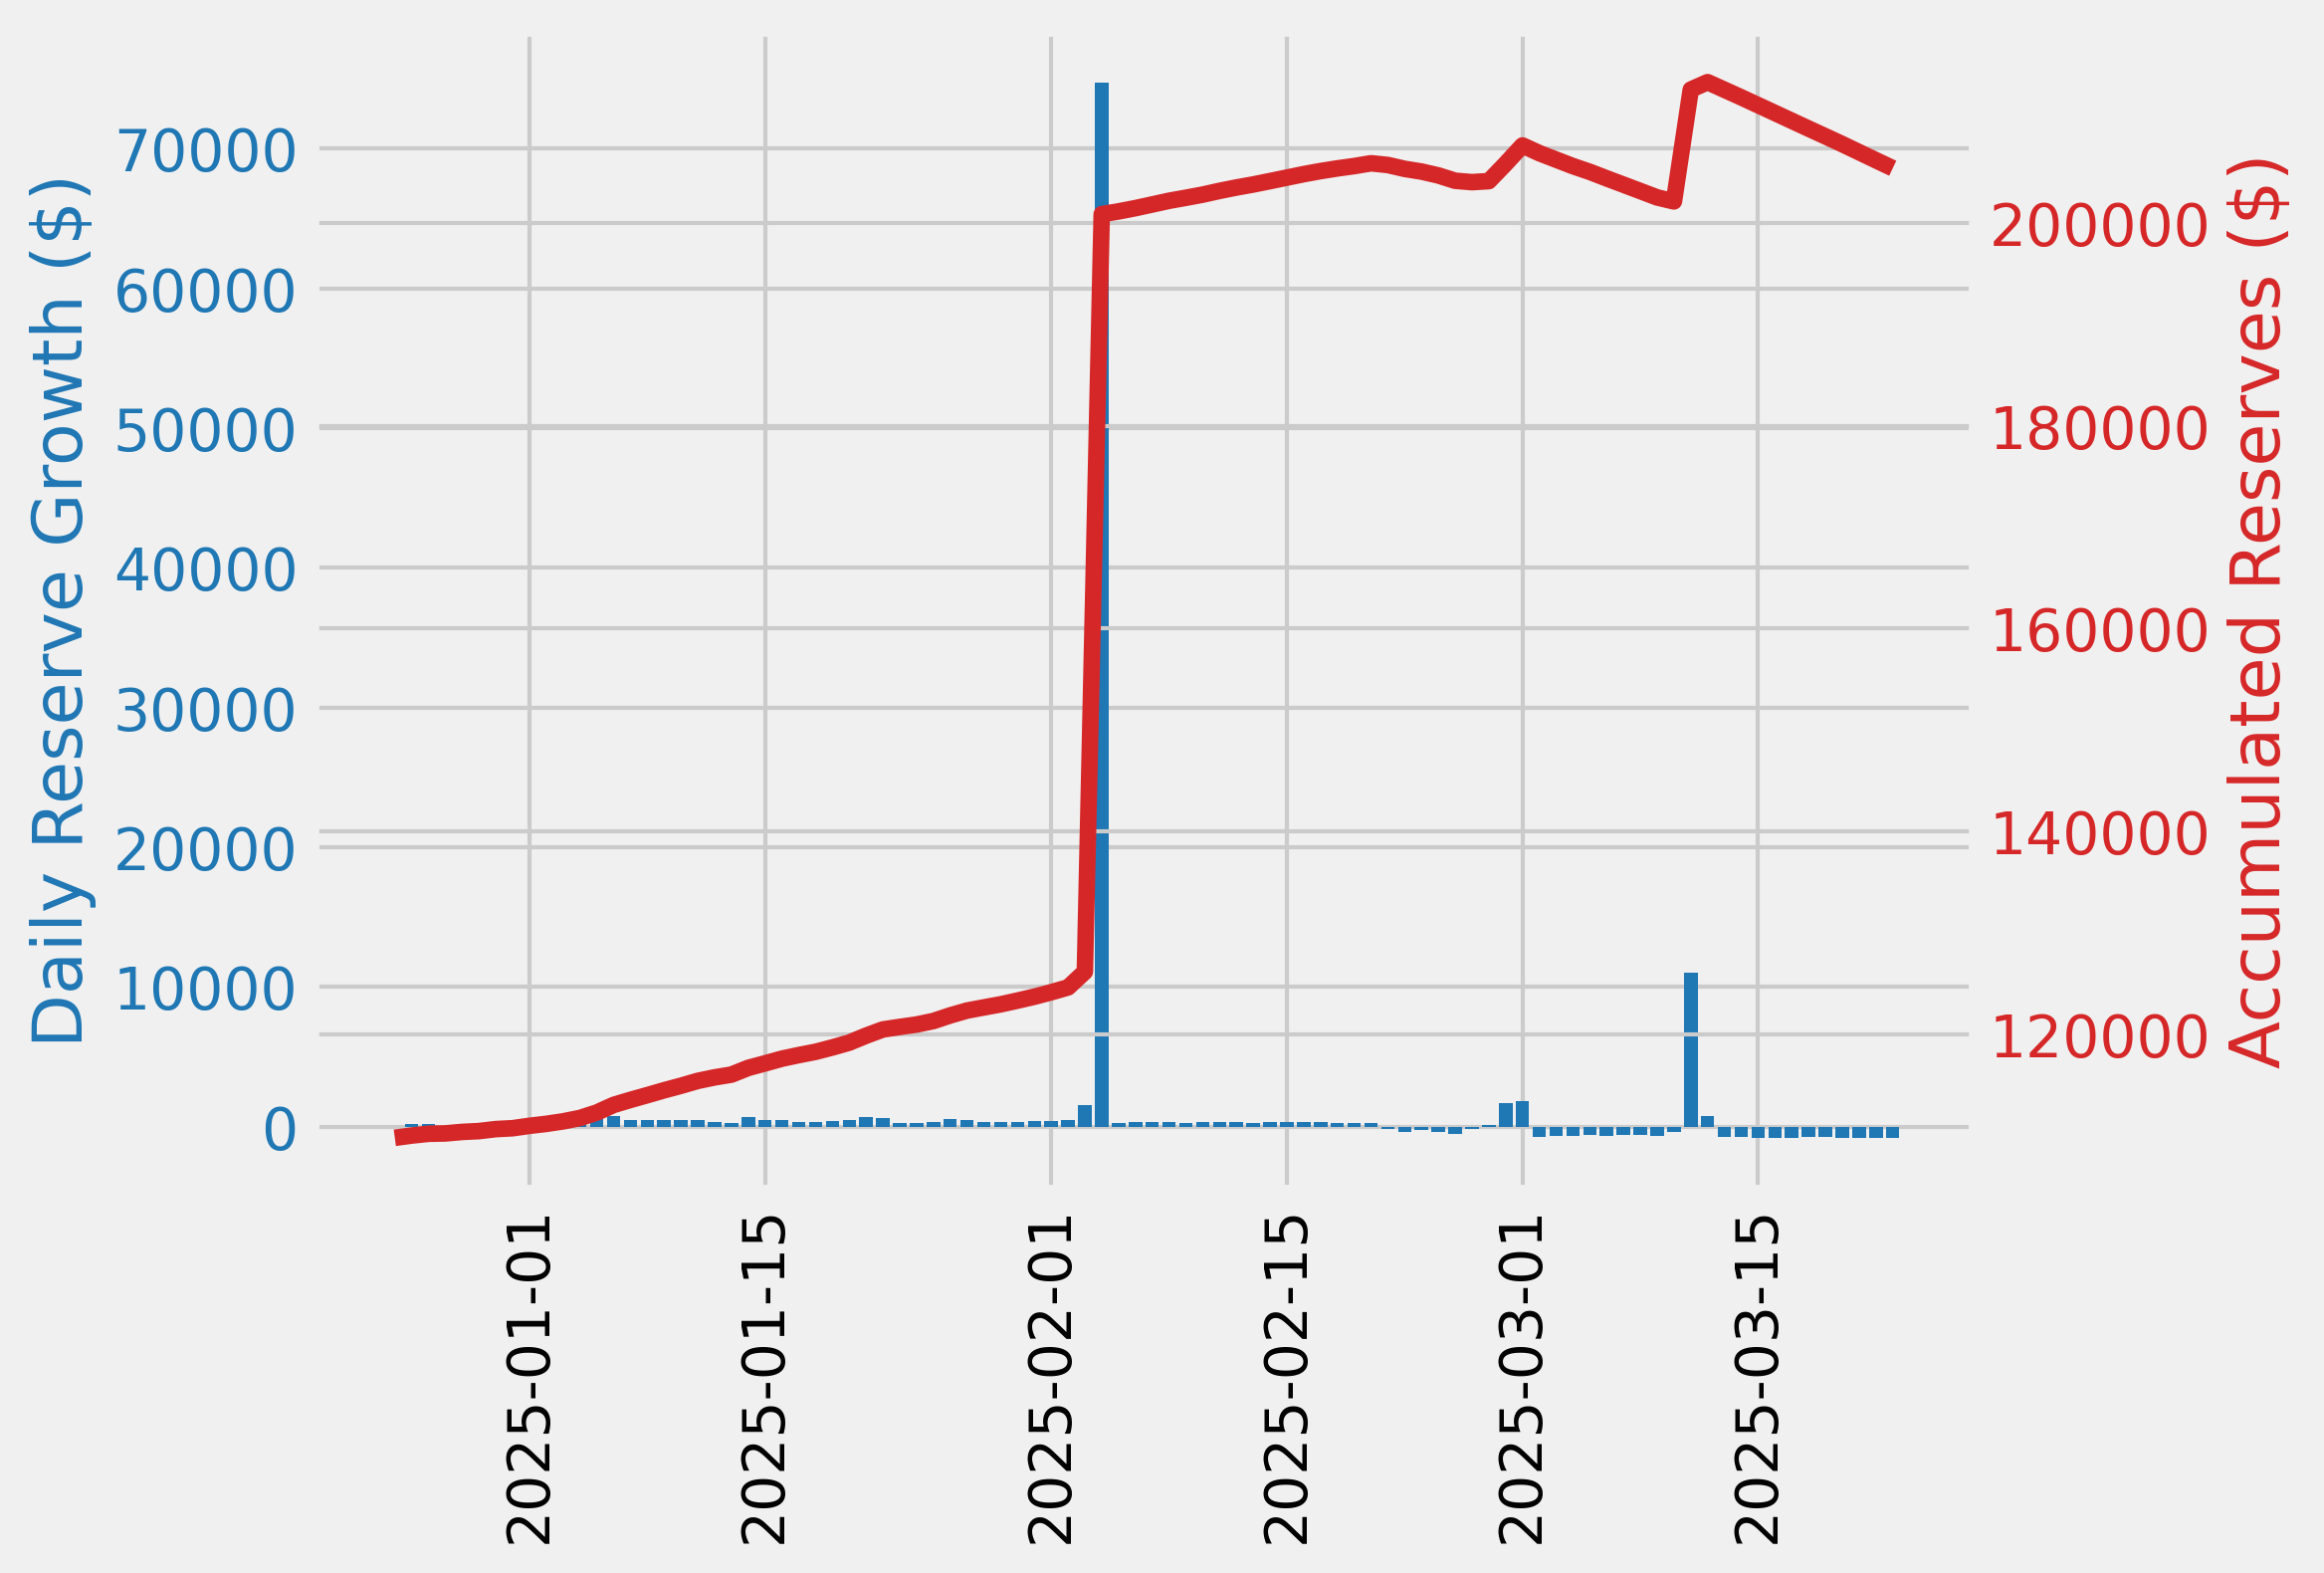
The minimum USDT reserve growth was -44.92%, and the maximum was -30.37%. The average USDT reserve growth was -41.31%.
-
The comet accumulated $-5.20K USDT reserves while distributing 7.22K COMP rewards for a weekly Net Protocol Profit of -12.42K.
Base Asset APR Trend

Reserve Analysis

COMP Rewards Analysis
| Chain | CometRewards COMP token holdings | Daily aggregate COMP token reward distributions | Remaining days of rewards runway (not including existing claimable rewards) |
|---|---|---|---|
| arbitrum | 5.83K | 66.00 | 88.30 |
Collateral Asset Supply
This graph shows the trend of total supply of all collateral assets.

To see updated statistics, please see the live version of this graph here.
Base Asset Borrows
This graph shows the trend of total borrows of the base asset.

To see updated statistics, please see the live version of this graph here.
Utilization
This graph shows the utilization (borrow / supply) of the base asset over the past week.

Supply Cap Usage
This graph shows the supply cap usage (supply / supply cap) of all collateral assets over the past week.

Mantle Ecosystem Update
mantle USDe Comet
Simple Summary
-
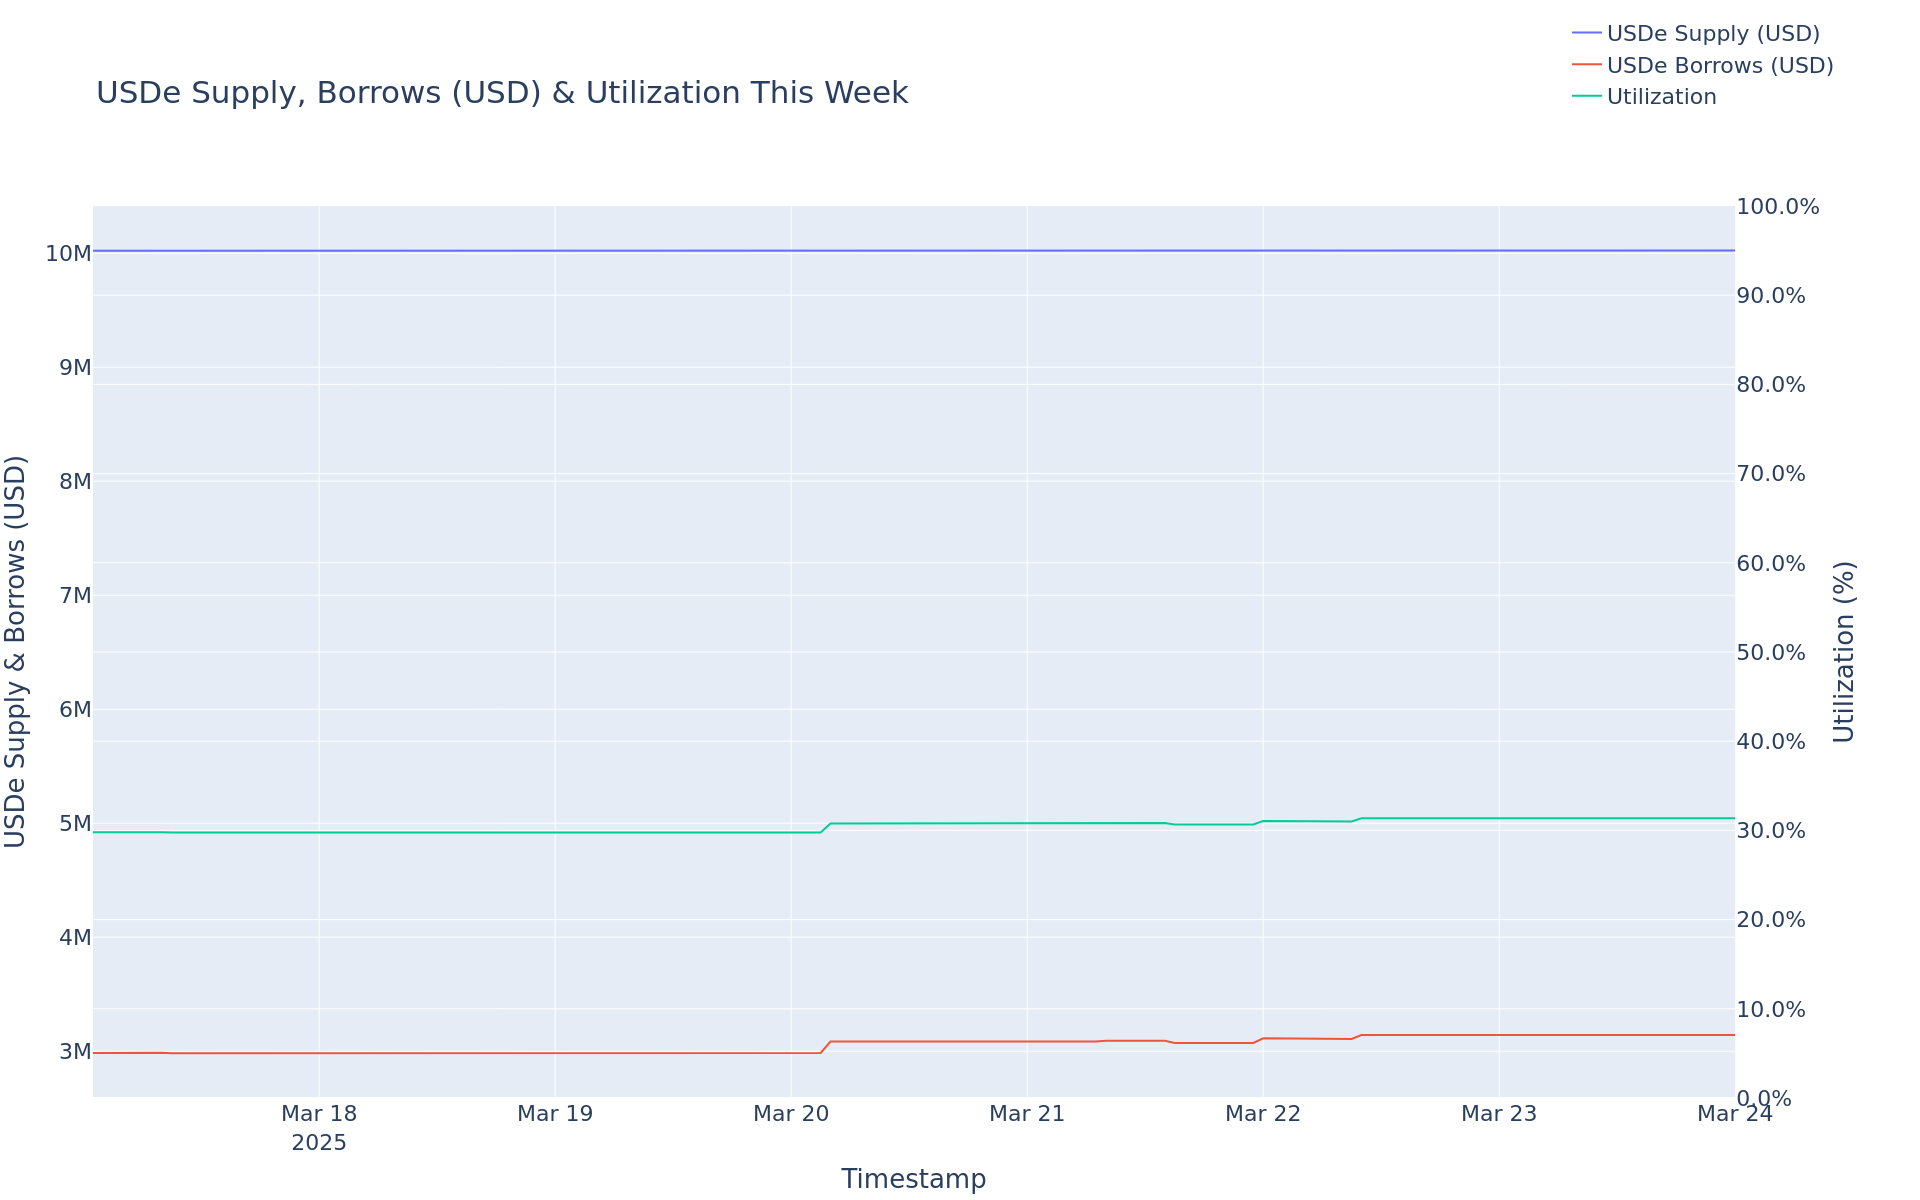
USDe Borrows increased 3.37%, from $2.89M to $2.98M.
-
USDe Supply has not changed, remaining at $10.02M.
-
USDe utilization increased 3.32%, from 28.83% to 29.78%.
-
The minimum USDe reserve growth was -64.90%, and the maximum was -56.51%. The average USDe reserve growth was -62.79%.
-
The comet accumulated $-776.97 USDe reserves while distributing 2.31K COMP rewards for a weekly Net Protocol Profit of -3.09K.
Base Asset APR Trend

Reserve Analysis

COMP Rewards Analysis
| Chain | CometRewards COMP token holdings | Daily aggregate COMP token reward distributions | Remaining days of rewards runway (not including existing claimable rewards) |
|---|---|---|---|
| mantle | 0.00 | 0.00 | 0.00 |
Collateral Asset Supply
This graph shows the trend of total supply of all collateral assets.

To see updated statistics, please see the live version of this graph here.
Base Asset Borrows
This graph shows the trend of total borrows of the base asset.

To see updated statistics, please see the live version of this graph here.
Utilization
This graph shows the utilization (borrow / supply) of the base asset over the past week.

Supply Cap Usage
This graph shows the supply cap usage (supply / supply cap) of all collateral assets over the past week.