[Gauntlet] Arbitrum Ecosystem Update: (2024-09-23 through 2024-09-29)
Arbitrum USDC.e Comet
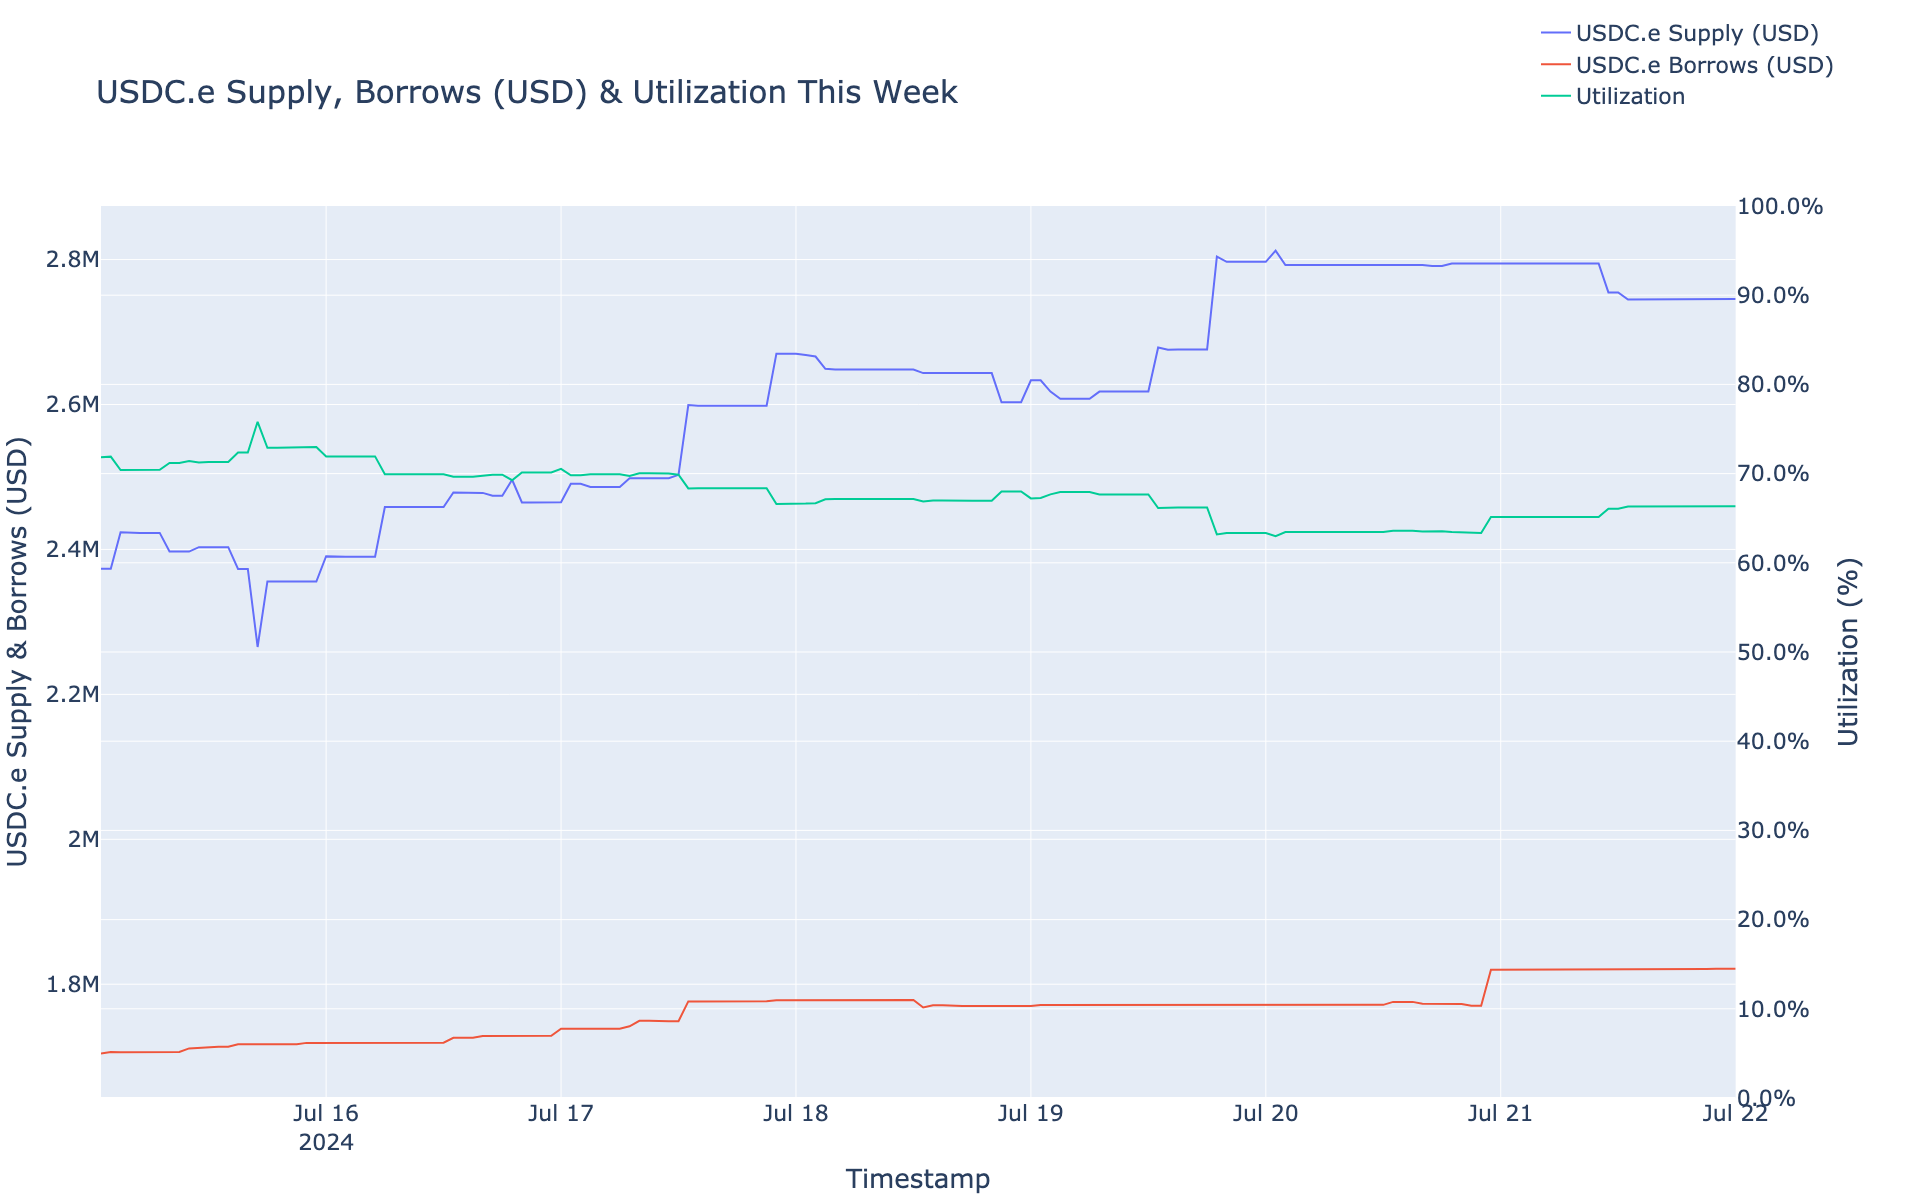
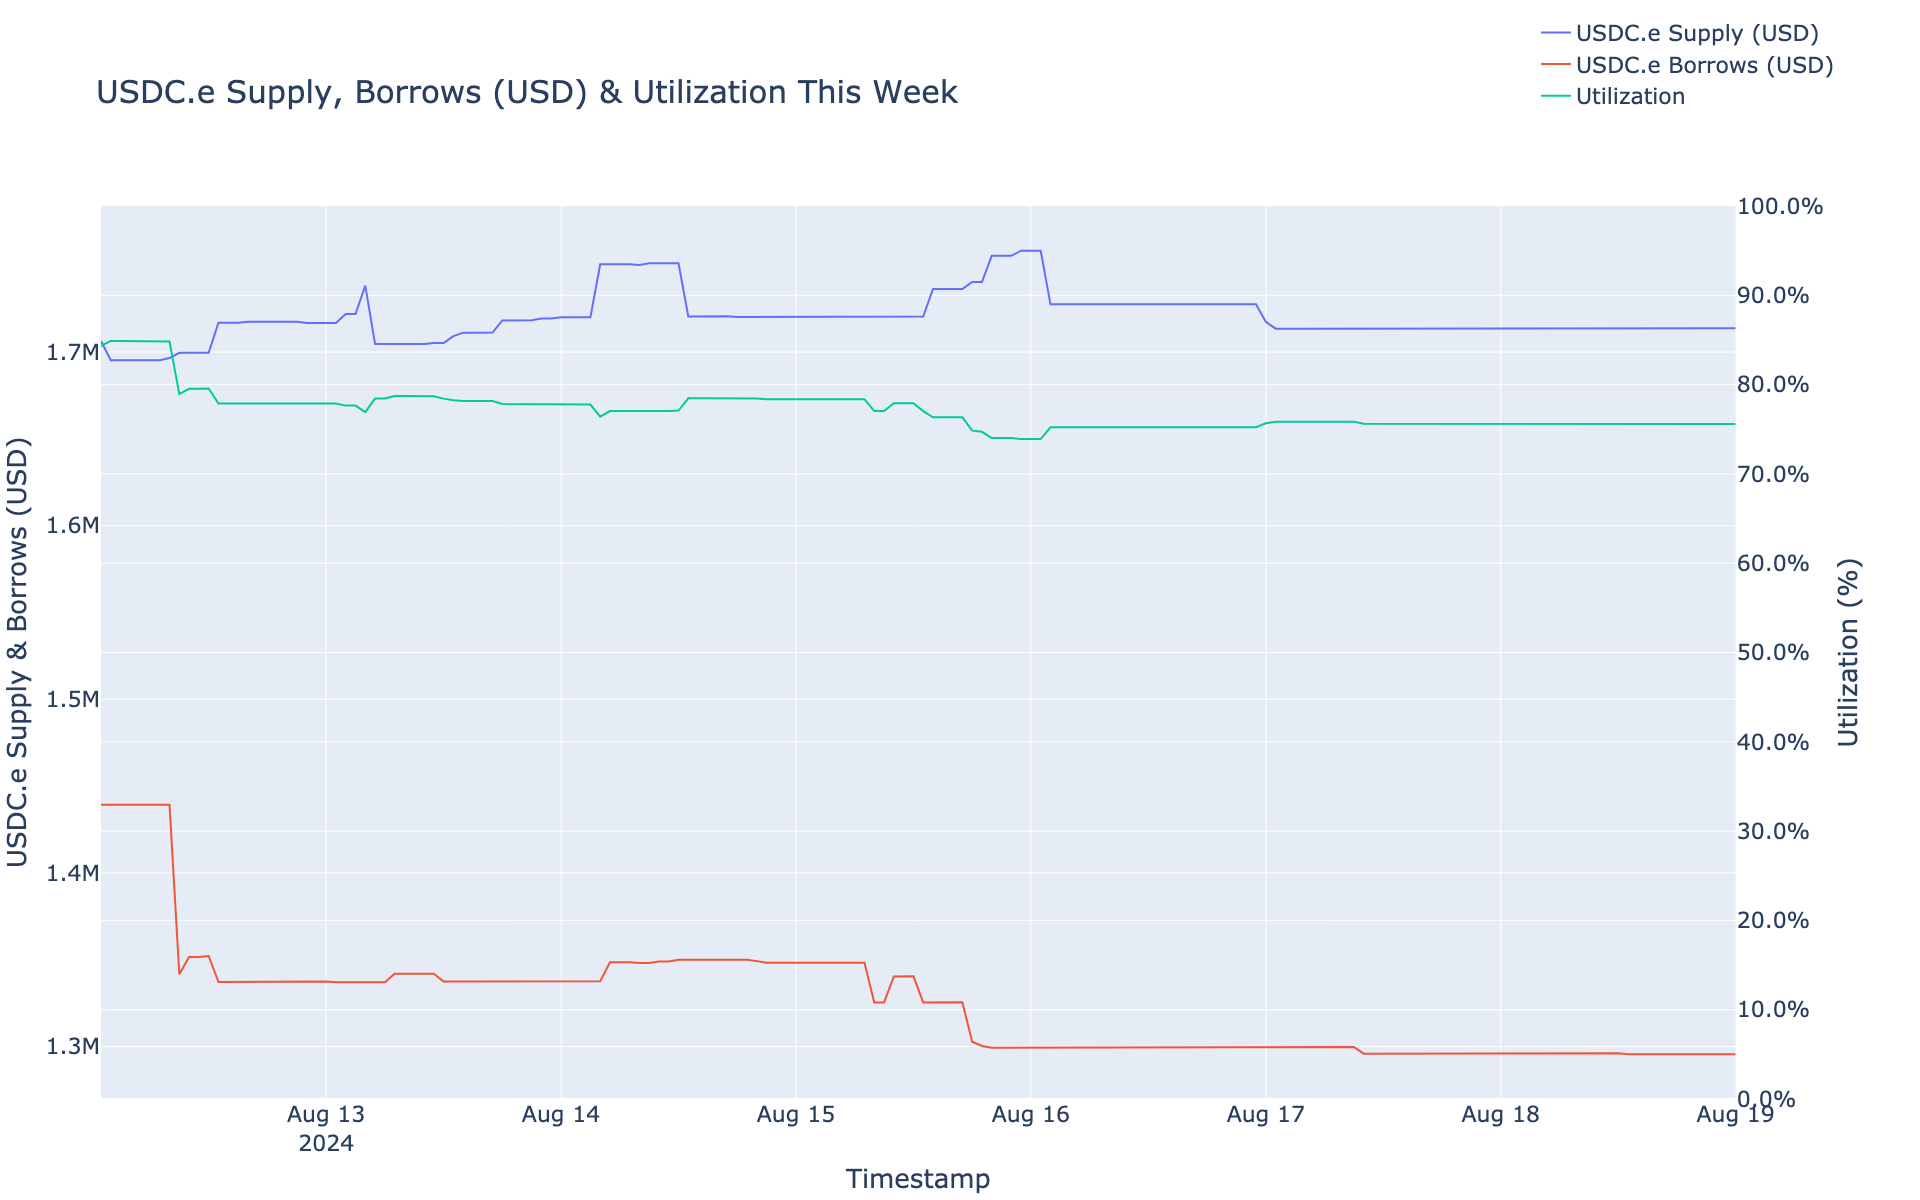
Gauntlet would like to provide the community with an update on the Arbitrum USDC.e comet over the past week.
Simple Summary
-
USDC.e Borrows decreased 2.63%, from $974.74K to $949.06K.
-
USDC.e Supply decreased 3.47%, from $1.11M to $1.07M.
-
USDC.e utilization did not change, remaining at 87.97%.
-
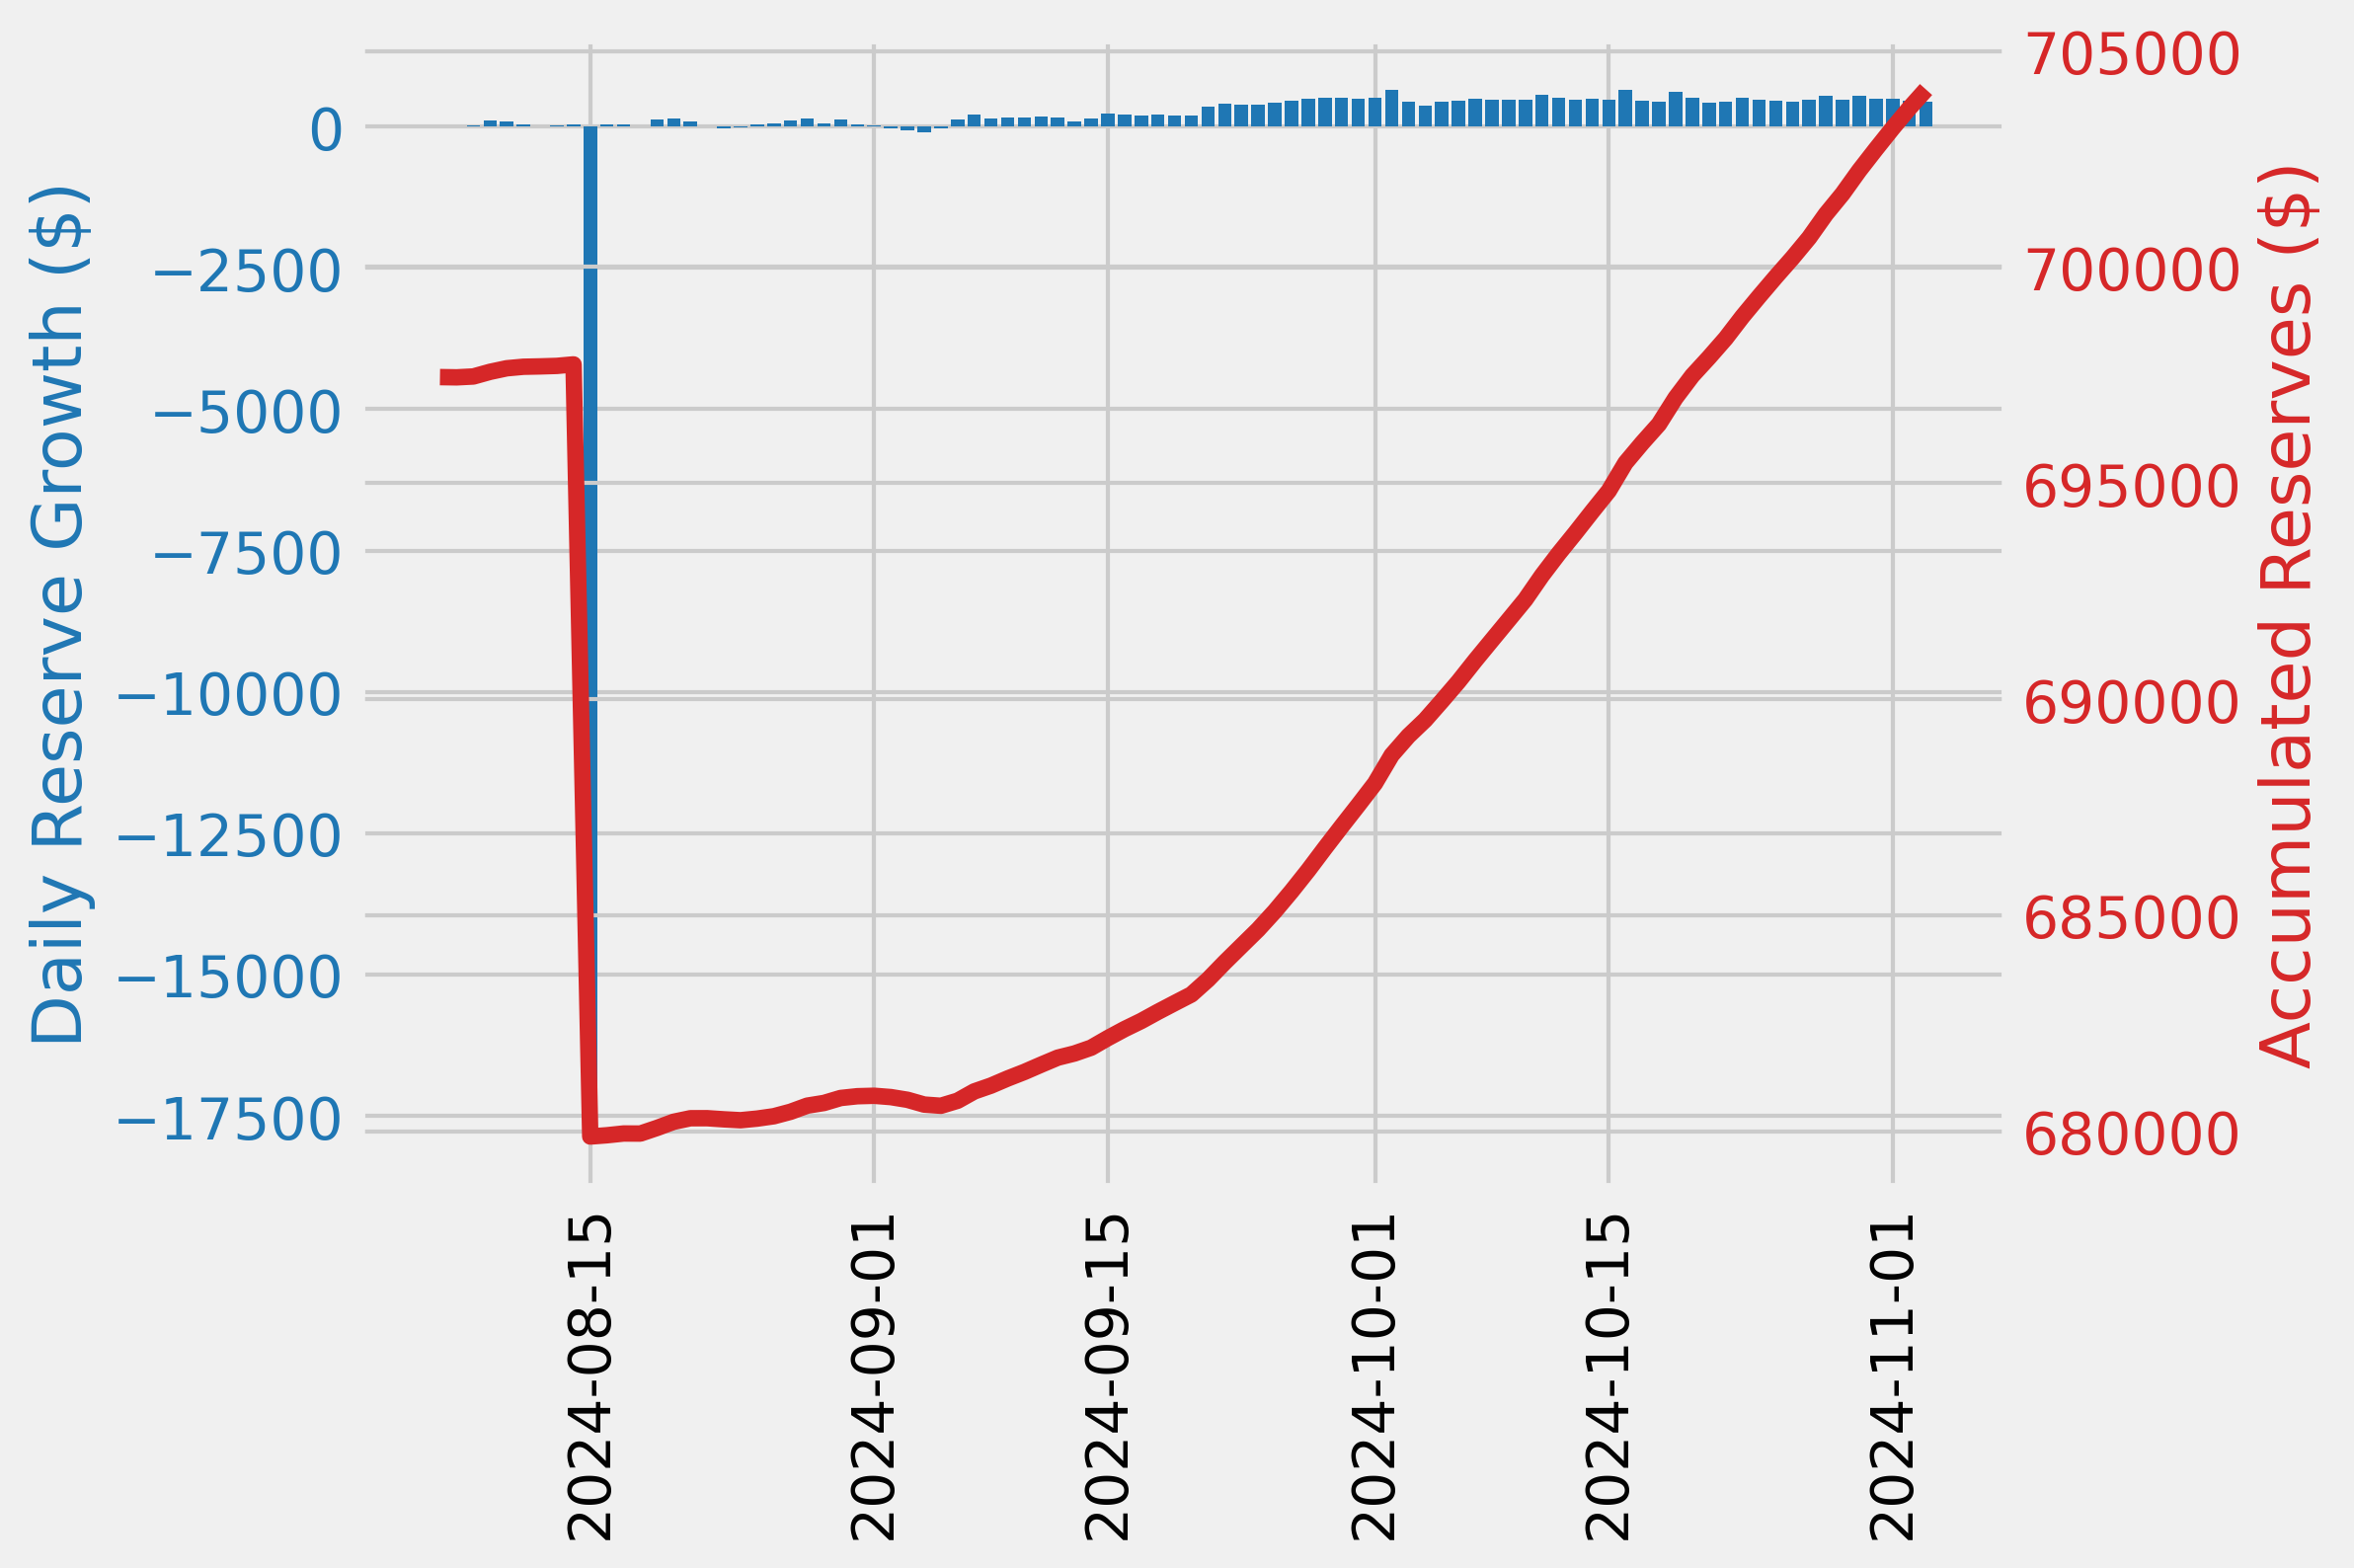
The minimum USDC.e reserve growth was 10.92%, and the maximum was 12.51%. The average USDC.e reserve growth was 12.10%.
-
The comet accumulated $98.52 USDC.e reserves while distributing $0.00 COMP rewards for a weekly Net Protocol Profit of $98.52.
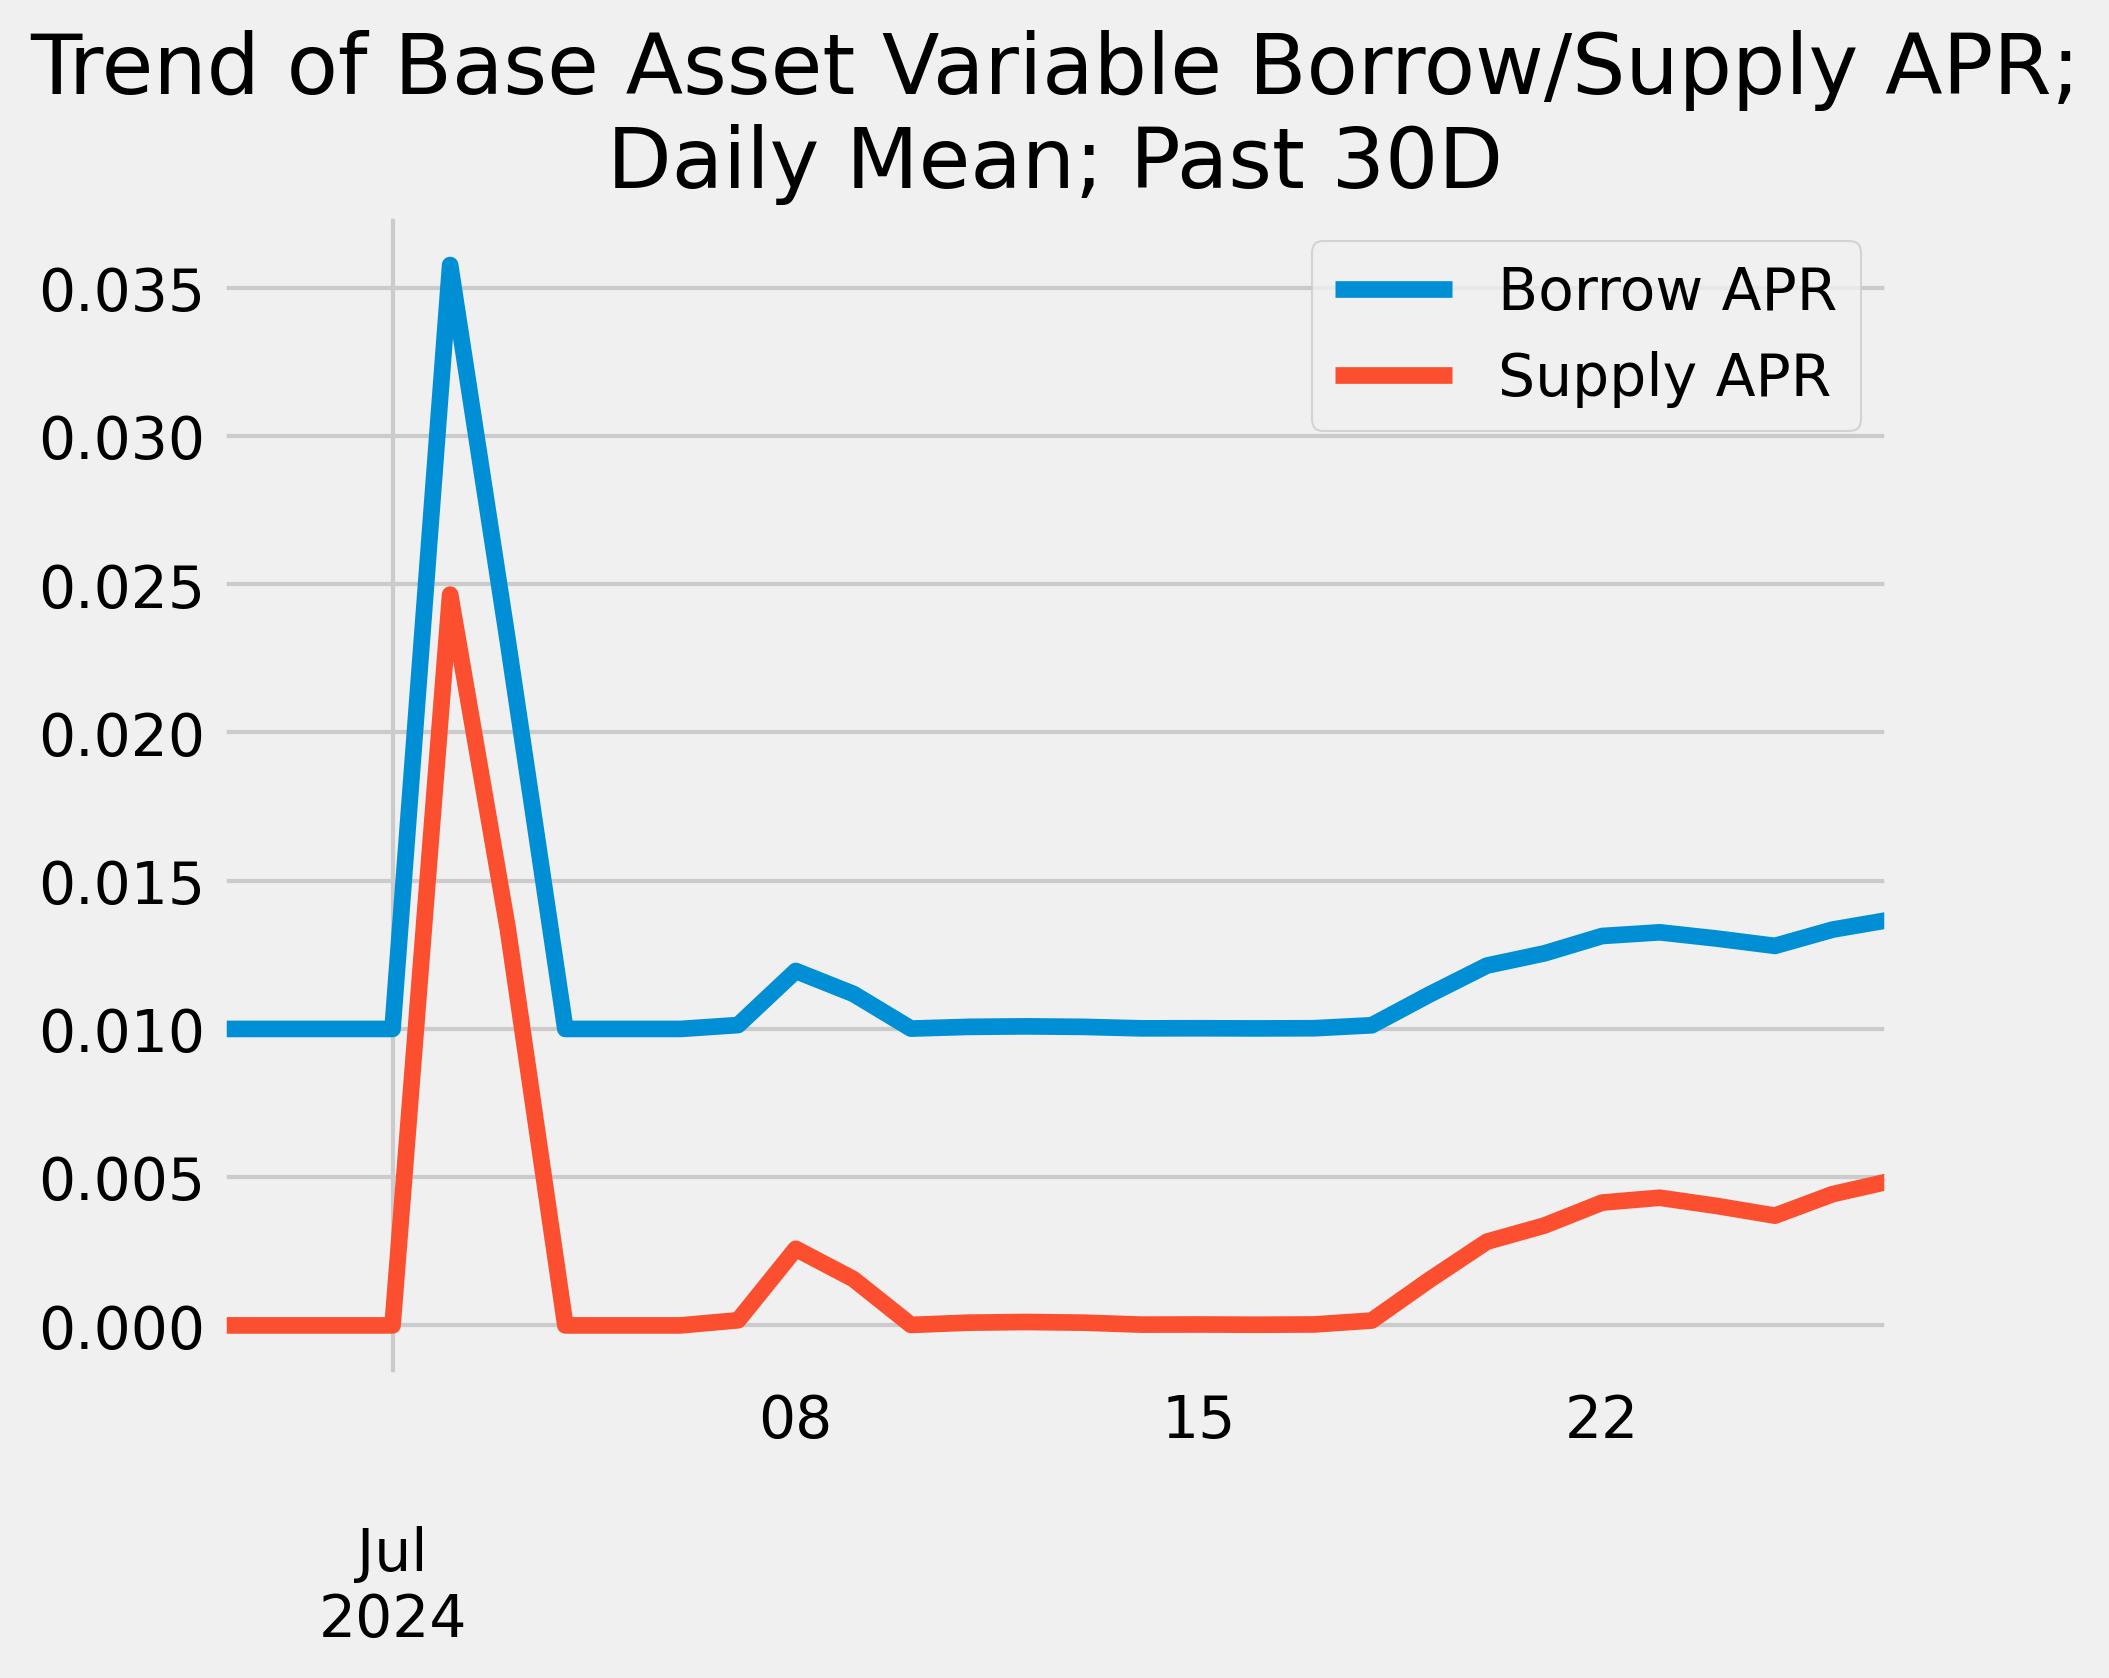
Base Asset APR Trend
Reserve Analysis
COMP Rewards Analysis
| Chain |
CometRewards COMP token holdings |
Daily aggregate COMP token reward distributions |
Remaining days of rewards runway (not including existing claimable rewards) |
| Arbitrum |
9.17K |
130.00 |
70.50 |
Collateral Asset Supply
This graph shows the total supply of all collateral assets over the past week.
To see updated statistics, please see the live version of this graph here.
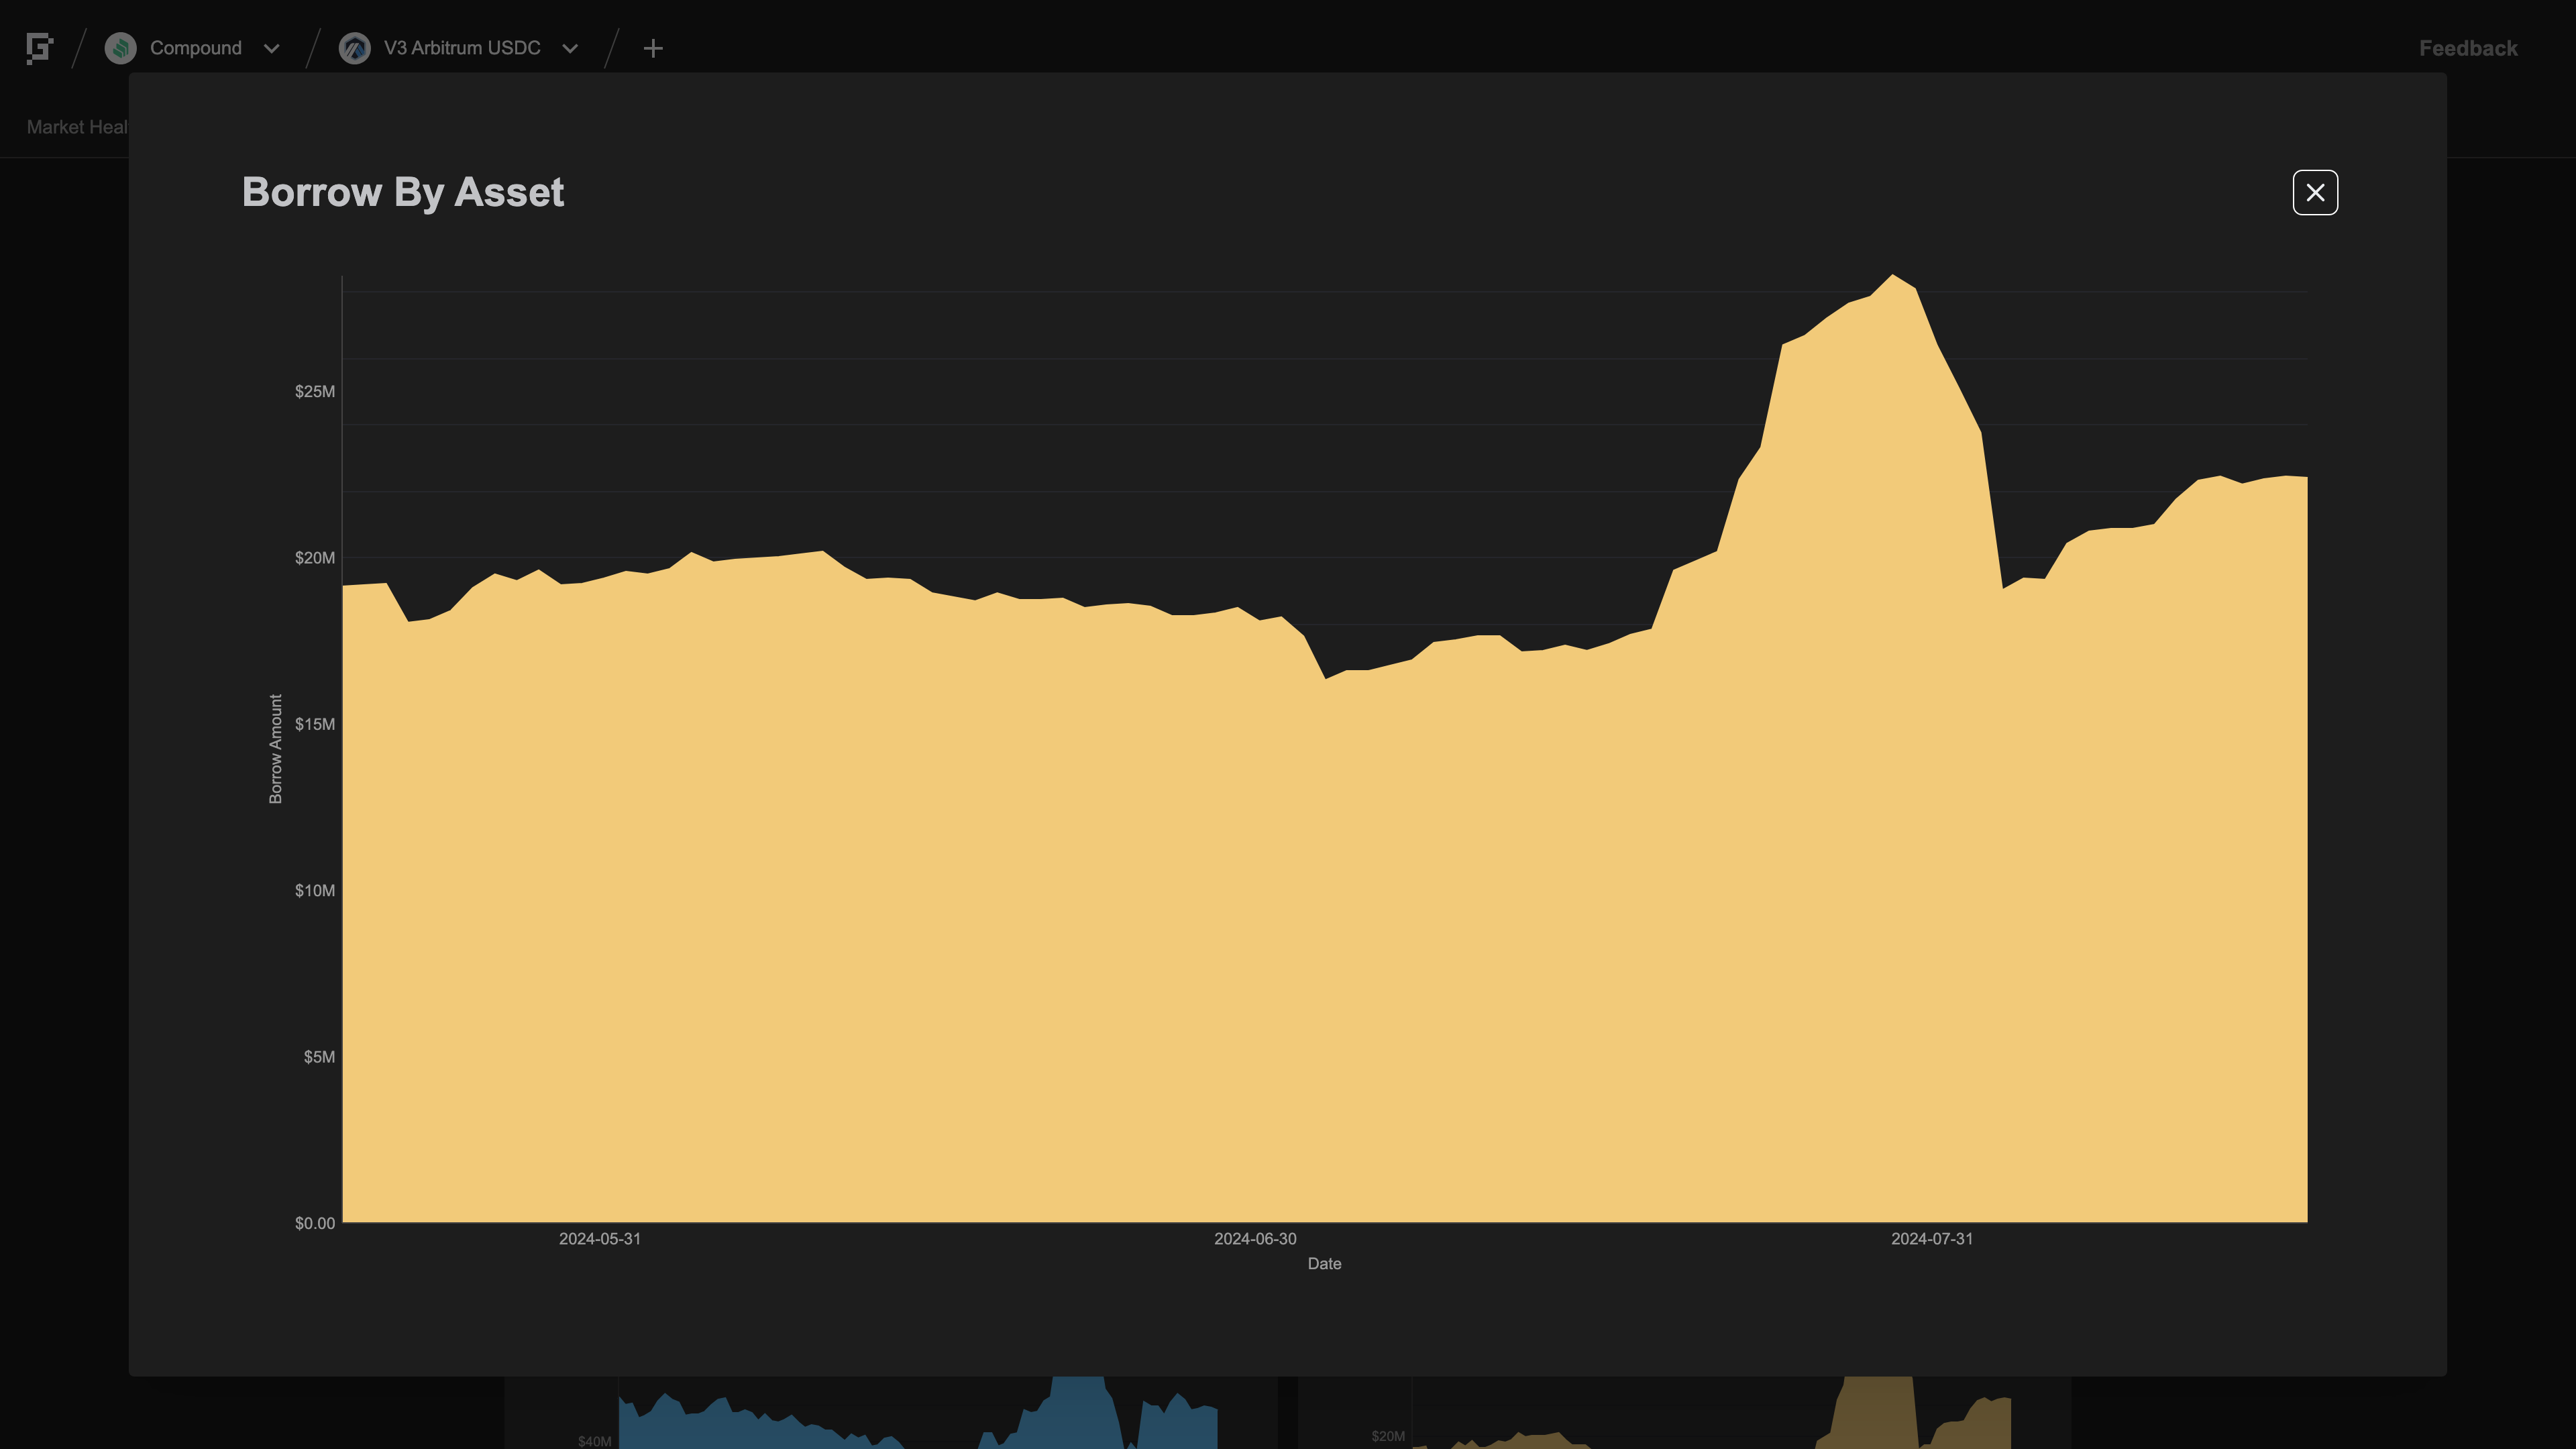
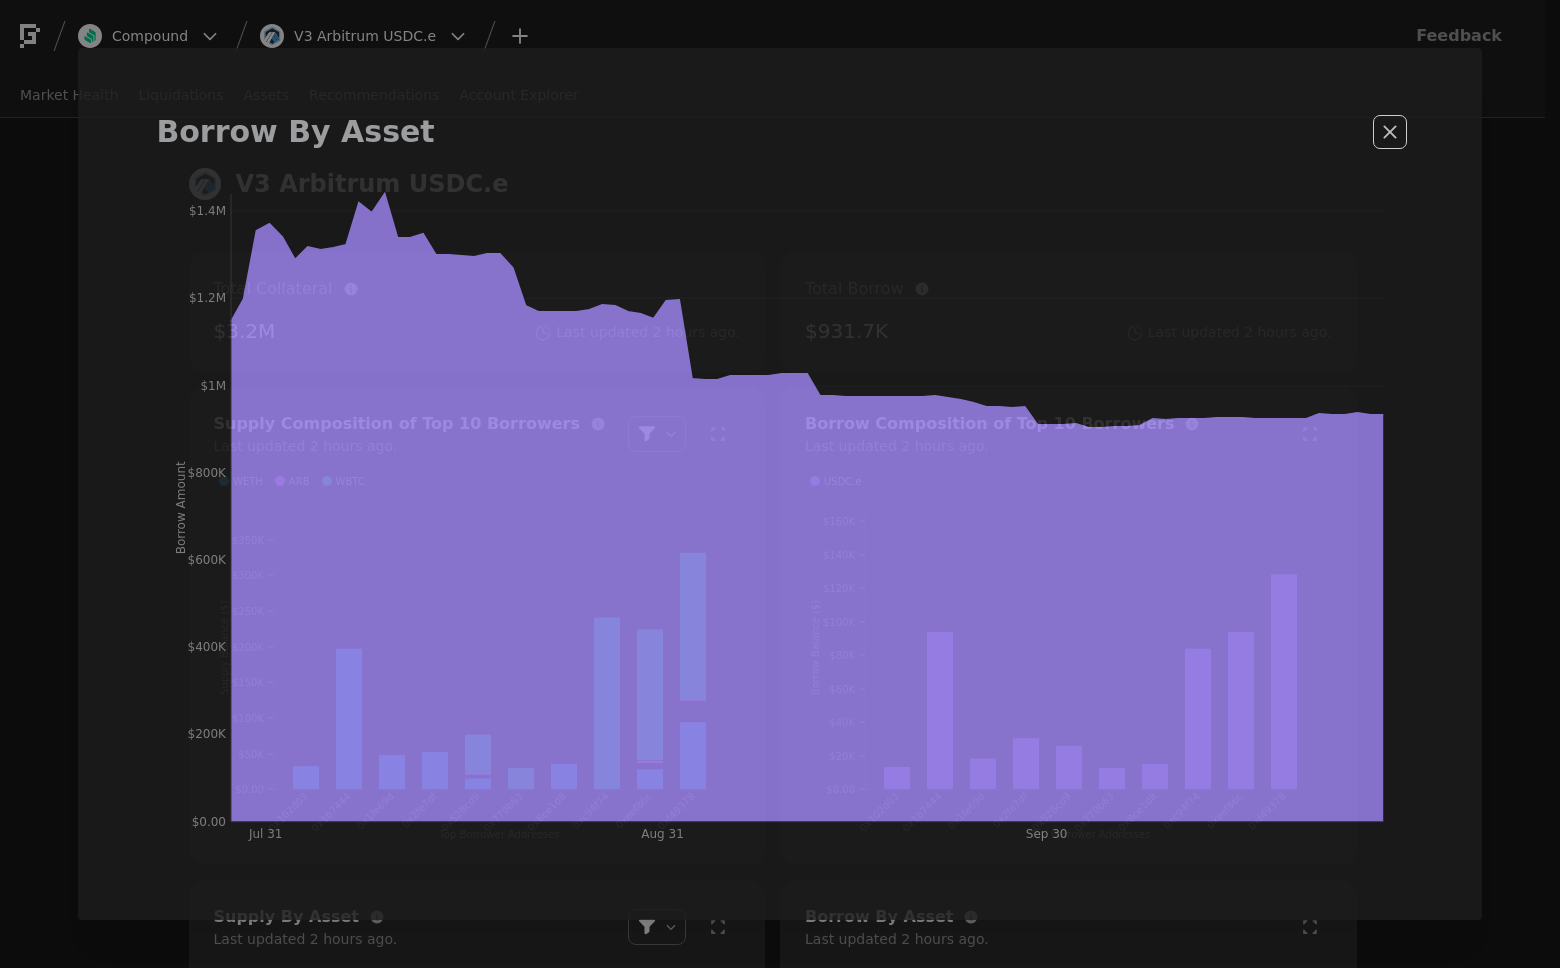
Base Asset Borrows
This graph shows the total borrows of the base asset over the past week.
To see updated statistics, please see the live version of this graph here.
Utilization
This graph shows the utilization (borrow / supply) of the base asset over the past week.
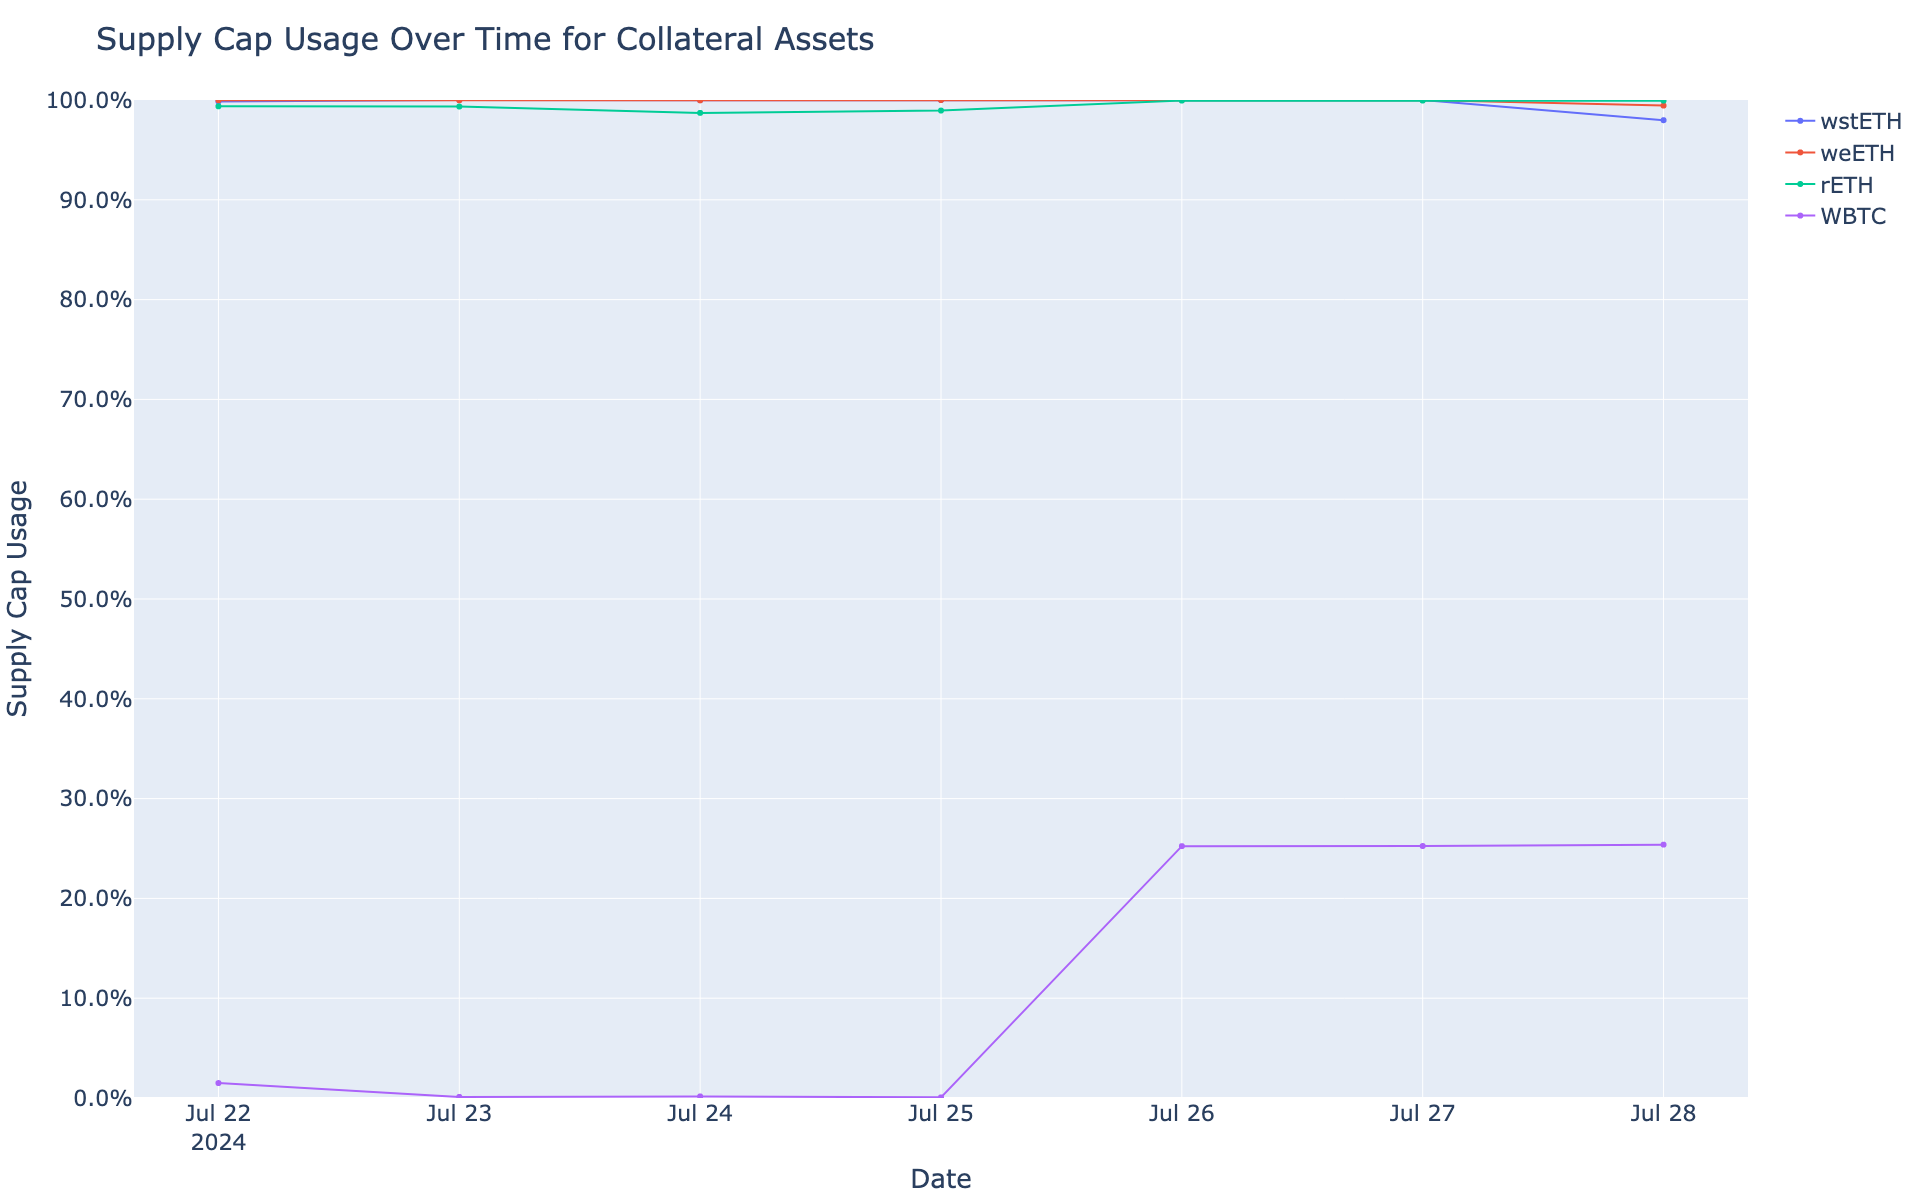
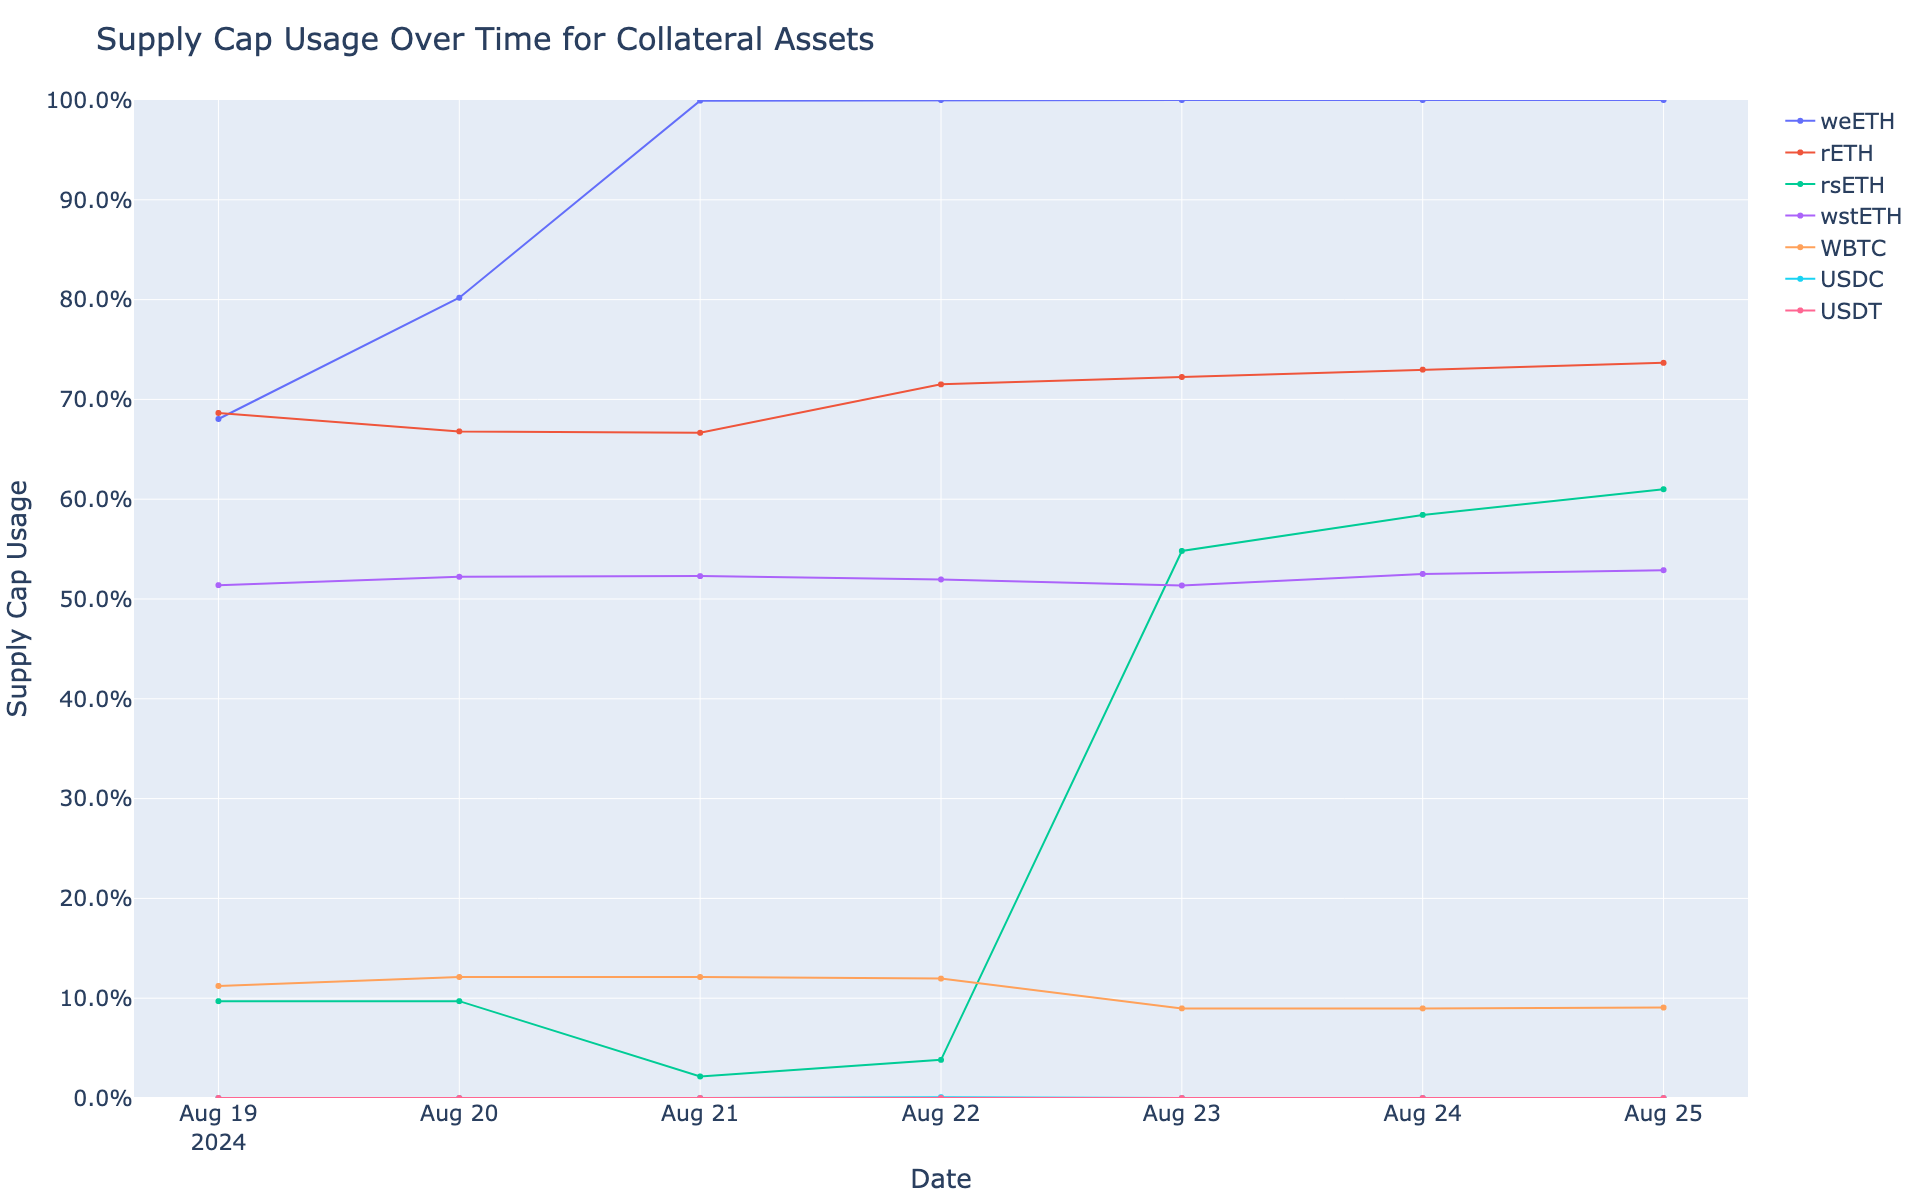
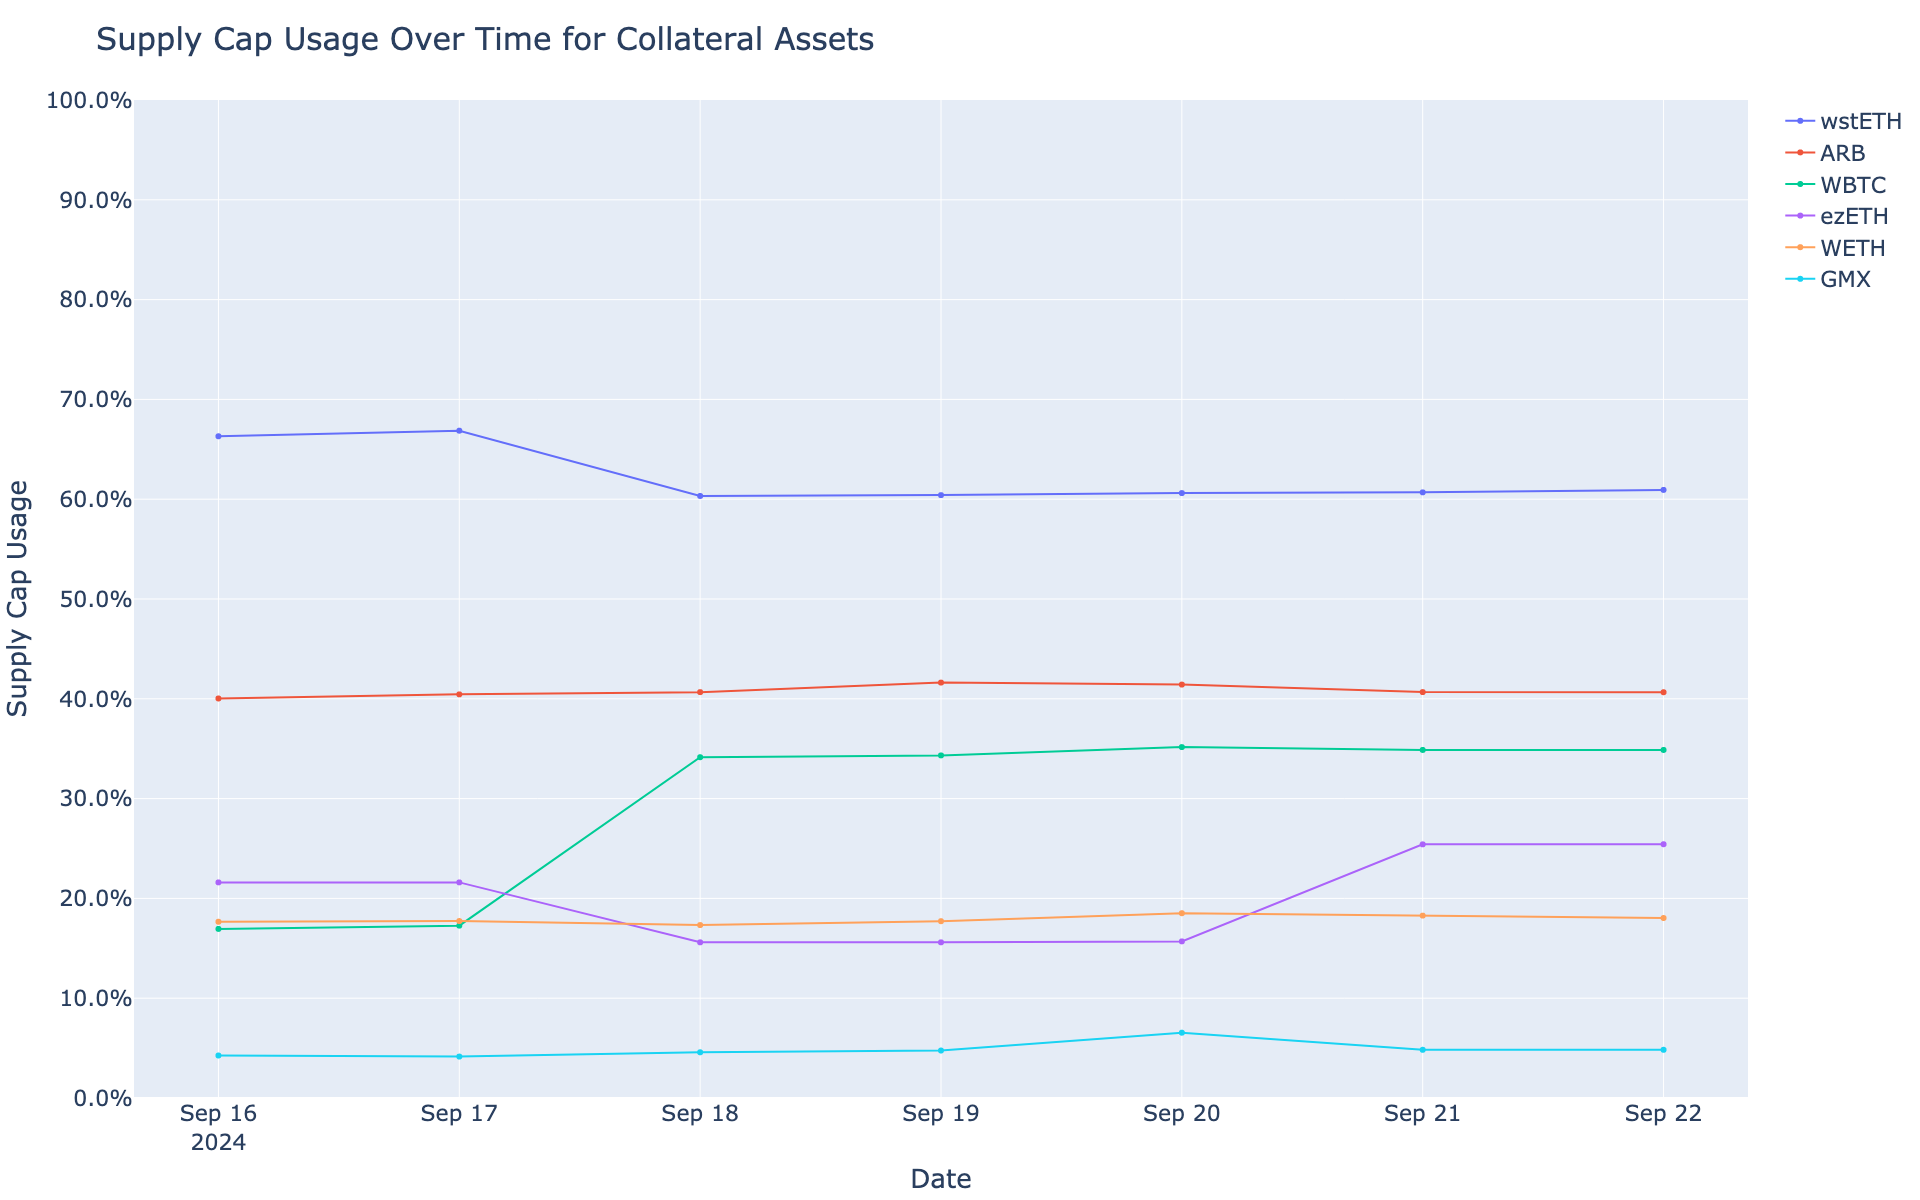
Supply Cap Usage
This graph shows the supply cap usage (supply / supply cap) of all collateral assets over the past week.
Arbitrum USDC Comet
Gauntlet would like to provide the community with an update on the Arbitrum USDC comet over the past week.
Simple Summary
-
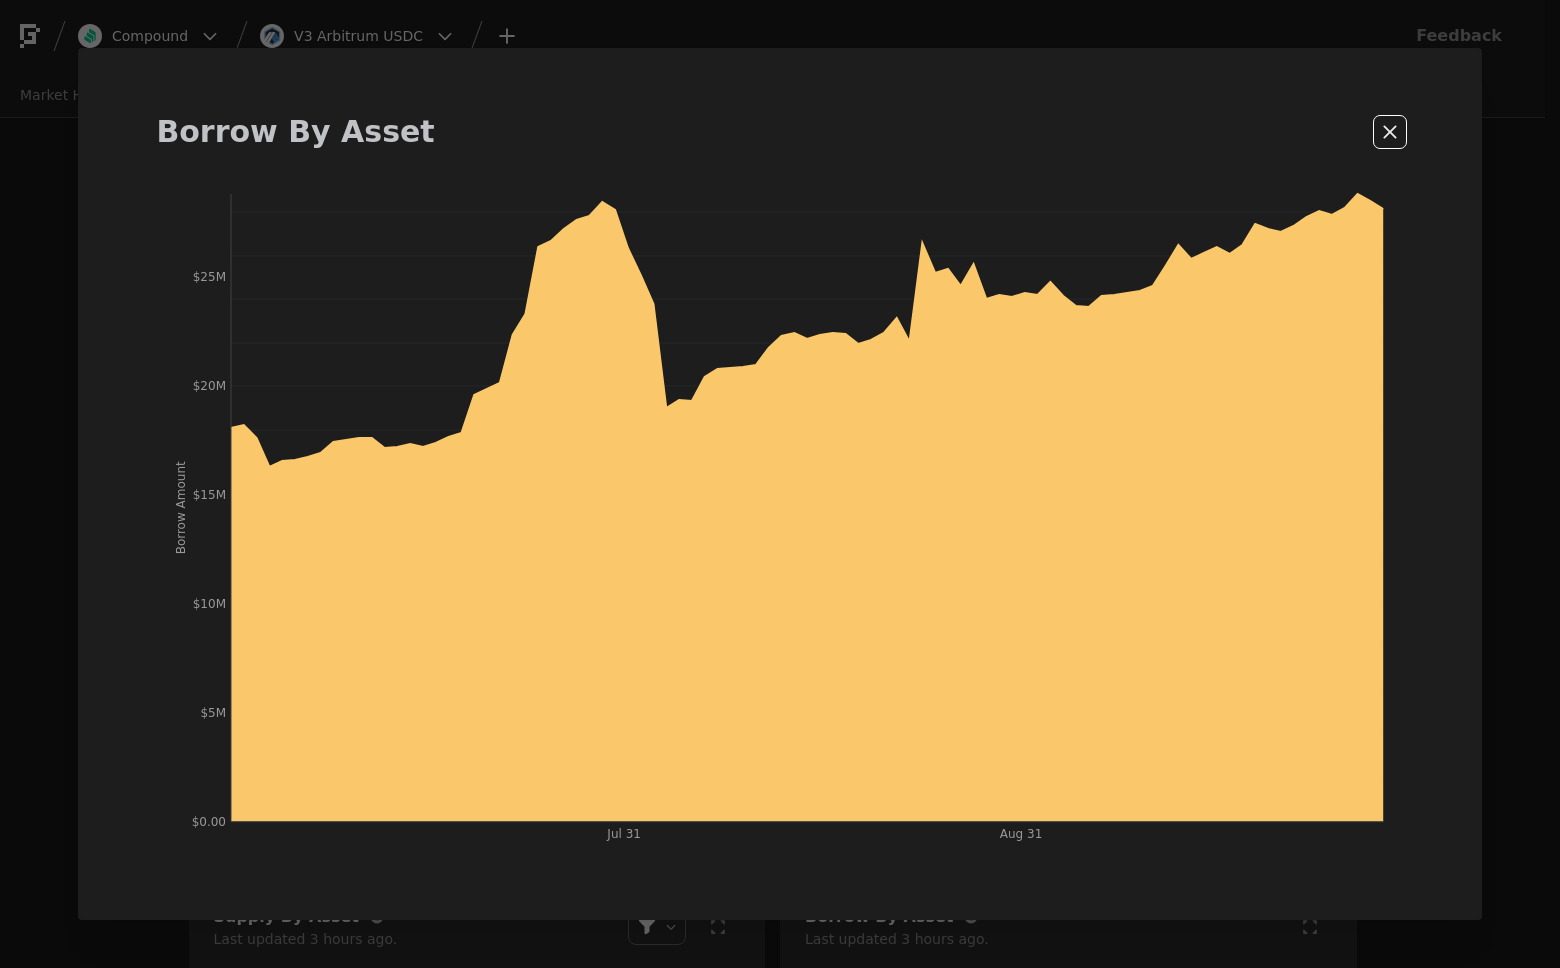
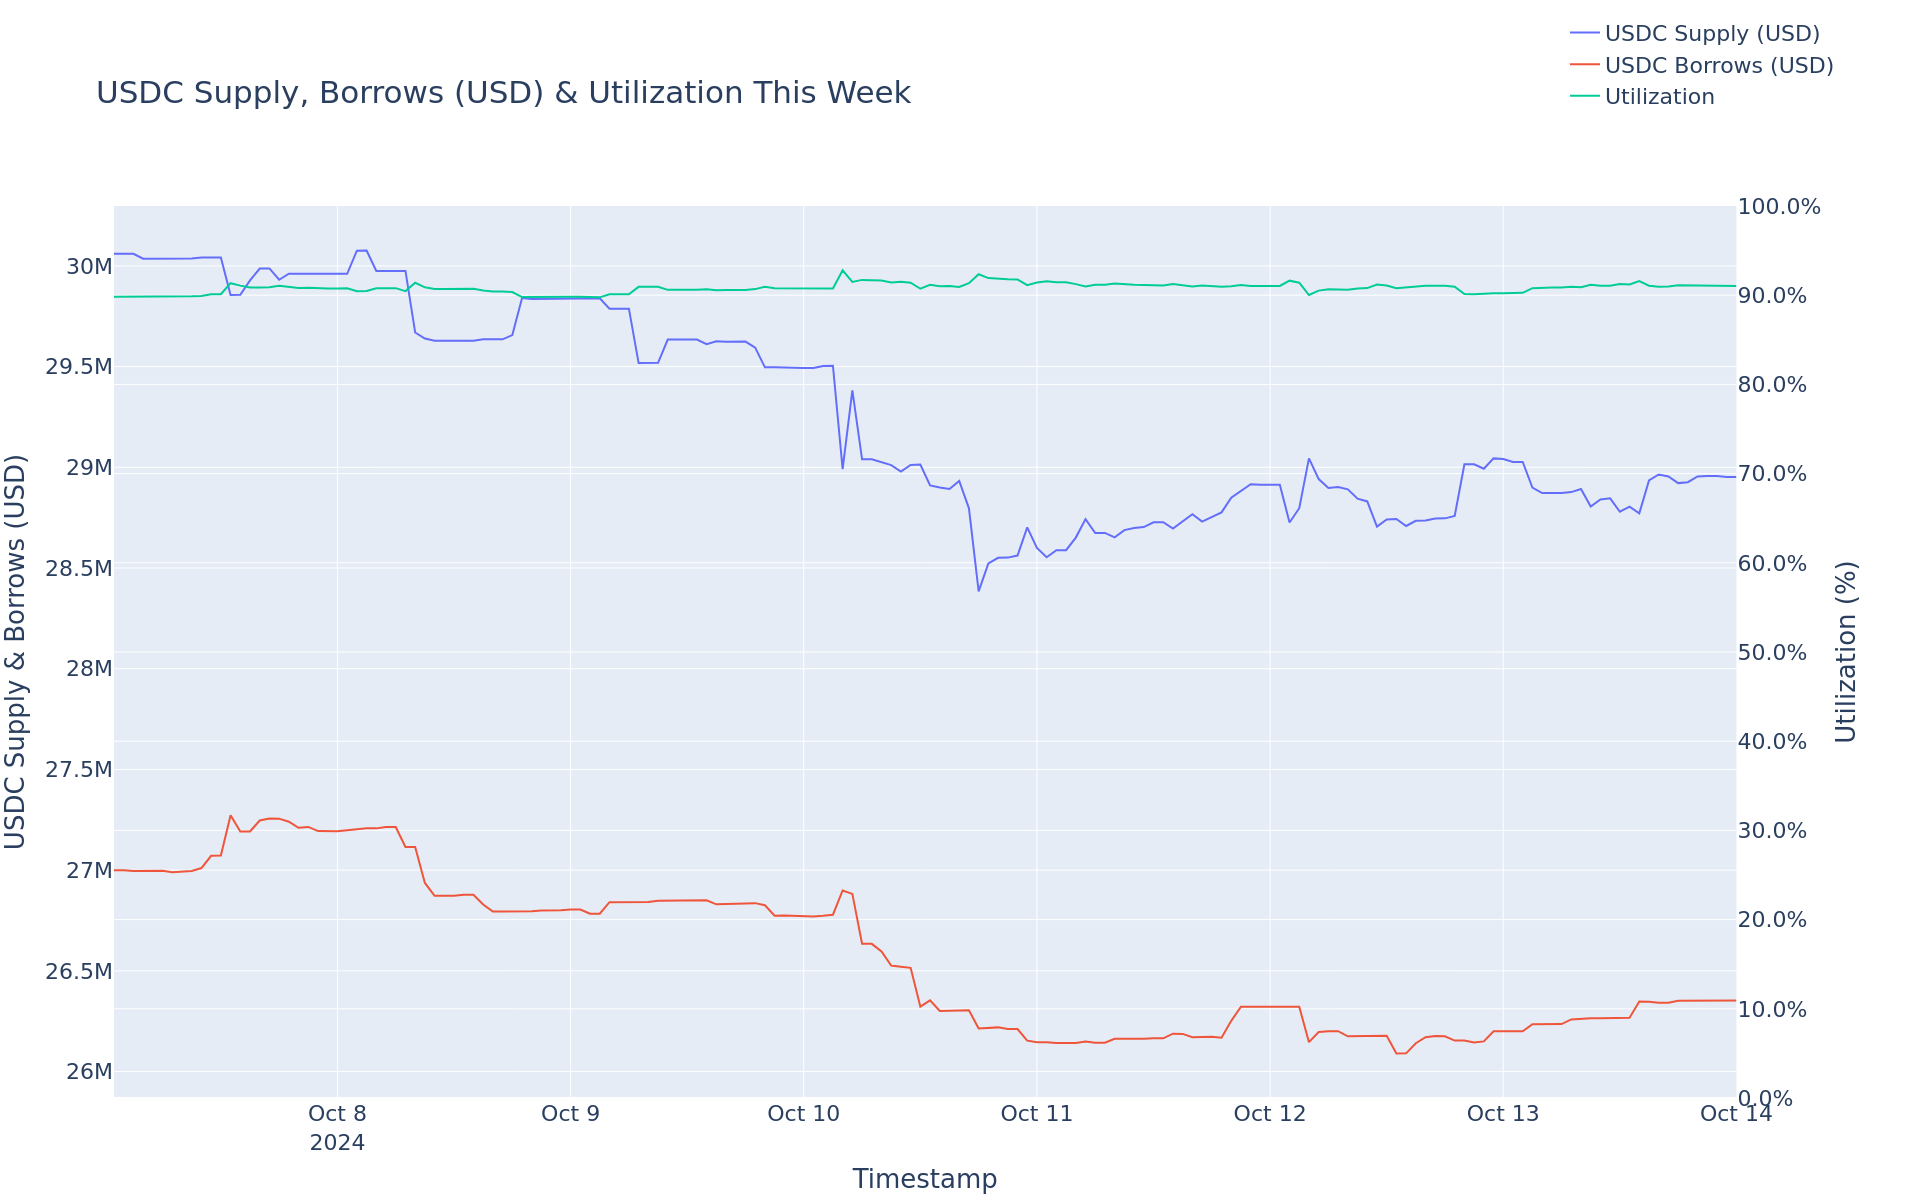
USDC Borrows increased 5.17%, from $27.10M to $28.50M.
-
USDC Supply increased 1.23%, from $31.12M to $31.50M.
-
USDC utilization increased 3.89%, from 87.08% to 90.47%.
-
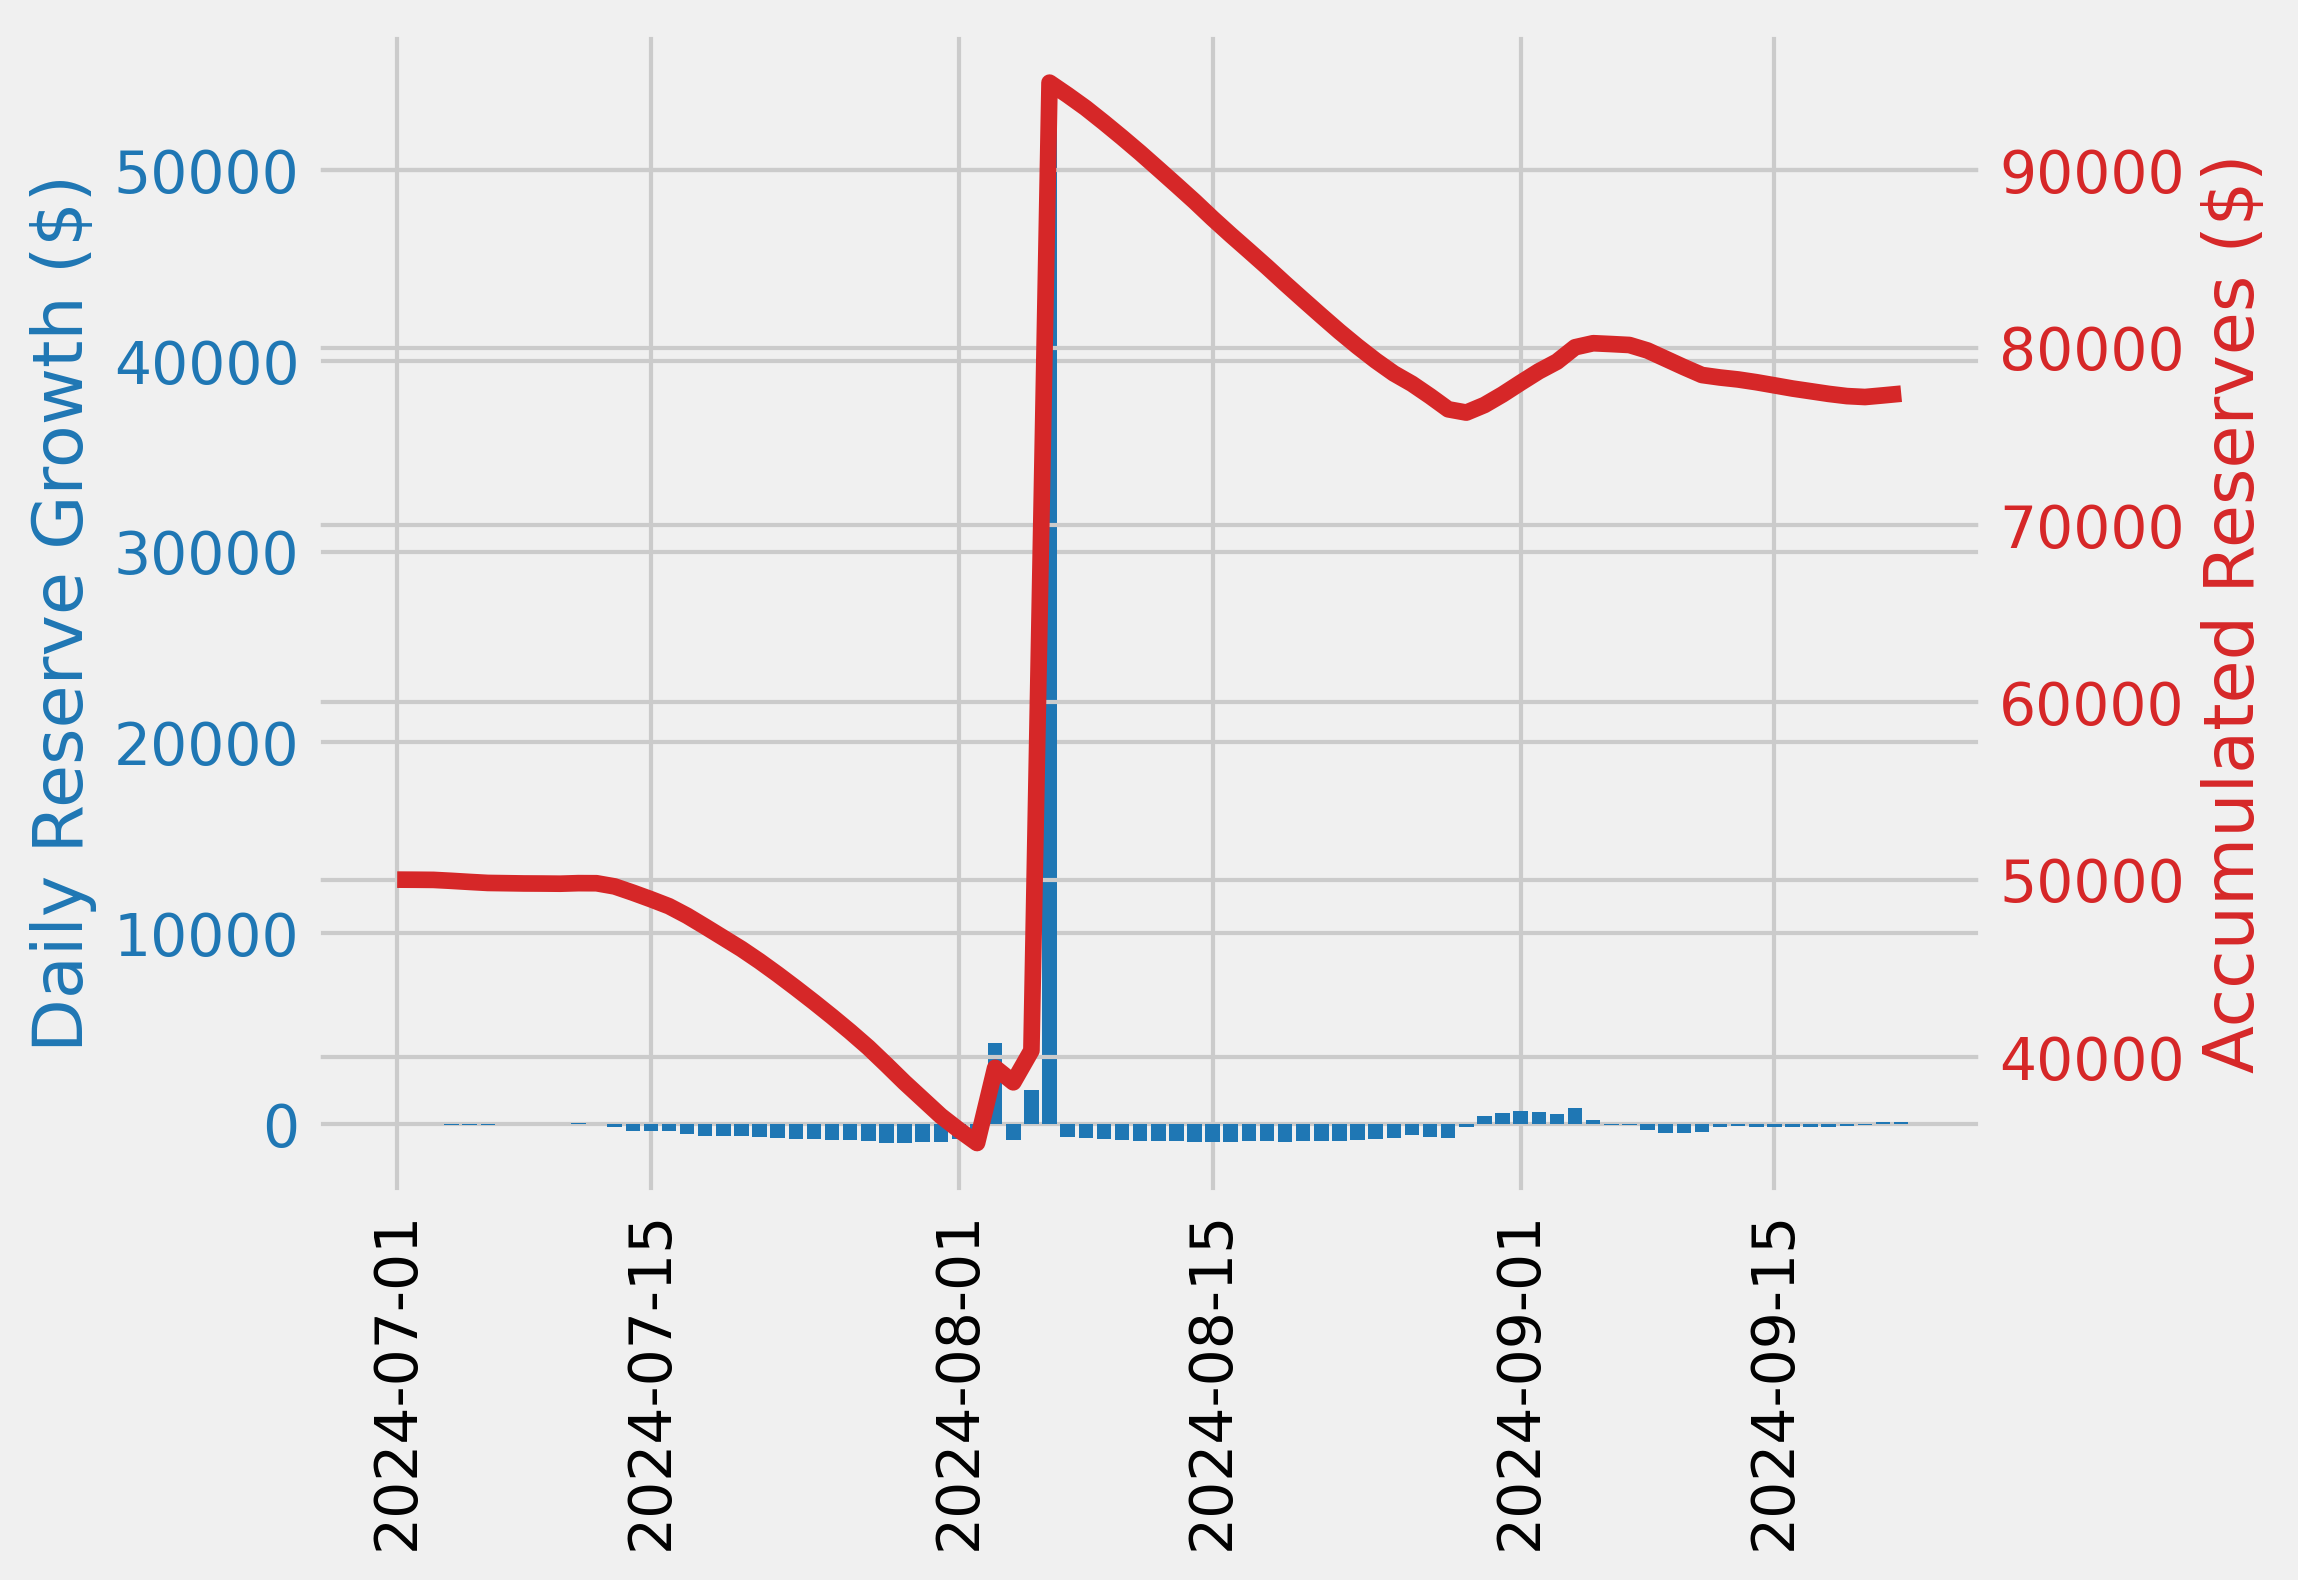
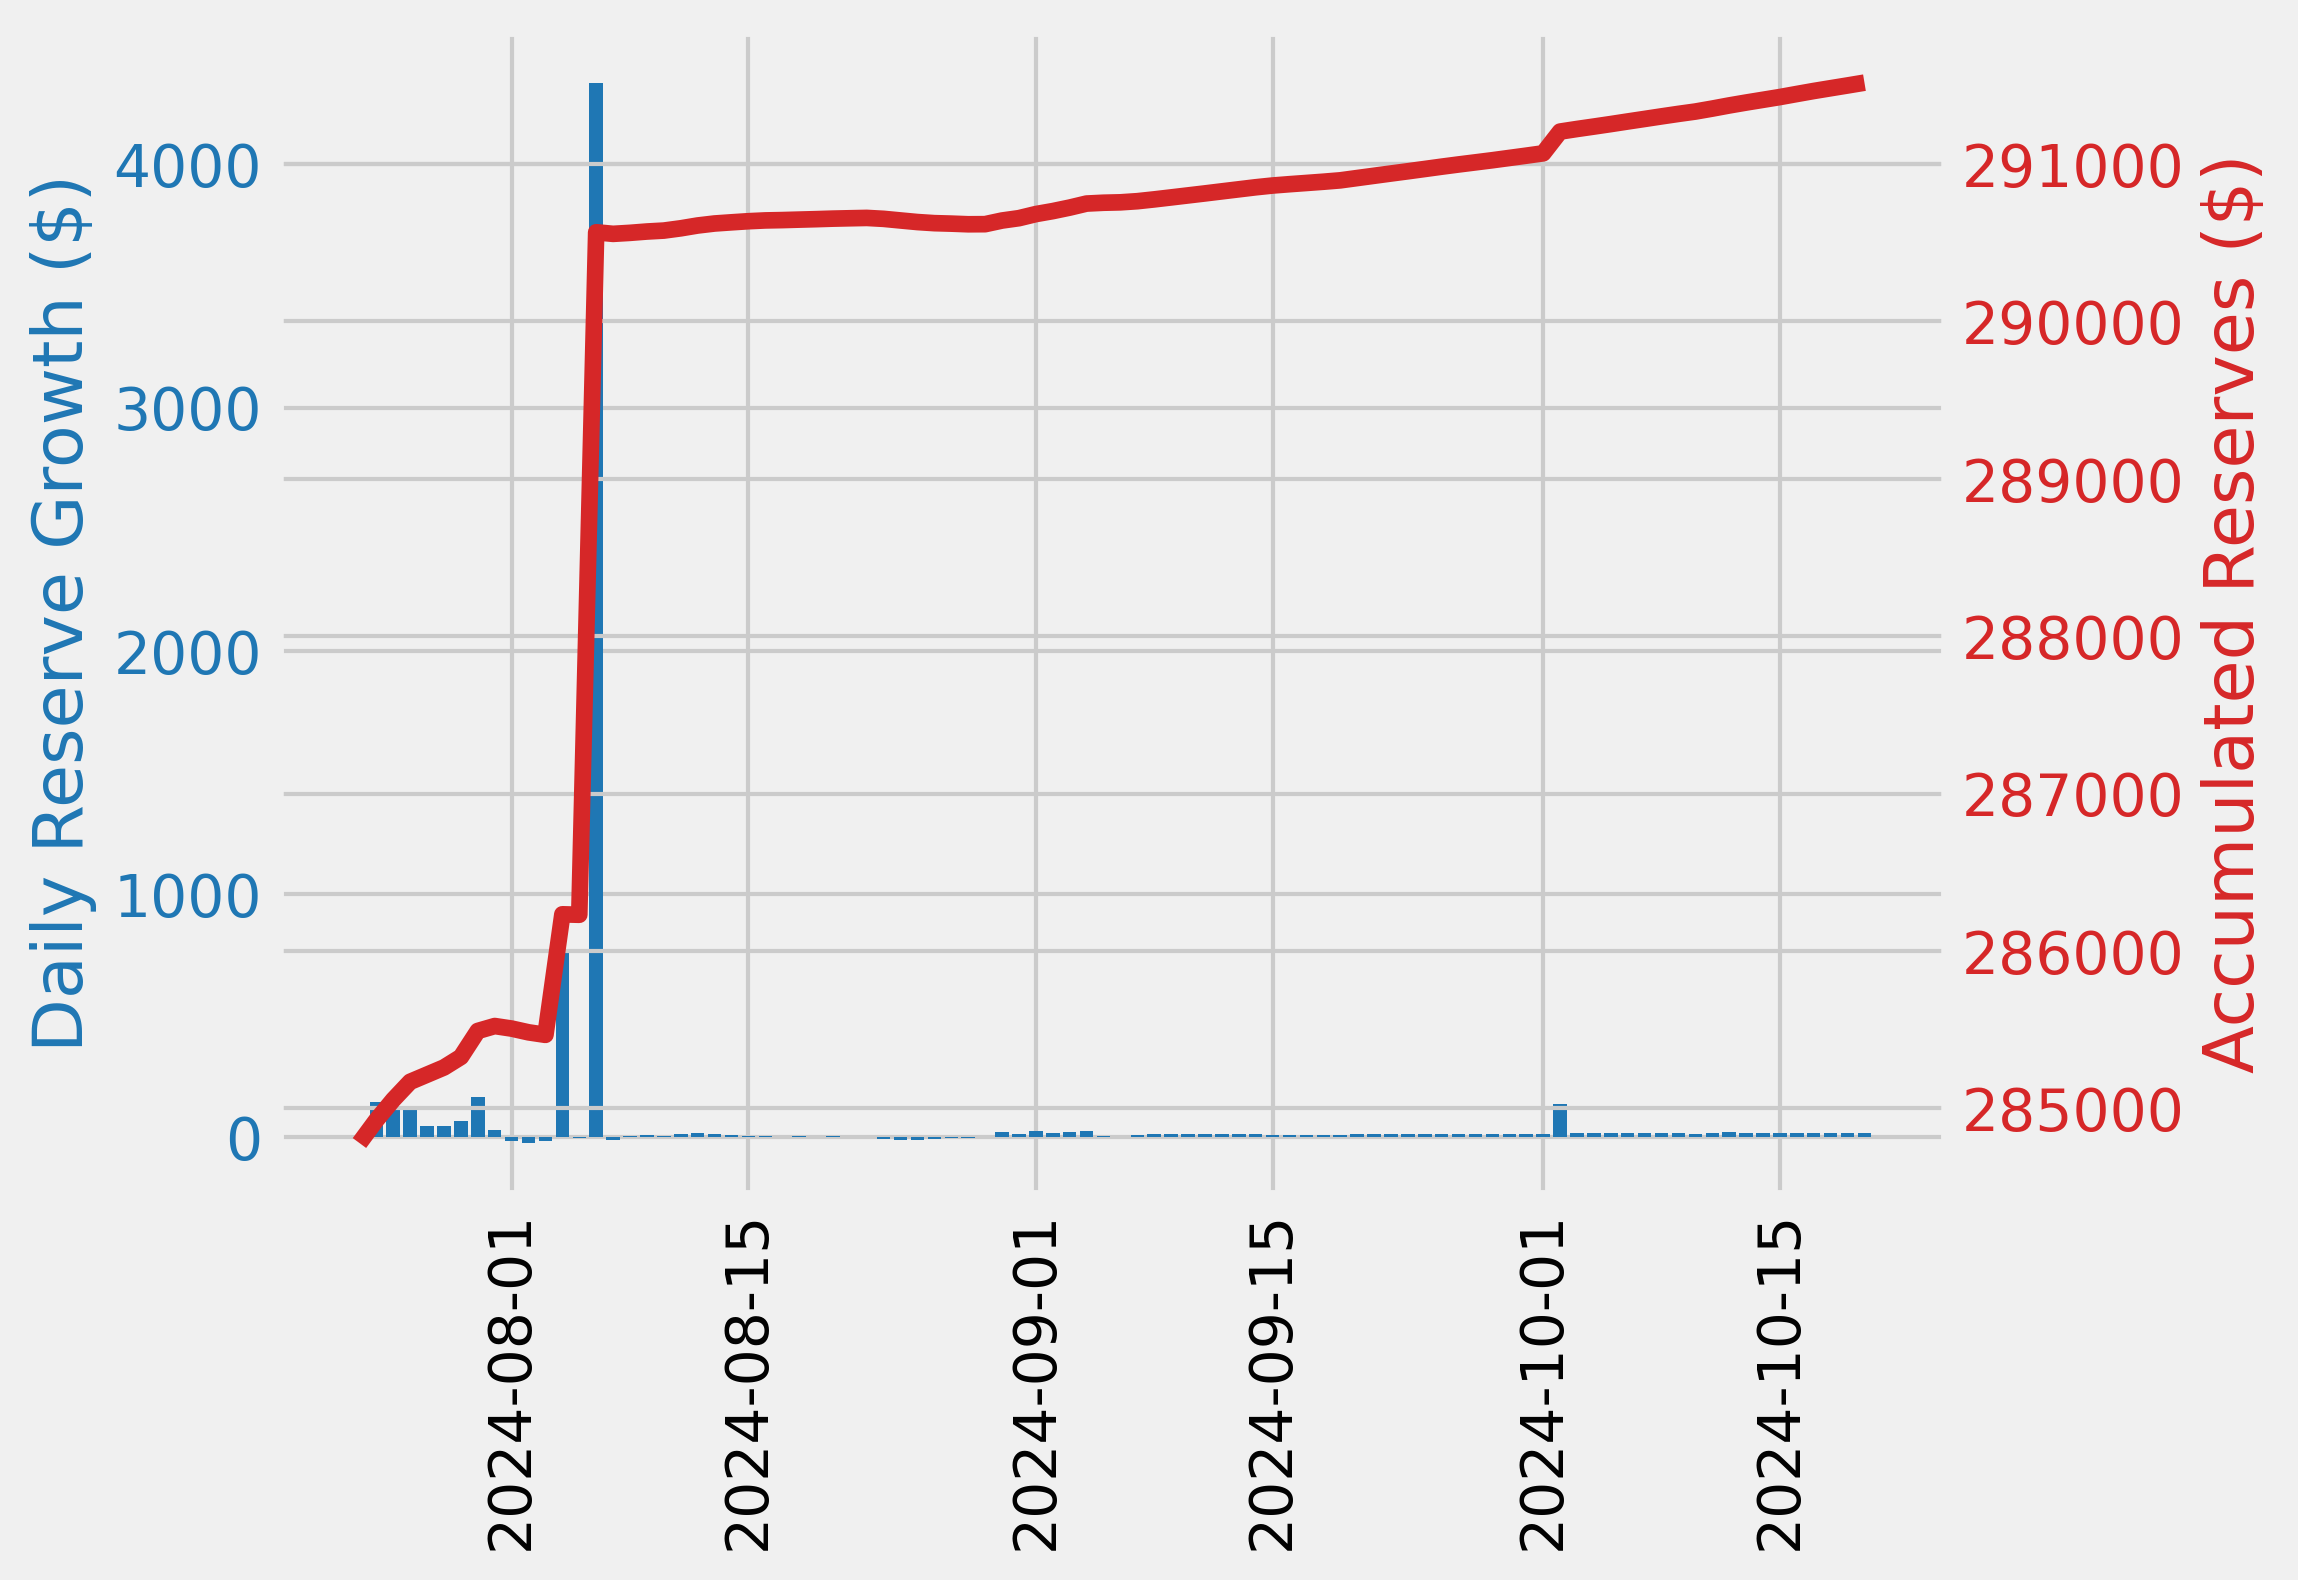
The minimum USDC reserve growth was 7.25%, and the maximum was 13.27%. The average USDC reserve growth was 10.74%.
-
The comet accumulated $3.23K USDC reserves while distributing 22.92K COMP rewards for a weekly Net Protocol Profit of -19.69K.
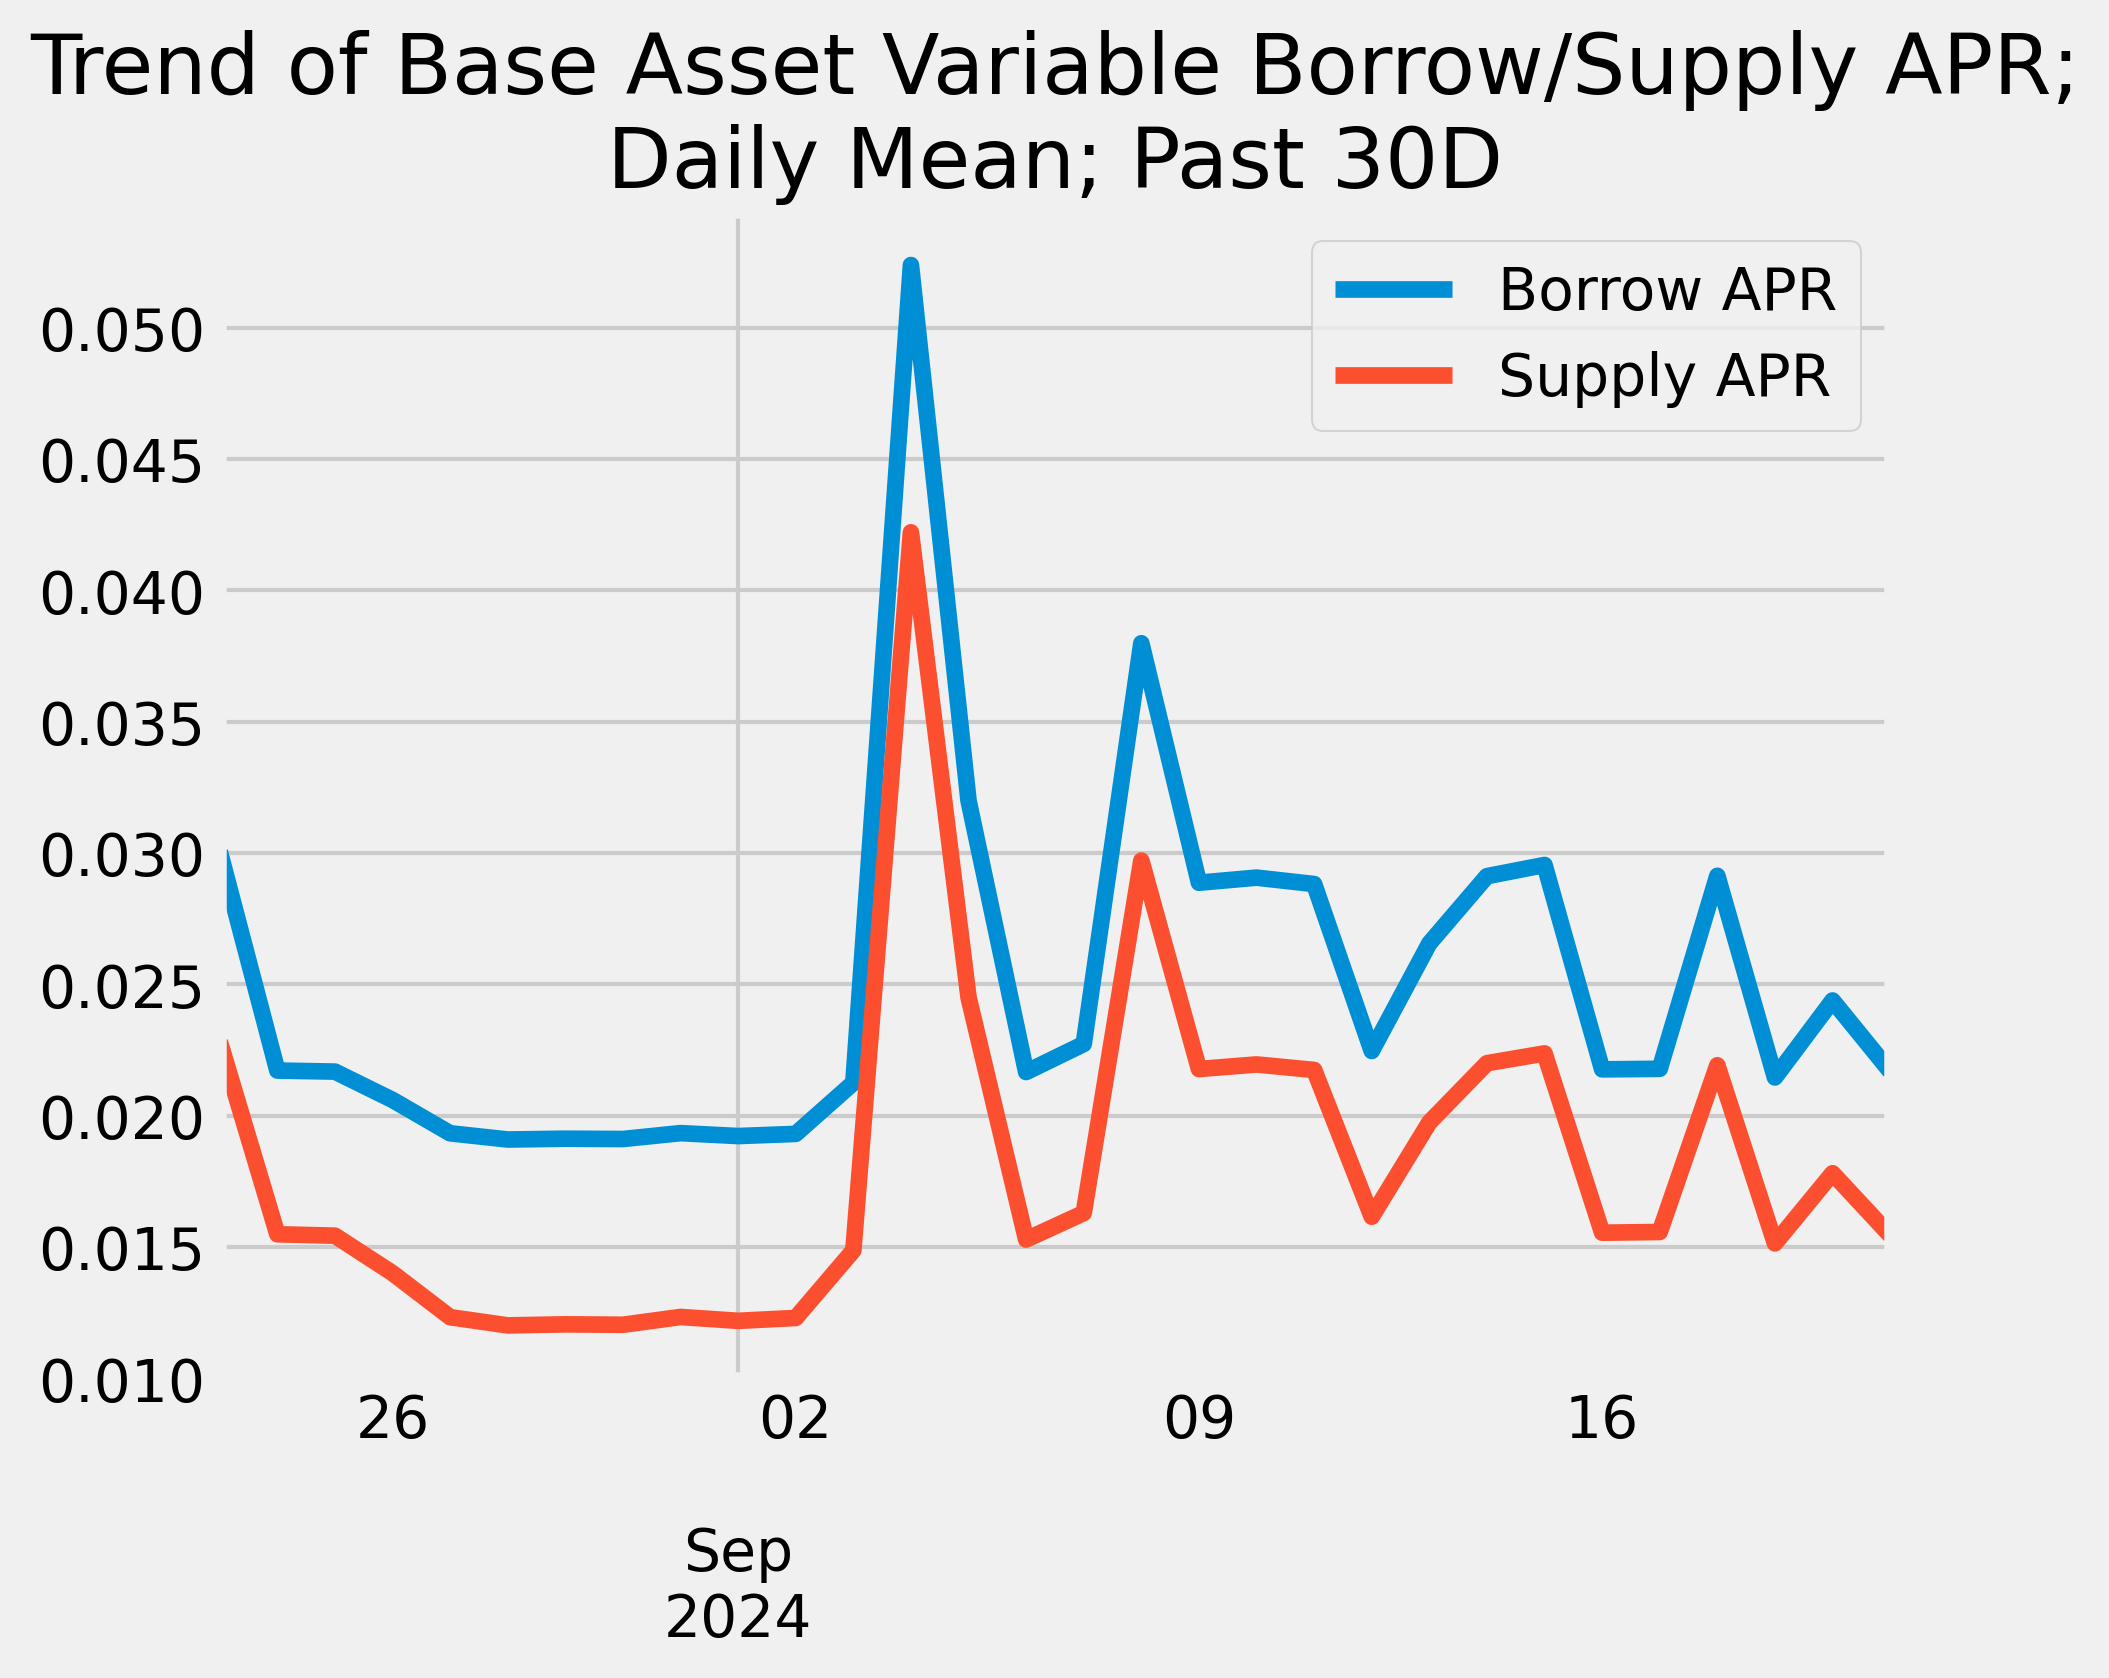
Base Asset APR Trend
Reserve Analysis
COMP Rewards Analysis
| Chain |
CometRewards COMP token holdings |
Daily aggregate COMP token reward distributions |
Remaining days of rewards runway (not including existing claimable rewards) |
| Arbitrum |
9.17K |
130.00 |
70.50 |
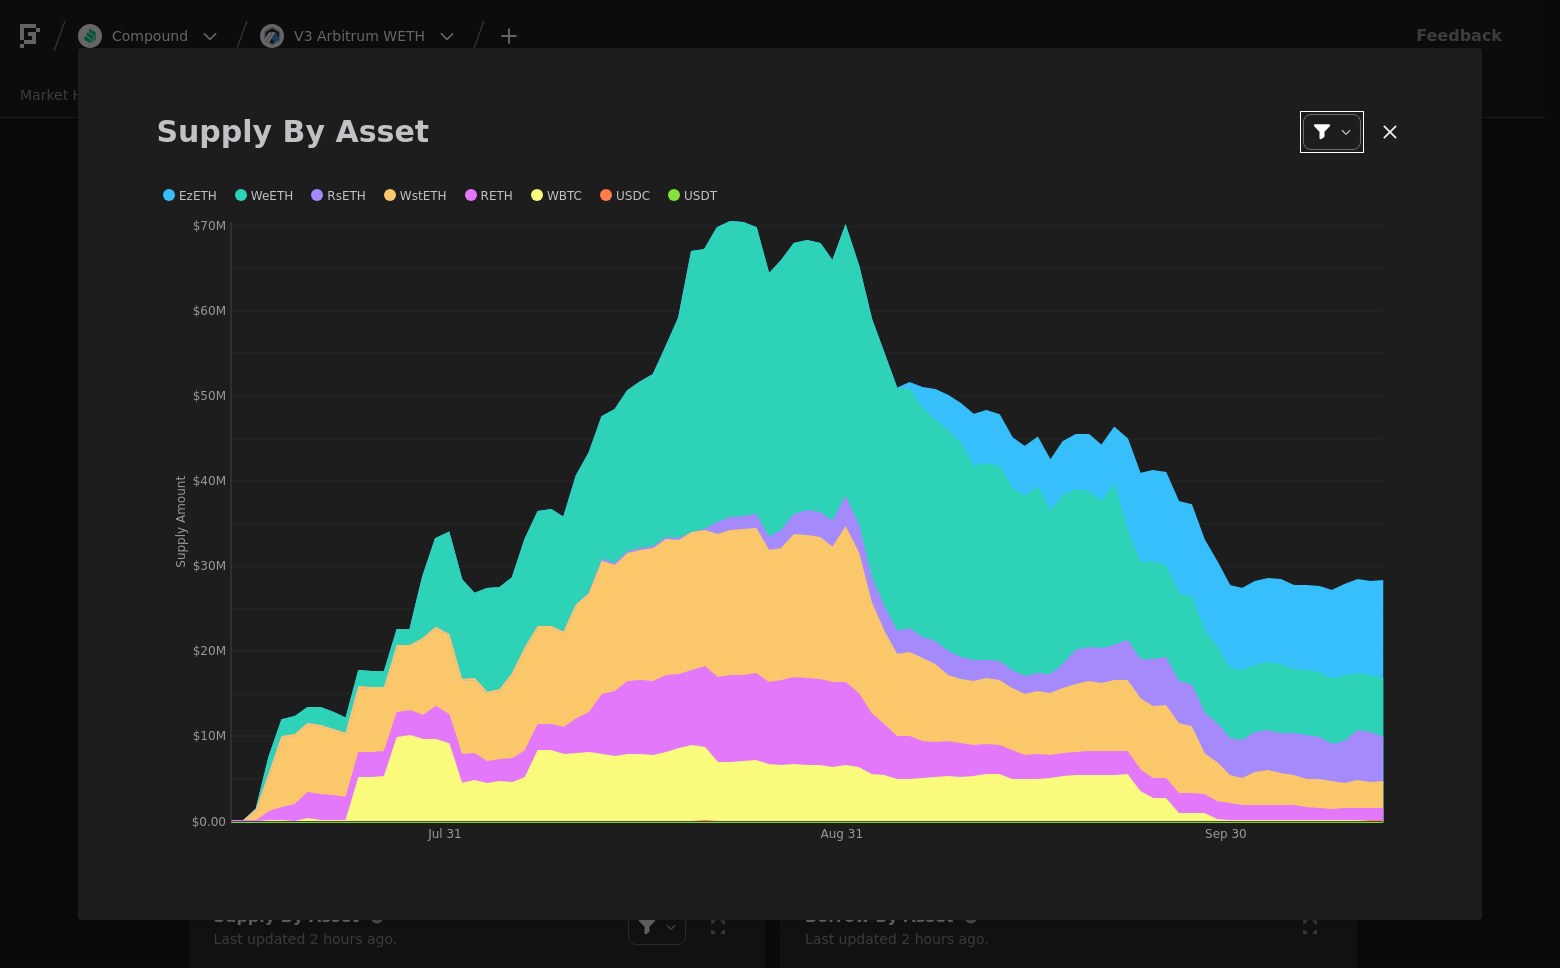
Collateral Asset Supply
This graph shows the total supply of all collateral assets over the past week.
To see updated statistics, please see the live version of this graph here.
Base Asset Borrows
This graph shows the total borrows of the base asset over the past week.
To see updated statistics, please see the live version of this graph here.
Utilization
This graph shows the utilization (borrow / supply) of the base asset over the past week.
Supply Cap Usage
This graph shows the supply cap usage (supply / supply cap) of all collateral assets over the past week.
Arbitrum WETH Comet
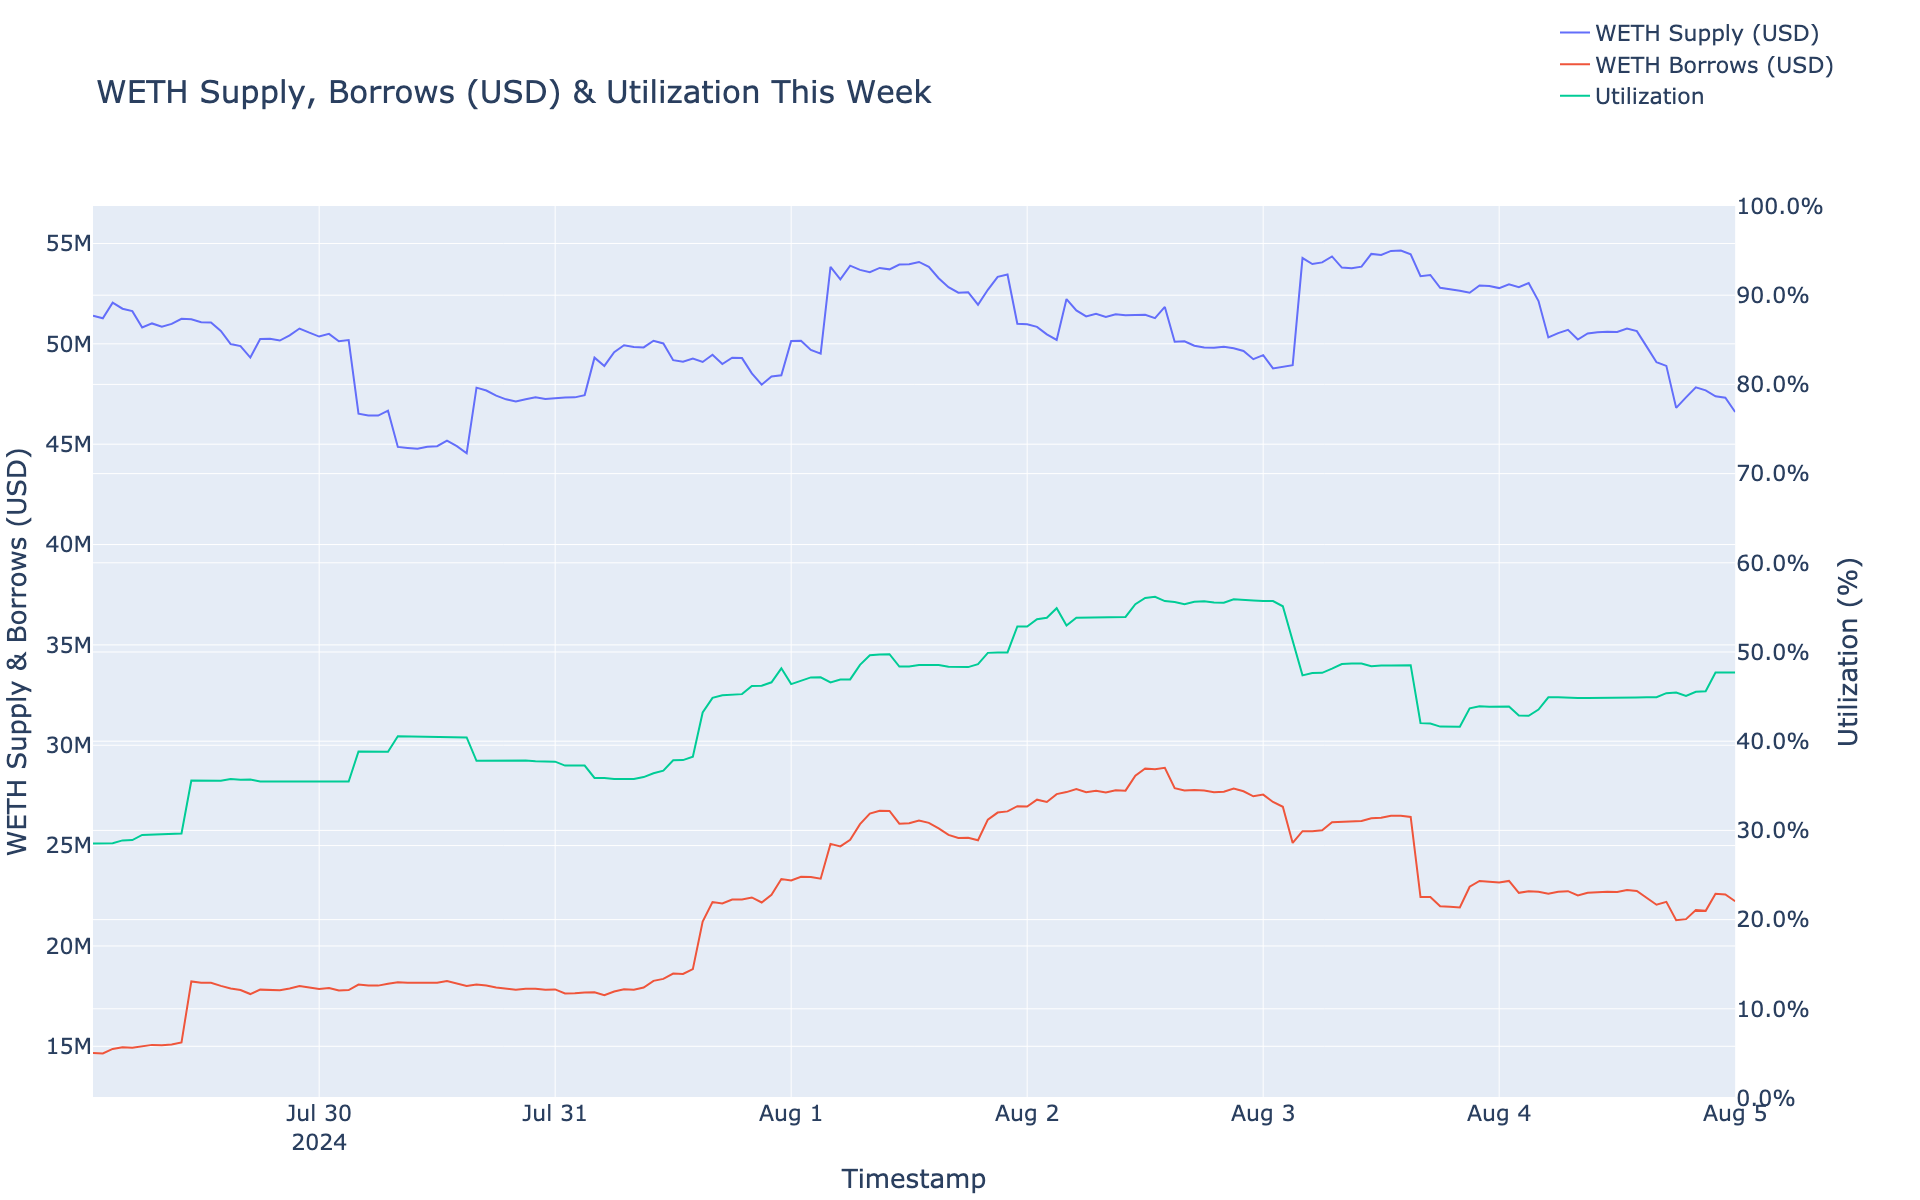
Gauntlet would like to provide the community with an update on the Arbitrum WETH comet over the past week.
Simple Summary
-
WETH Borrows decreased 15.45%, from $37.60M to $31.80M.
-
WETH Supply decreased 26.06%, from $45.25M to $33.46M.
-
WETH utilization increased 14.35%, from 83.11% to 95.04%.
-
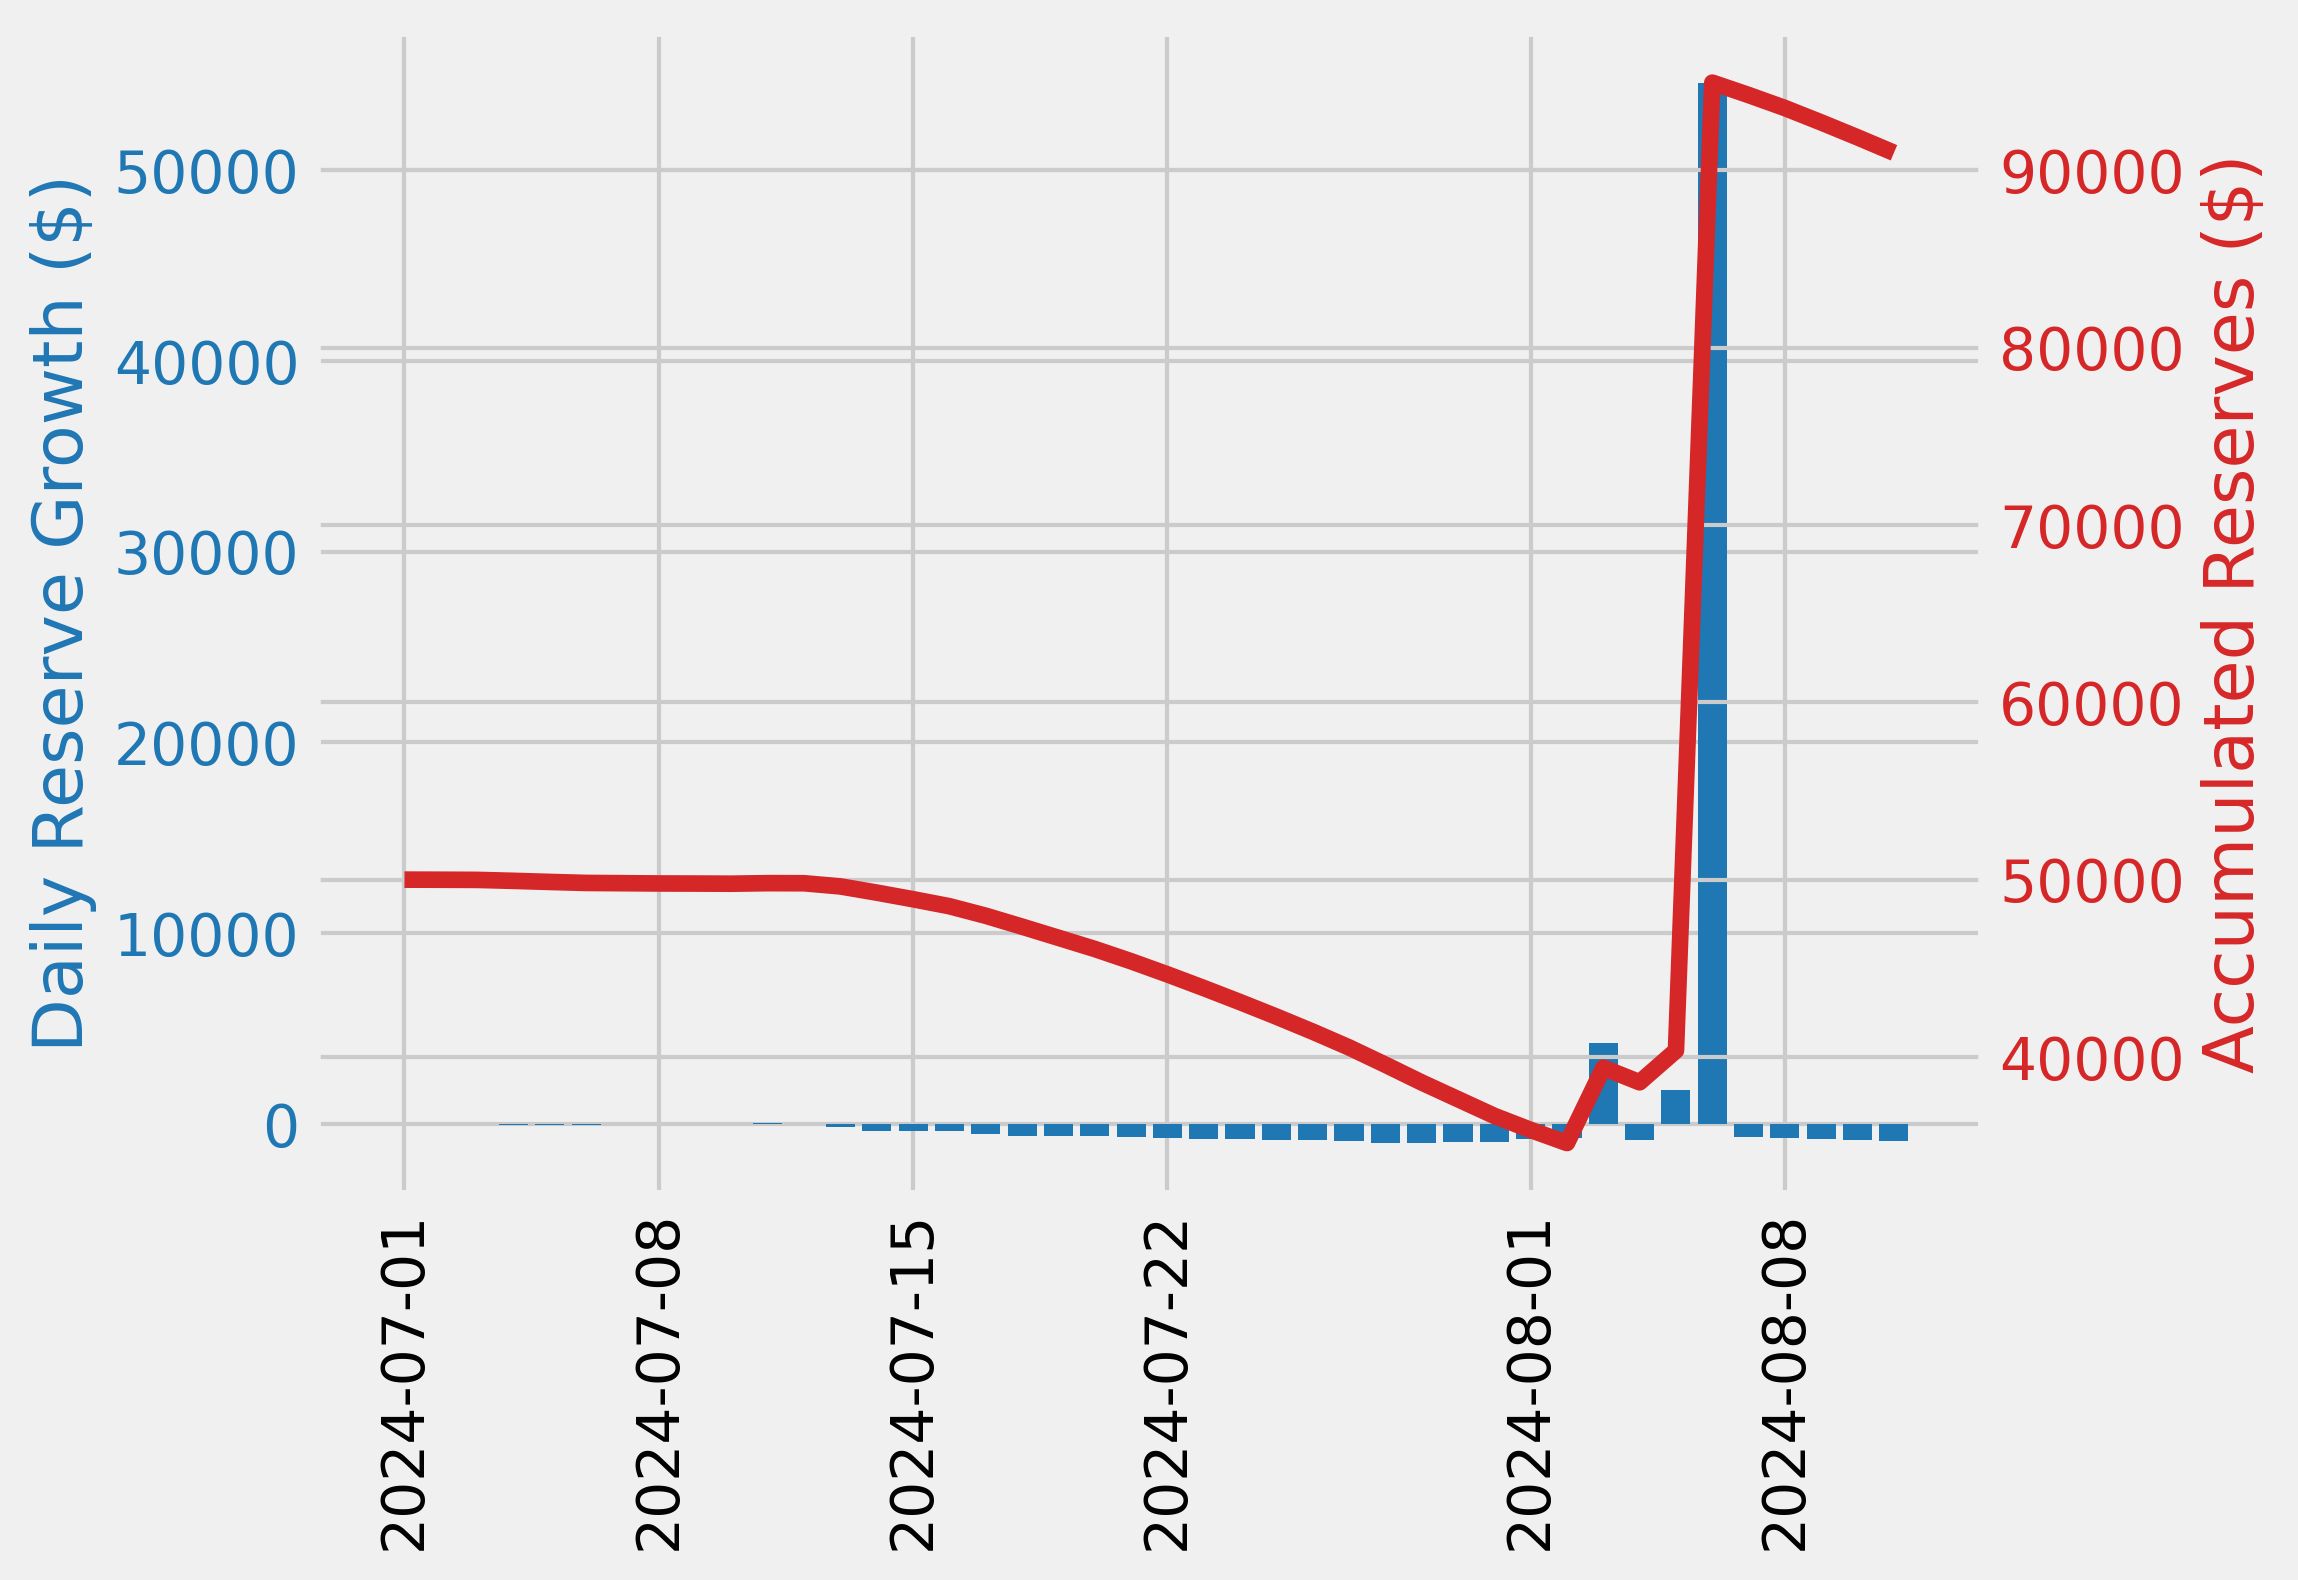
The minimum WETH reserve growth was 7.78%, and the maximum was 15.52%. The average WETH reserve growth was 11.79%.
-
The comet accumulated $2.53K WETH reserves while distributing 7.19K COMP rewards for a weekly Net Protocol Profit of -4.66K.
Base Asset APR Trend
Reserve Analysis
COMP Rewards Analysis
| Chain |
CometRewards COMP token holdings |
Daily aggregate COMP token reward distributions |
Remaining days of rewards runway (not including existing claimable rewards) |
| Arbitrum |
9.17K |
130.00 |
70.50 |
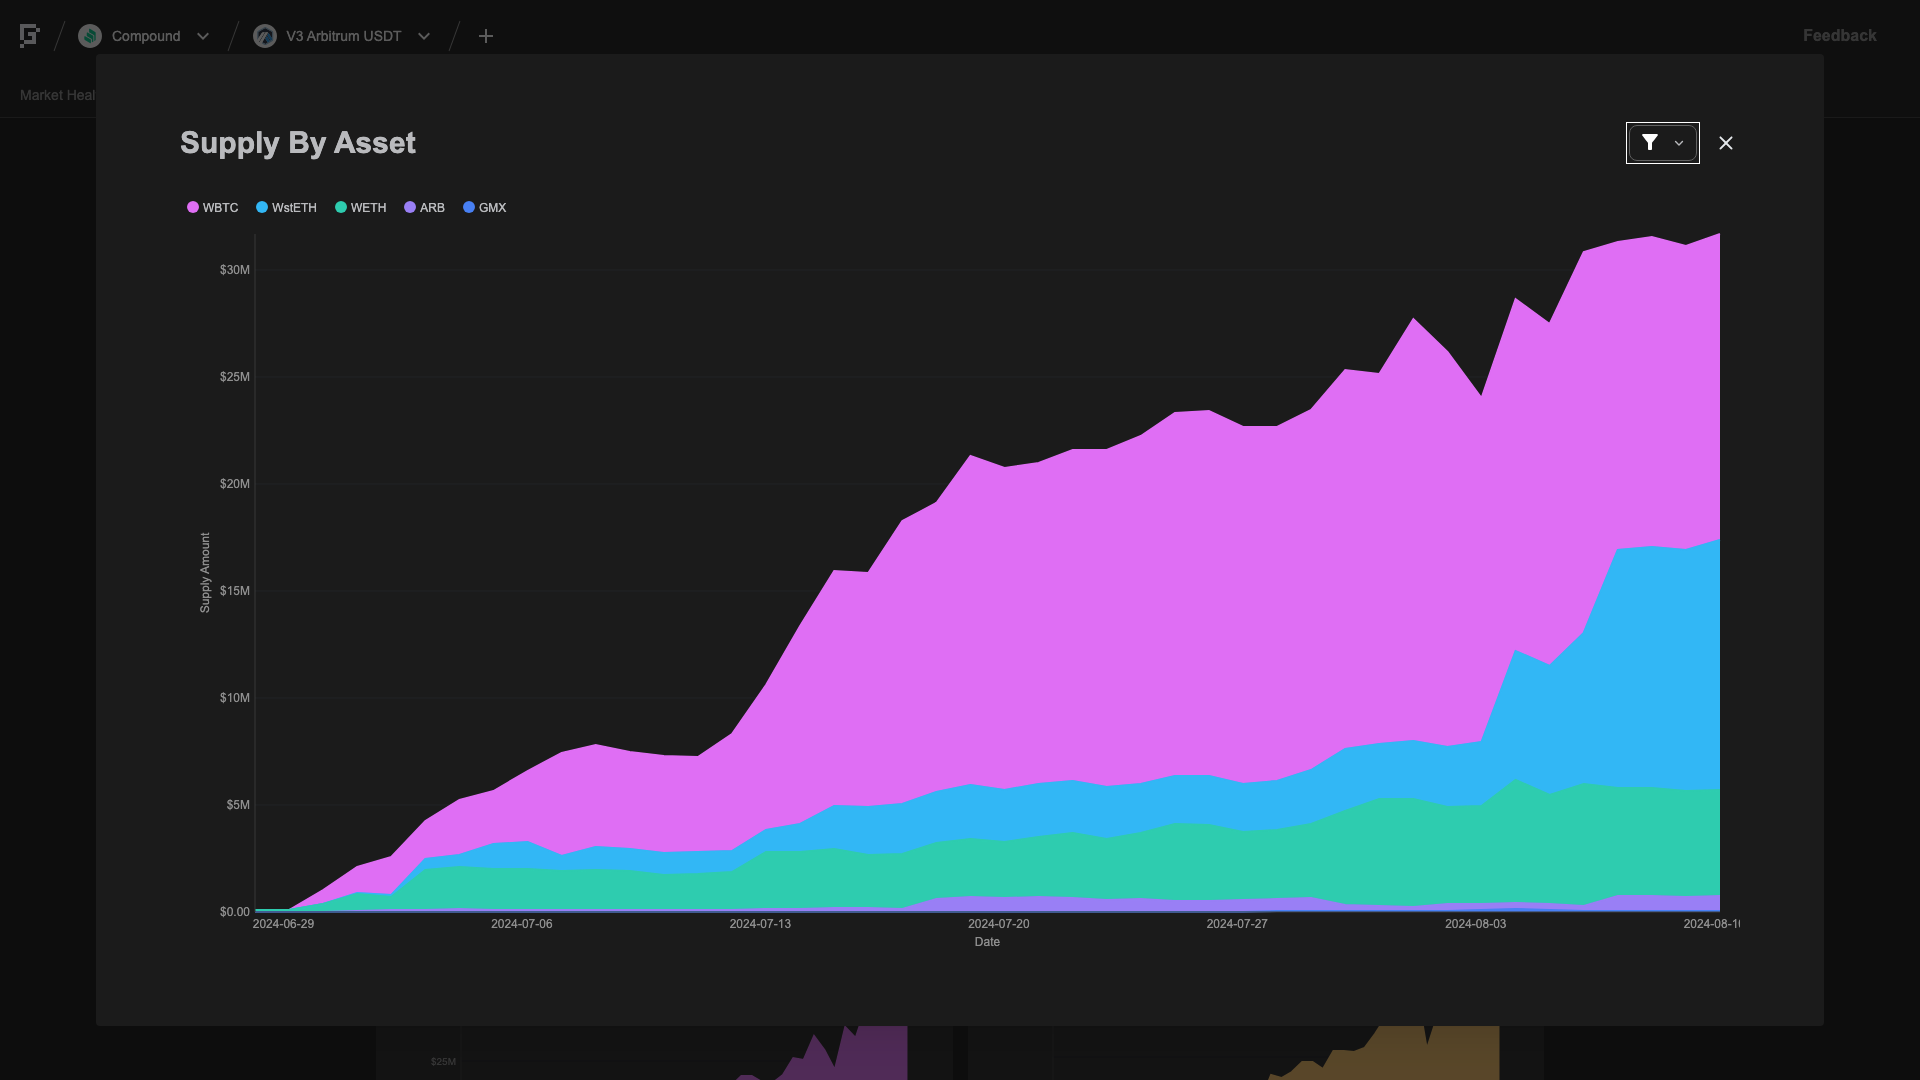
Collateral Asset Supply
This graph shows the total supply of all collateral assets over the past week.
To see updated statistics, please see the live version of this graph here.
Base Asset Borrows
This graph shows the total borrows of the base asset over the past week.
To see updated statistics, please see the live version of this graph here.
Utilization
This graph shows the utilization (borrow / supply) of the base asset over the past week.
Supply Cap Usage
This graph shows the supply cap usage (supply / supply cap) of all collateral assets over the past week.
Arbitrum USDT Comet
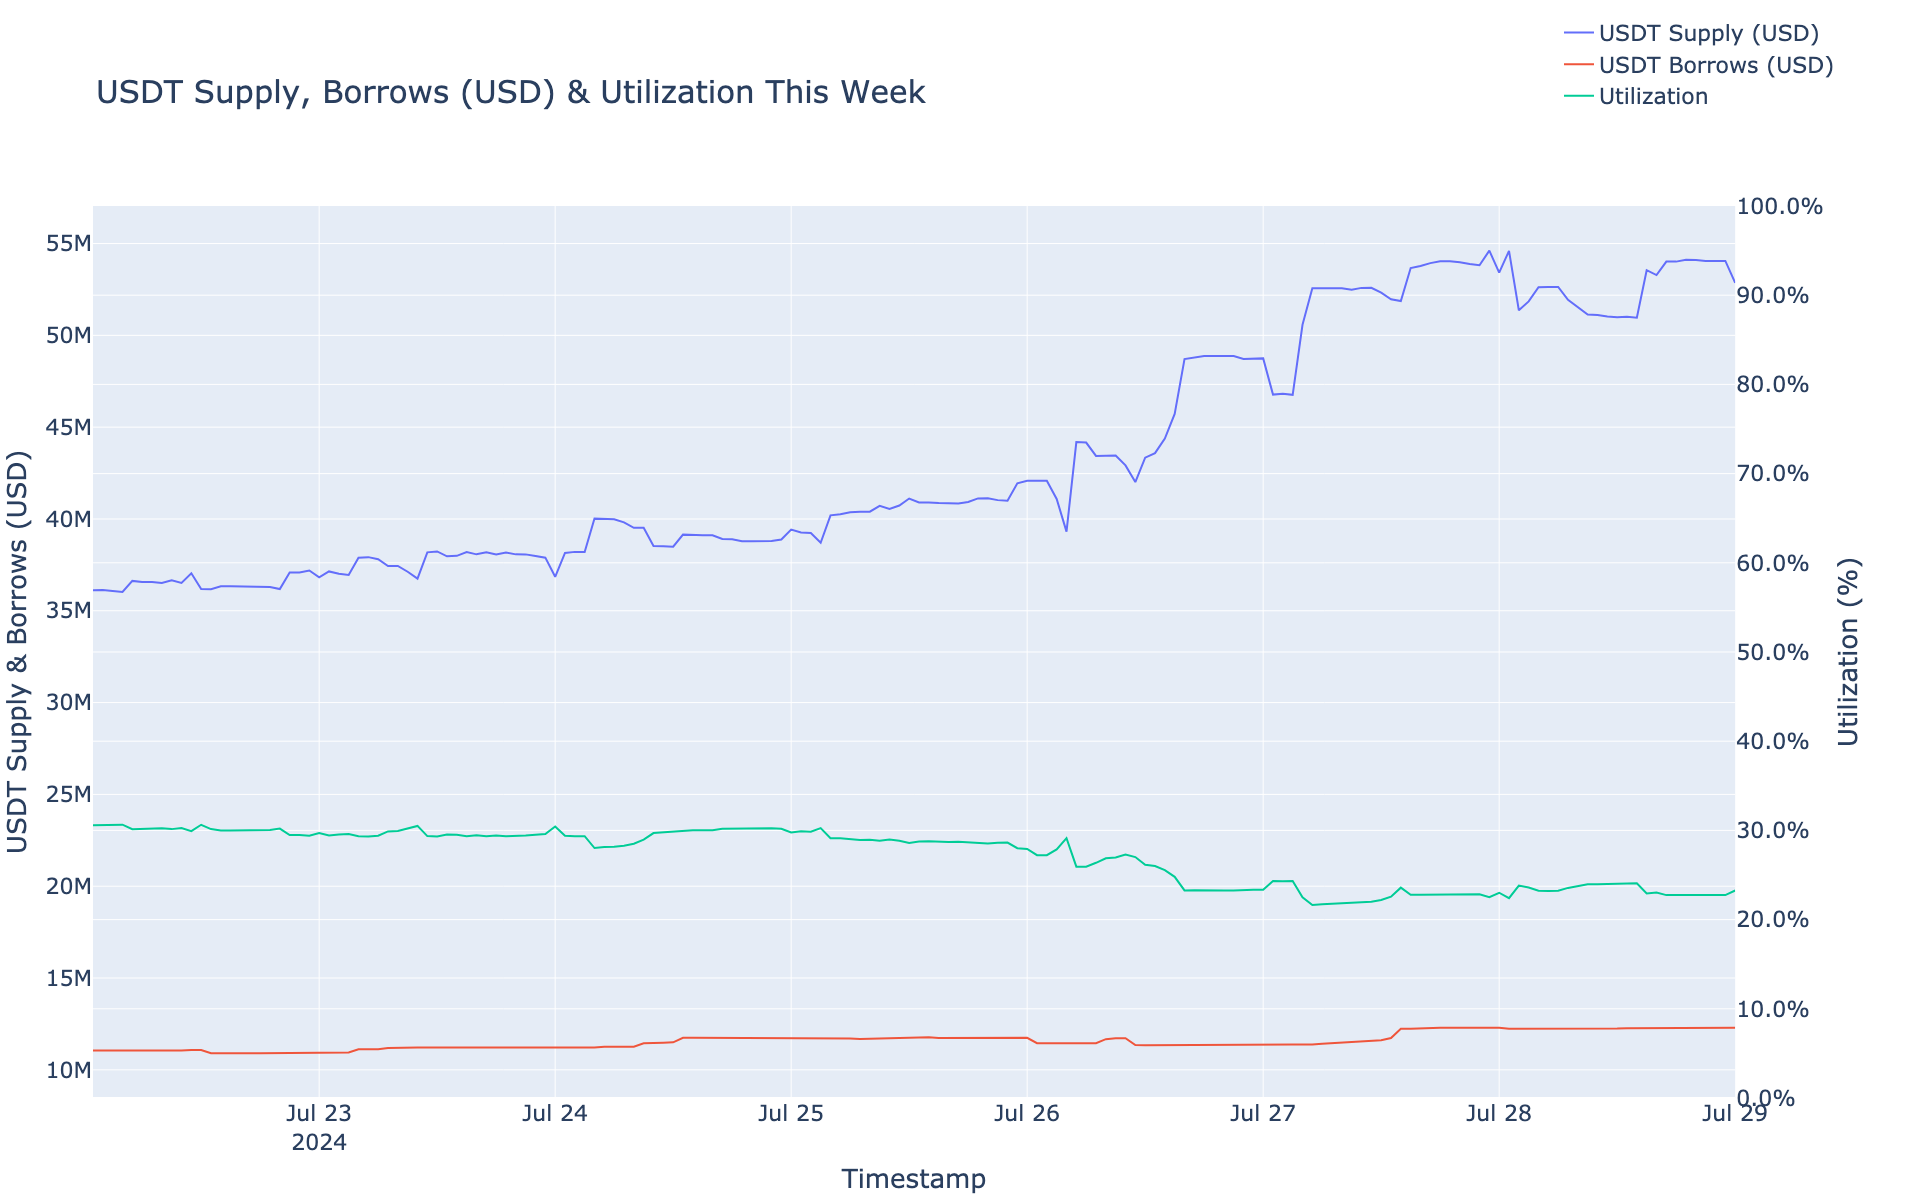
Gauntlet would like to provide the community with an update on the Arbitrum USDT comet over the past week.
Simple Summary
-
USDT Borrows decreased 4.92%, from $22.57M to $21.46M.
-
USDT Supply decreased 12.46%, from $30.40M to $26.61M.
-
USDT utilization increased 8.61%, from 74.25% to 80.65%.
-
The minimum USDT reserve growth was 0.91%, and the maximum was 9.94%. The average USDT reserve growth was 6.88%.
-
The comet accumulated $1.61K USDT reserves while distributing 14.37K COMP rewards for a weekly Net Protocol Profit of -12.76K.
Base Asset APR Trend
Reserve Analysis
COMP Rewards Analysis
| Chain |
CometRewards COMP token holdings |
Daily aggregate COMP token reward distributions |
Remaining days of rewards runway (not including existing claimable rewards) |
| Arbitrum |
9.17K |
130.00 |
70.50 |
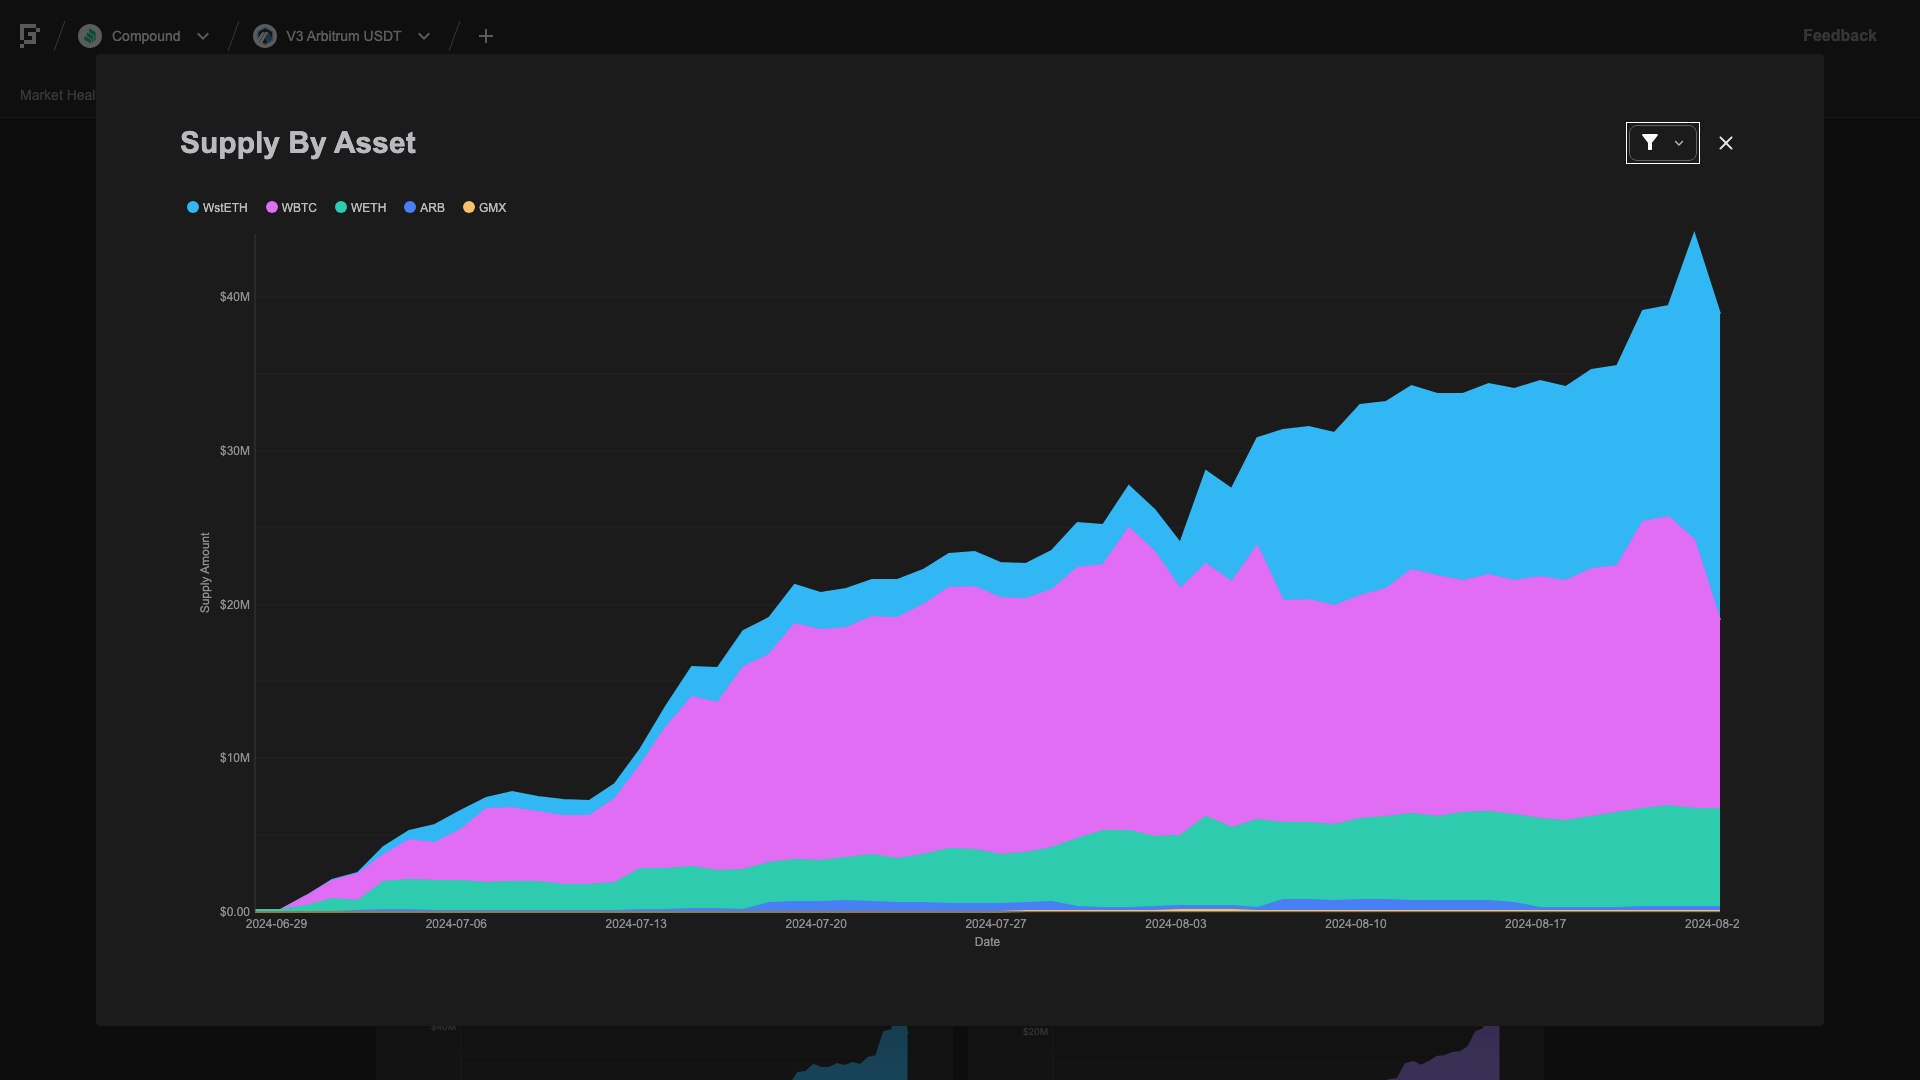
Collateral Asset Supply
This graph shows the total supply of all collateral assets over the past week.
To see updated statistics, please see the live version of this graph here.
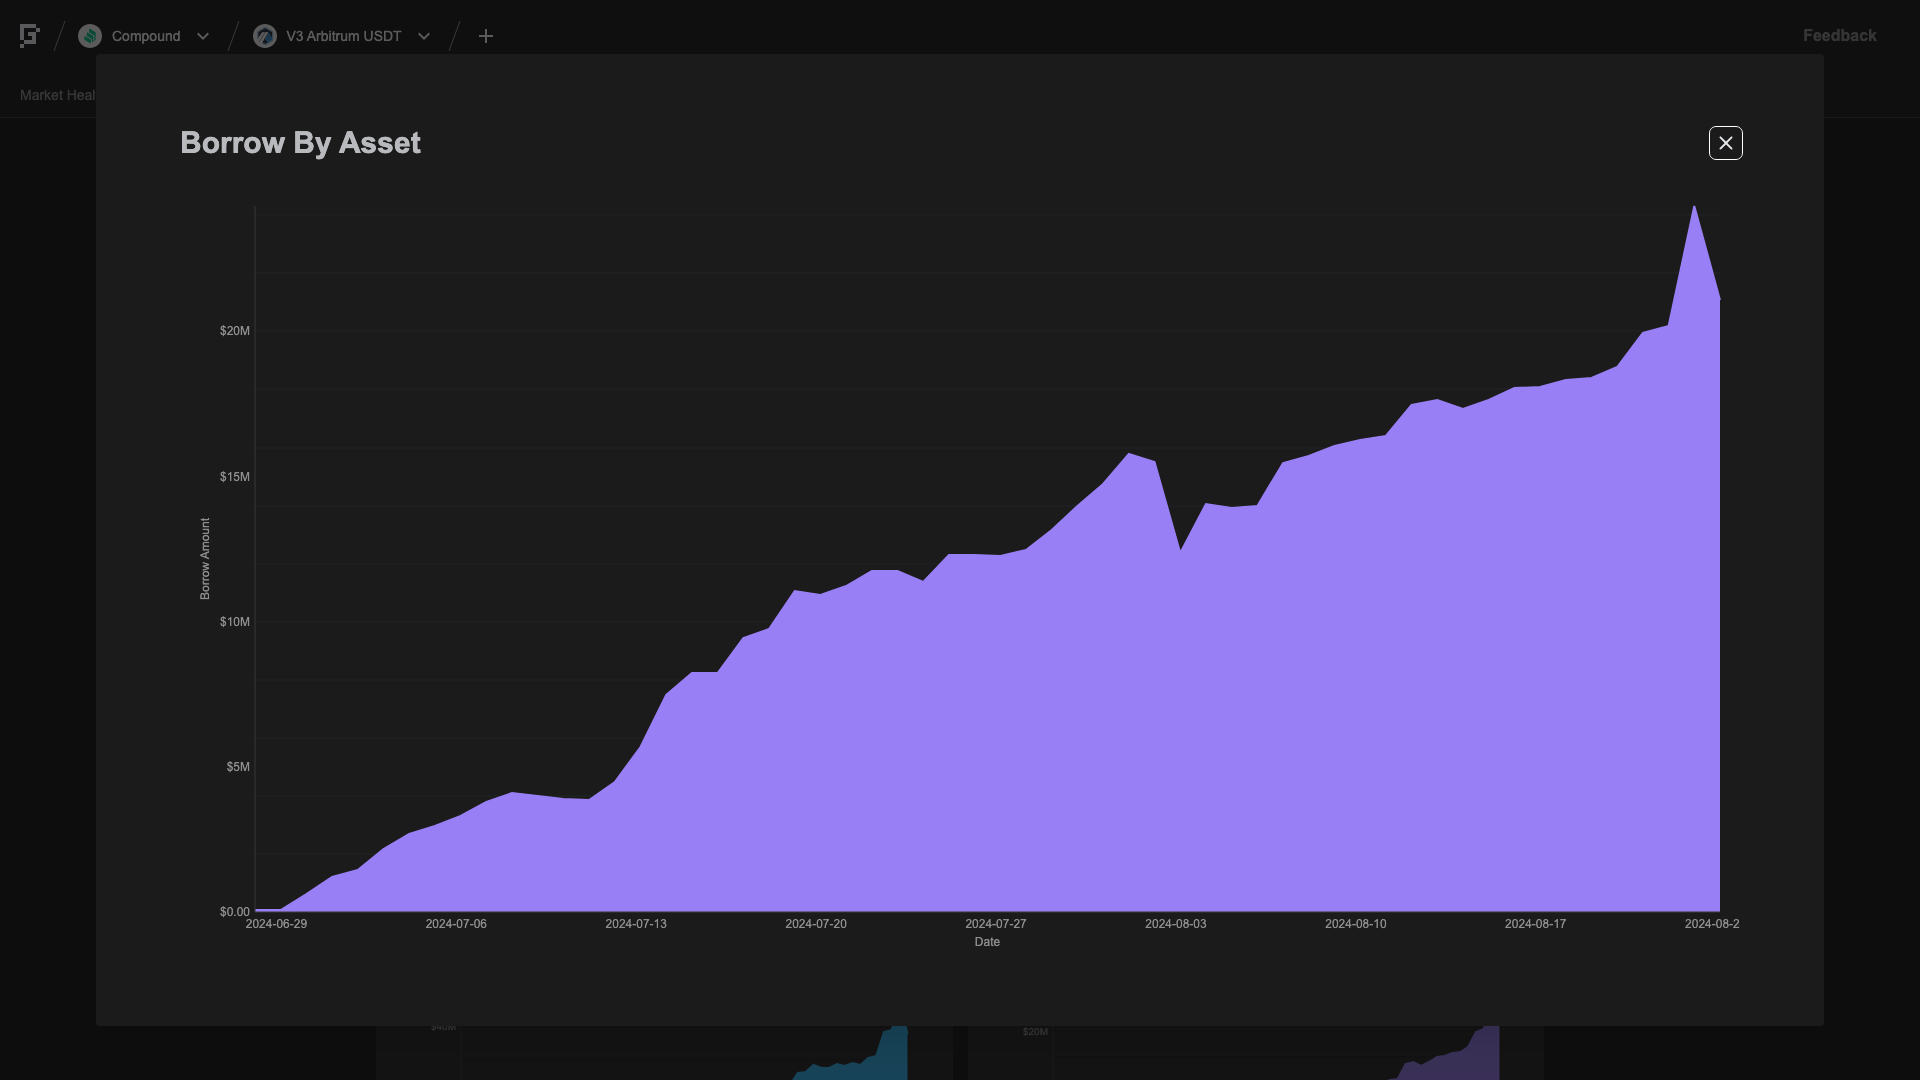
Base Asset Borrows
This graph shows the total borrows of the base asset over the past week.
To see updated statistics, please see the live version of this graph here.
Utilization
This graph shows the utilization (borrow / supply) of the base asset over the past week.
Supply Cap Usage
This graph shows the supply cap usage (supply / supply cap) of all collateral assets over the past week.