[Gauntlet] Arbitrum v3 USDC Native Update (10/13/2023 - 10/19/2023)
Gauntlet would like to provide the community with an update on metrics from the Arbitrum v3 USDC Native comet over the past week.
Simple Summary
- USDC Borrows are up 5.84%, from $6.75M to $7.15M.
- USDC Supply is up 2.45%, from $10.07M to $10.31M.
- USDC utilization increased 3.31%, from 67.2% to 69.5%.
- The minimum USDC reserve growth was 14.8%, and the maximum was 17.3%. The average USDC reserve growth was 16.1%.
- The comet accumulated $0.83k USDC reserves while distributing 11.3k COMP rewards for a weekly Net Protocol Profit of -10.47k.
Analysis
Below are metrics of the market and parameters over the past week. Note that collateral supply values are normalized to end date token prices, in order to get an idea of intentional user behavior as opposed to fluctuations in underlying token prices.
Market Growth
Total Collateral (USD) is up 4.43%, from $12.46M to $13.02M.
USDC Supply is up 2.45%, from $10.07M to $10.31M.
USDC Borrows are up 5.84%, from $6.75M to $7.15M.
USDC utilization increased 3.31%, from 67.2% to 69.5%.
Supply Caps
Above are the current supply cap utilizations for each collateral asset.
Above is a time series of supply cap utilization for each asset over the past week.
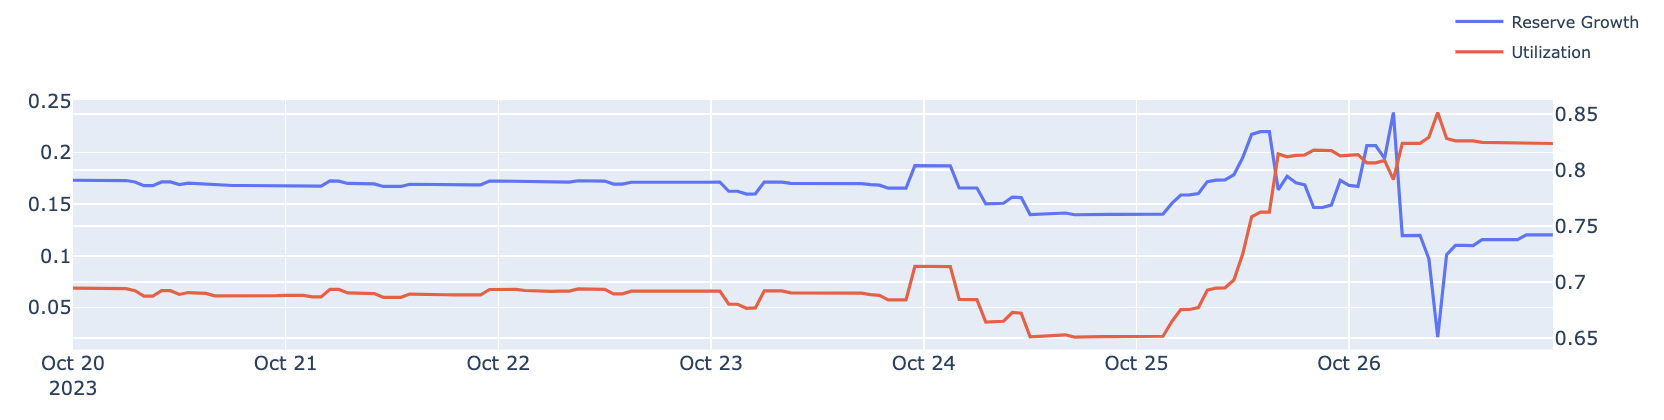
Utilization and Reserves
The minimum USDC utilization was 66.2%, and the maximum was 69.5%.
The minimum USDC reserve growth was 14.8%, and the maximum was 17.3%. The average USDC reserve growth was 16.1%.
The comet accumulated $0.83k USDC reserves while distributing 11.3k COMP rewards for a weekly Net Protocol Profit of -10.47k.
1 Like
[Gauntlet] Arbitrum v3 USDC Native Update (10/20/2023 - 10/26/2023)
Gauntlet would like to provide the community with an update on metrics from the Arbitrum v3 USDC Native comet over the past week.
Simple Summary
- USDC Borrows are up 25.27%, from $7.15M to $8.95M.
- USDC Supply is up 5.61%, from $10.31M to $10.89M.
- USDC utilization increased 18.56%, from 69.5% to 82.4%.
- The minimum USDC reserve growth was 2.1%, and the maximum was 23.9%. The average USDC reserve growth was 16.2%.
- The comet accumulated $0.93k USDC reserves while distributing 12.33k COMP rewards for a weekly Net Protocol Profit of -11.4k.
Analysis
Below are metrics of the market and parameters over the past week. Note that collateral supply values are normalized to end date token prices, in order to get an idea of intentional user behavior as opposed to fluctuations in underlying token prices.
Market Growth
Total Collateral (USD) is up 23.61%, from $15.58M to $19.26M.
USDC Supply is up 5.61%, from $10.31M to $10.89M.
USDC Borrows are up 25.27%, from $7.15M to $8.95M.
USDC utilization increased 18.56%, from 69.5% to 82.4%.
Supply Caps
Above are the current supply cap utilizations for each collateral asset.
Above is a time series of supply cap utilization for each asset over the past week.
Utilization and Reserves
The minimum USDC utilization was 65.1%, and the maximum was 85.1%.
The minimum USDC reserve growth was 2.1%, and the maximum was 23.9%. The average USDC reserve growth was 16.2%.
The comet accumulated $0.93k USDC reserves while distributing 12.33k COMP rewards for a weekly Net Protocol Profit of -11.4k.
[Gauntlet] Arbitrum v3 USDC Native Update (10/27/2023 - 11/02/2023)
Gauntlet would like to provide the community with an update on metrics from the Arbitrum v3 USDC Native comet over the past week.
Simple Summary
- USDC Borrows are up 26.32%, from $8.95M to $11.31M.
- USDC Supply is up 21.92%, from $10.89M to $13.28M.
- USDC utilization increased 3.75%, from 82.4% to 85.4%.
- The minimum USDC reserve growth was -7.9%, and the maximum was 18.0%. The average USDC reserve growth was 6.9%.
- The comet accumulated $0.62k USDC reserves while distributing 12.96k COMP rewards for a weekly Net Protocol Profit of -12.34k.
Analysis
Below are metrics of the market and parameters over the past week. Note that collateral supply values are normalized to end date token prices, in order to get an idea of intentional user behavior as opposed to fluctuations in underlying token prices.
Market Growth
Total Collateral (USD) is up 20.02%, from $20.0M to $24.01M.
USDC Supply is up 21.92%, from $10.89M to $13.28M.
USDC Borrows are up 26.32%, from $8.95M to $11.31M.
USDC utilization increased 3.75%, from 82.4% to 85.4%.
Supply Caps
Above are the current supply cap utilizations for each collateral asset.
Above is a time series of supply cap utilization for each asset over the past week. We will follow up next week with an update on ARB and WBTC supply cap recommendations.
Utilization and Reserves
The minimum USDC utilization was 81.1%, and the maximum was 90.1%.
The minimum USDC reserve growth was -7.9%, and the maximum was 18.0%. The average USDC reserve growth was 6.9%.
The comet accumulated $0.62k USDC reserves while distributing 12.96k COMP rewards for a weekly Net Protocol Profit of -12.34k.
[Gauntlet] Arbitrum v3 USDC Native Update (11/03/2023 - 11/09/2023)
Gauntlet would like to provide the community with an update on metrics from the Arbitrum v3 USDC Native comet over the past week.
Simple Summary
- USDC Borrows are up 22.25%, from $11.31M to $13.82M.
- USDC Supply is up 24.18%, from $13.28M to $16.49M.
- USDC utilization decreased 1.83%, from 85.3% to 83.8%.
- The minimum USDC reserve growth was -10.6%, and the maximum was 24.1%. The average USDC reserve growth was 0.9%.
- The comet accumulated $0.03k USDC reserves while distributing 14.11k COMP rewards for a weekly Net Protocol Profit of -14.09k.
Analysis
Below are metrics of the market and parameters over the past week. Note that collateral supply values are normalized to end date token prices, in order to get an idea of intentional user behavior as opposed to fluctuations in underlying token prices.
Market Growth
Total Collateral (USD) is up 15.09%, from $24.4M to $28.08M.
USDC Supply is up 24.18%, from $13.28M to $16.49M.
USDC Borrows are up 22.25%, from $11.31M to $13.82M.
USDC utilization decreased 1.83%, from 85.3% to 83.8%.
Supply Caps
Above are the current supply cap utilizations for each collateral asset.
Above is a time series of supply cap utilization for each asset over the past week.
Utilization and Reserves
The minimum USDC utilization was 80.0%, and the maximum was 92.5%.
The minimum USDC reserve growth was -10.6%, and the maximum was 24.1%. The average USDC reserve growth was 0.9%.
The comet accumulated $0.03k USDC reserves while distributing 14.11k COMP rewards for a weekly Net Protocol Profit of -14.09k.
[Gauntlet] Arbitrum v3 USDC Native Update: (11/10/23 - 11/16/23)
Gauntlet would like to provide the community with an update on the Arbitrum v3 USDC Native comet over the past week.
Simple Summary
- USDC Borrows increased 9.92%, from $13.85M to $15.22M.
- USDC Supply increased 2.73%, from $16.49M to $16.94M.
- USDC utilization increased 7.0%, from 83.98% to 89.85%.
- The minimum USDC reserve growth was -9.82%, and the maximum was 19.26%. The average USDC reserve growth was -1.38%.
- The comet accumulated $-0.39K USDC reserves while distributing $15.17K COMP rewards for a weekly Net Protocol Profit of $-15.56K.
Collateral Asset Supply
This graph shows the time series of total supply of all collateral assets.
To see updated statistics, please see the live version of this graph here.
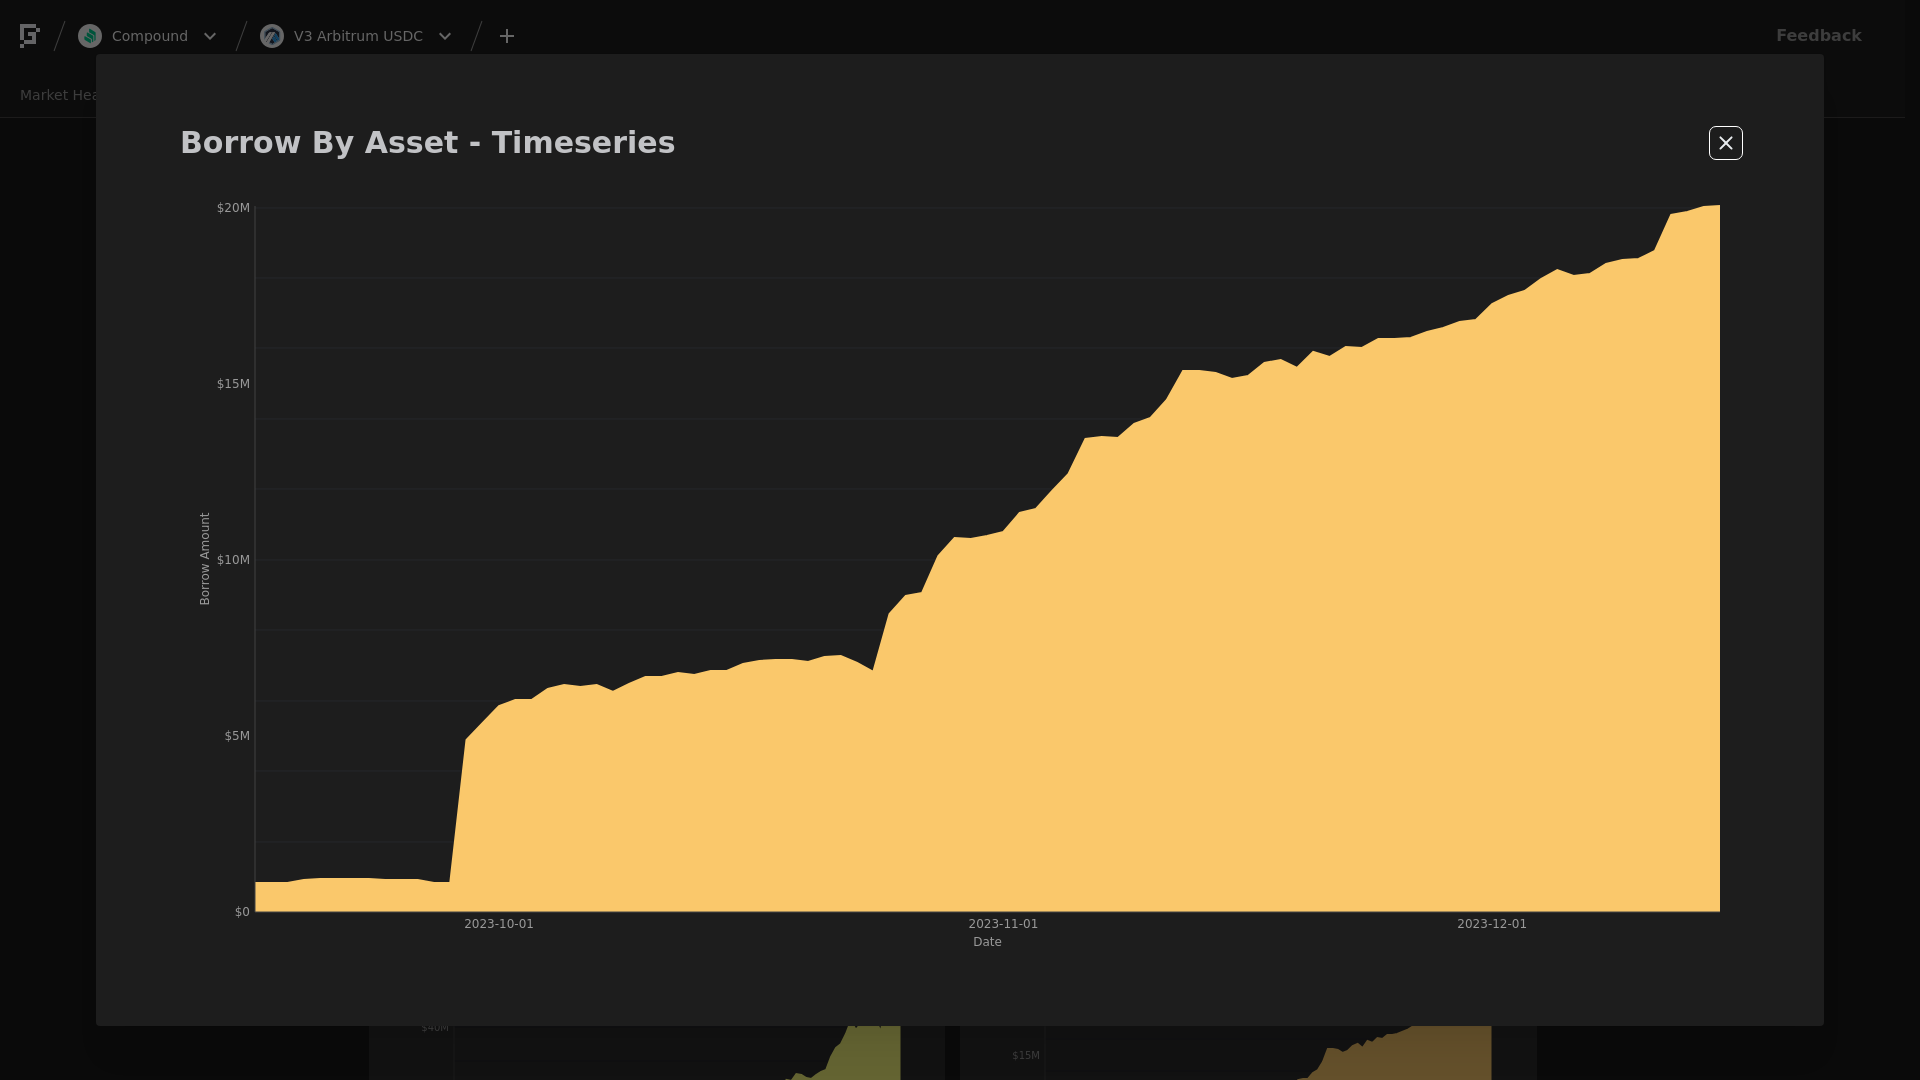
USDC Borrows
This graph shows the time series of USDC borrows.
To see updated statistics, please see the live version of this graph here.
Utilization
This graph shows the utilization (borrow / supply) of USDC over the past week.
Supply Cap Usage
This graph shows the supply cap usage (supply / supply cap) of all collateral assets over the past week.
[Gauntlet] Arbitrum v3 USDC Native Update: (11/17/23 - 11/23/23)
Gauntlet would like to provide the community with an update on the Arbitrum v3 USDC Native comet over the past week.
Simple Summary
- USDC Borrows increased 0.91%, from $15.9M to $16.05M.
- USDC Supply decreased 2.91%, from $18.59M to $18.05M.
- USDC utilization increased 3.93%, from 85.53% to 88.89%.
- The minimum USDC reserve growth was -6.24%, and the maximum was 2.95%. The average USDC reserve growth was -1.6%.
- The comet accumulated $-0.09K USDC reserves while distributing $3.92K COMP rewards for a weekly Net Protocol Profit of $-4.0K.
Asset Supply
This graph shows the time series of total supply of all assets.
To see updated statistics, please see the live version of this graph here.
USDC Borrows
This graph shows the time series of USDC borrows.
To see updated statistics, please see the live version of this graph here.
Utilization
This graph shows the utilization (borrow / supply) of USDC over the past week.
Supply Cap Usage
This graph shows the supply cap usage (supply / supply cap) of all collateral assets over the past week.
[Gauntlet] Arbitrum v3 USDC Native Update: (11/24/23 - 11/30/23)
Gauntlet would like to provide the community with an update on the Arbitrum v3 USDC Native comet over the past week.
Simple Summary
- USDC Borrows increased 4.4%, from $16.02M to $16.73M.
- USDC Supply increased 7.97%, from $18.08M to $19.52M.
- USDC utilization decreased 3.31%, from 88.61% to 85.68%.
- The minimum USDC reserve growth was -5.71%, and the maximum was 14.59%. The average USDC reserve growth was 3.01%.
- The comet accumulated $0.39K USDC reserves while distributing $12.4K COMP rewards for a weekly Net Protocol Profit of $-12.01K.
Asset Supply
This graph shows the time series of total supply of all assets.
To see updated statistics, please see the live version of this graph here.
USDC Borrows
This graph shows the time series of USDC borrows.
To see updated statistics, please see the live version of this graph here.
Utilization
This graph shows the utilization (borrow / supply) of USDC over the past week.
Supply Cap Usage
This graph shows the supply cap usage (supply / supply cap) of all collateral assets over the past week.
[Gauntlet] Arbitrum v3 USDC Native Update: (12/1/23 - 12/7/23)
Gauntlet would like to provide the community with an update on the Arbitrum v3 USDC Native comet over the past week.
Simple Summary
- USDC Borrows increased 8.43%, from $16.8M to $18.22M.
- USDC Supply increased 6.17%, from $19.21M to $20.4M.
- USDC utilization increased 2.12%, from 87.46% to 89.32%.
- The minimum USDC reserve growth was -9.49%, and the maximum was -0.28%. The average USDC reserve growth was -4.87%.
- The comet accumulated $-0.77K USDC reserves while distributing $10.34K COMP rewards for a weekly Net Protocol Profit of $-11.11K.
Asset Supply
This graph shows the time series of total supply of all assets.
To see updated statistics, please see the live version of this graph here.
USDC Borrows
This graph shows the time series of USDC borrows.
To see updated statistics, please see the live version of this graph here.
Utilization
This graph shows the utilization (borrow / supply) of USDC over the past week.
Supply Cap Usage
This graph shows the supply cap usage (supply / supply cap) of all collateral assets over the past week.
1 Like
[Gauntlet] Arbitrum v3 USDC Native Update: (12/08/23 - 12/14/23)
Gauntlet would like to provide the community with an update on the Arbitrum v3 USDC Native comet over the past week.
Simple Summary
- USDC Borrows increased 9.2%, from $18.12M to $19.79M.
- USDC Supply decreased 2.13%, from $20.33M to $19.9M.
- USDC utilization increased 11.57%, from 89.14% to 99.46%.
- The minimum USDC reserve growth was -13.98%, and the maximum was -6.19%. The average USDC reserve growth was -10.23%.
- The comet accumulated $-2.56K USDC reserves while distributing $12.72K COMP rewards for a weekly Net Protocol Profit of $-15.29K.
Collateral Asset Supply
This graph shows the total supply of all collateral assets over the past week.
To see updated statistics, please see the live version of this graph here.
Base Asset Borrows
This graph shows the total borrows of the base asset over the past week.
To see updated statistics, please see the live version of this graph here.
Utilization
This graph shows the utilization (borrow / supply) of the base asset over the past week.
Supply Cap Usage
This graph shows the supply cap usage (supply / supply cap) of all collateral assets over the past week.
[Gauntlet] Arbitrum v3 USDC Native Update (12/21/2023 - 12/27/2023)
Gauntlet would like to provide the community with an update on the USDC comet over the past week.
Simple Summary
- USDC Borrows increased 1.48%, from $20.19M to $20.49M.
- USDC Supply increased 11.0%, from $21.4M to $23.75M.
- USDC utilization decreased 8.58%, from 94.36% to 86.27%.
- The minimum USDC reserve growth was -13.81%, and the maximum was 17.72%. The average USDC reserve growth was 2.01%.
- The comet accumulated $2.12K USDC reserves while distributing $16.11K COMP rewards for a weekly Net Protocol Profit of $-13.99K.
Collateral Asset Supply
This graph shows the total supply of all collateral assets over the past week.
To see updated statistics, please see the live version of this graph here.
Base Asset Borrows
This graph shows the total borrows of the base asset over the past week.
To see updated statistics, please see the live version of this graph here.
Utilization
This graph shows the utilization (borrow / supply) of the base asset over the past week.
Supply Cap Usage
This graph shows the supply cap usage (supply / supply cap) of all collateral assets over the past week.
[Gauntlet] Arbitrum v3 USDC Native Update (2023-12-28 through 2024-01-03)
Gauntlet would like to provide the community with an update on metrics from the Arbitrum v3 USDC Native comet over the past week.
Simple Summary
- USDC Borrows increased 1.44%, from $20.49M to $20.78M.
- USDC Supply increased 0.0%, from $23.54M to $23.54M.
- USDC utilization increased 1.44%, from 87.04% to 88.29%.
- The minimum USDC reserve growth was 10.52%, and the maximum was 19.52%. The average USDC reserve growth was 11.75%.
- The comet accumulated $5.32K USDC reserves while distributing $16.42K COMP rewards for a weekly Net Protocol Profit of $-11.1K.
Collateral Asset Supply
This graph shows the total supply of all collateral assets over the past week.
To see updated statistics, please see the live version of this graph here.
Base Asset Borrows
This graph shows the total borrows of the base asset over the past week.
To see updated statistics, please see the live version of this graph here.
Utilization
This graph shows the utilization (borrow / supply) of the base asset over the past week.
Supply Cap Usage
This graph shows the supply cap usage (supply / supply cap) of all collateral assets over the past week.
[Gauntlet] Arbitrum v3 USDC Native Update (2024-01-04 through 2024-01-10)
Gauntlet would like to provide the community with an update on metrics from the Arbitrum v3 USDC Native comet over the past week.
Simple Summary
- USDC Borrows decreased 0.06%, from $20.81M to $20.8M.
- USDC Supply increased 3.5%, from $23.55M to $24.37M.
- USDC utilization decreased 3.44%, from 88.38% to 85.34%.
- The minimum USDC reserve growth was 10.53%, and the maximum was 20.05%. The average USDC reserve growth was 14.08%.
- The comet accumulated $5.1K USDC reserves while distributing $14.3K COMP rewards for a weekly Net Protocol Profit of $-9.21K.
Collateral Asset Supply
This graph shows the total supply of all collateral assets over the past week.
To see updated statistics, please see the live version of this graph here.
Base Asset Borrows
This graph shows the total borrows of the base asset over the past week.
To see updated statistics, please see the live version of this graph here.
Utilization
This graph shows the utilization (borrow / supply) of the base asset over the past week.
Supply Cap Usage
This graph shows the supply cap usage (supply / supply cap) of all collateral assets over the past week.
[Gauntlet] Arbitrum v3 USDC Native Update (2024-01-11 through 2024-01-17)
Gauntlet would like to provide the community with an update on the USDC comet over the past week.
Simple Summary
- USDC Borrows decreased 4.13%, from $20.99M to $20.13M.
- USDC Supply decreased 6.7%, from $24.37M to $22.74M.
- USDC utilization increased 2.76%, from 86.14% to 88.52%.
- The minimum USDC reserve growth was 10.52%, and the maximum was 15.82%. The average USDC reserve growth was 12.09%.
- The comet accumulated $5.19K USDC reserves while distributing $15.76K COMP rewards for a weekly Net Protocol Profit of $-10.57K.
Collateral Asset Supply
This graph shows the total supply of all collateral assets over the past week.
To see updated statistics, please see the live version of this graph here.
Base Asset Borrows
This graph shows the total borrows of the base asset over the past week.
To see updated statistics, please see the live version of this graph here.
Utilization
This graph shows the utilization (borrow / supply) of the base asset over the past week.
Supply Cap Usage
This graph shows the supply cap usage (supply / supply cap) of all collateral assets over the past week.
[Gauntlet] Arbitrum v3 USDC Native Update (2024-01-19 through 2024-01-25)
Gauntlet would like to provide the community with an update on metrics from the Arbitrum v3 USDC Native comet over the past week. Gauntlet is continuing to monitor all the Compound markets. Gauntlet is aware of the asset supply caps that are close to full utilziation. Gauntlet will continue to monitor these assets and provide recommendations based on our methodology.
Simple Summary
- USDC Borrows decreased 4.11%, from $20.09M to $19.26M.
- USDC Supply decreased 1.45%, from $23.0M to $22.67M.
- USDC utilization decreased 2.7%, from 87.32% to 84.96%.
- The minimum USDC reserve growth was 11.13%, and the maximum was 20.04%. The average USDC reserve growth was 14.84%.
- The comet accumulated $4.7K USDC reserves while distributing $15.16K COMP rewards for a weekly Net Protocol Profit of $-10.46K.
Collateral Asset Supply
This graph shows the total supply of all collateral assets over the past week.
To see updated statistics, please see the live version of this graph here.
Base Asset Borrows
This graph shows the total borrows of the base asset over the past week.
To see updated statistics, please see the live version of this graph here.
Utilization
This graph shows the utilization (borrow / supply) of the base asset over the past week.
Supply Cap Usage
This graph shows the supply cap usage (supply / supply cap) of all collateral assets over the past week.
[Gauntlet] Arbitrum v3 USDC Native Update (2024-01-26 through 2024-02-01)
Gauntlet would like to provide the community with an update on metrics from the Arbitrum v3 USDC Native comet over the past week.
Simple Summary
- USDC Borrows increased 5.35%, from $19.26M to $20.29M.
- USDC Supply increased 3.31%, from $22.67M to $23.42M.
- USDC utilization increased 1.98%, from 84.97% to 86.65%.
- The minimum USDC reserve growth was 11.68%, and the maximum was 20.05%. The average USDC reserve growth was 15.32%.
- The comet accumulated $4.61K USDC reserves while distributing $15.32K COMP rewards for a weekly Net Protocol Profit of $-10.72K.
Collateral Asset Supply
This graph shows the total supply of all collateral assets over the past week.
To see updated statistics, please see the live version of this graph here.
Base Asset Borrows
This graph shows the total borrows of the base asset over the past week.
To see updated statistics, please see the live version of this graph here.
Utilization
This graph shows the utilization (borrow / supply) of the base asset over the past week.
Supply Cap Usage
This graph shows the supply cap usage (supply / supply cap) of all collateral assets over the past week.
[Gauntlet] USDC Comet Update: (2024-02-02 through 2024-02-08)
Gauntlet would like to provide the community with an update on the USDC comet over the past week.
- This week’s risk parameter updates for the Arbitrum v3 USDC Native comet
Simple Summary
- USDC Borrows decreased 1.29%, from $20.29M to $20.03M.
- USDC Supply decreased 1.22%, from $23.27M to $22.98M.
- USDC utilization decreased 0.07%, from 87.22% to 87.16%.
- The minimum USDC reserve growth was 11.1%, and the maximum was 20.01%. The average USDC reserve growth was 15.64%.
- The comet accumulated $4.56K USDC reserves while distributing $14.99K COMP rewards for a weekly Net Protocol Profit of $-10.43K.
Utilization
This graph shows the utilization (borrow / supply) of the base asset over the past week.
Supply Cap Usage
This graph shows the supply cap usage (supply / supply cap) of all collateral assets over the past week.
[Gauntlet] Arbitrum v3 USDC Native Update (2024-02-09 through 2024-02-15)
Gauntlet would like to provide the community with an update on the USDC comet over the past week.
Simple Summary
- USDC Borrows decreased 4.59%, from $20.03M to $19.11M.
- USDC Supply increased 0.75%, from $22.9M to $23.07M.
- USDC utilization decreased 5.3%, from 87.46% to 82.83%.
- The minimum USDC reserve growth was 10.52%, and the maximum was 19.95%. The average USDC reserve growth was 14.82%.
- The comet accumulated $4.96K USDC reserves while distributing $15.79K COMP rewards for a weekly Net Protocol Profit of $-10.83K.
-
- Gauntlet has outstanding recommendation to increase WETH and ARB supply cap.
Collateral Asset Supply
This graph shows the total supply of all collateral assets over the past week.
To see updated statistics, please see the live version of this graph here.
Base Asset Borrows
This graph shows the total borrows of the base asset over the past week.
To see updated statistics, please see the live version of this graph here.
Utilization
This graph shows the utilization (borrow / supply) of the base asset over the past week.
Supply Cap Usage
This graph shows the supply cap usage (supply / supply cap) of all collateral assets over the past week.
1 Like
[Gauntlet] USDC Comet Update: (2024-02-16 through 2024-02-22)
Gauntlet would like to provide the community with an update on the USDC comet over the past week.
This week, Gauntlet recommends the following risk parameter updates for the Arbitrum v3 USDC Native comet, see here:
- Increase GMX Supply Cap from 50,000 to 100,000
- Increase GMX Liquidation Factor from 45% to 60%
- Increase GMX Collateral Factor from 40% to 50%
- Increase ARB Supply Cap from 8,000,000 to 16,000,000
- Increase ARB Liquidation Factor from 60% to 80%
- Increase ARB Collateral Factor from 55% to 70%
- Increase ARB Liquidation Penalty from 7% to 10%
- Decrease Store Front Price Factor from 80% to 60%
- Increase WETH Supply Cap from 5,000 to 10,000
Simple Summary
- USDC Borrows increased 8.74%, from $19.11M to $20.78M.
- USDC Supply increased 4.84%, from $23.07M to $24.18M.
- USDC utilization increased 3.72%, from 82.85% to 85.93%.
- The minimum USDC reserve growth was 10.73%, and the maximum was 19.86%. The average USDC reserve growth was 14.25%.
- The comet accumulated $4.81K USDC reserves while distributing $16.66K COMP rewards for a weekly Net Protocol Profit of $-11.85K.
Collateral Asset Supply
This graph shows the total supply of all collateral assets over the past week.
To see updated statistics, please see the live version of this graph here.
Base Asset Borrows
This graph shows the total borrows of the base asset over the past week.
To see updated statistics, please see the live version of this graph here.
Utilization
This graph shows the utilization (borrow / supply) of the base asset over the past week.
Supply Cap Usage
This graph shows the supply cap usage (supply / supply cap) of all collateral assets over the past week.
1 Like
[Gauntlet] USDC Comet Update: (2024-02-23 through 2024-02-29)
Gauntlet would like to provide the community with an update on the USDC comet over the past week. Our recent proposal [Gauntlet] BASE v3 & Arbitrum v3 - Risk Recommendations (02/09/2024) went on-chain and increase cap liquidity for ARB and GMX.
Simple Summary
- USDC Borrows increased 20.96%, from $20.78M to $25.14M.
- USDC Supply increased 15.26%, from $23.89M to $27.54M.
- USDC utilization increased 4.94%, from 86.97% to 91.27%.
- The minimum USDC reserve growth was 10.52%, and the maximum was 19.91%. The average USDC reserve growth was 13.15%.
- The comet accumulated $6.06K USDC reserves while distributing $21.82K COMP rewards for a weekly Net Protocol Profit of $-15.76K.
Collateral Asset Supply
This graph shows the total supply of all collateral assets over the past week.
To see updated statistics, please see the live version of this graph here.
Base Asset Borrows
This graph shows the total borrows of the base asset over the past week.
To see updated statistics, please see the live version of this graph here.
Utilization
This graph shows the utilization (borrow / supply) of the base asset over the past week.
Supply Cap Usage
This graph shows the supply cap usage (supply / supply cap) of all collateral assets over the past week.
[Gauntlet] USDC Comet Update: (2024-03-01 through 2024-03-07)
Gauntlet would like to provide the community with an update on the USDC comet over the past week.
Simple Summary
- USDC Borrows increased 6.72%, from $25.12M to $26.81M.
- USDC Supply increased 1.92%, from $27.56M to $28.09M.
- USDC utilization increased 4.71%, from 91.15% to 95.44%.
- The minimum USDC reserve growth was 10.52%, and the maximum was 14.69%. The average USDC reserve growth was 11.11%.
- The comet accumulated $11.19K USDC reserves while distributing $25.07K COMP rewards for a weekly Net Protocol Profit of $-13.88K.
Collateral Asset Supply
This graph shows the total supply of all collateral assets over the past week.
To see updated statistics, please see the live version of this graph here.
Base Asset Borrows
This graph shows the total borrows of the base asset over the past week.
To see updated statistics, please see the live version of this graph here.
Utilization
This graph shows the utilization (borrow / supply) of the base asset over the past week.
Supply Cap Usage
This graph shows the supply cap usage (supply / supply cap) of all collateral assets over the past week.