[Gauntlet] Weekly Market Updates: Ethereum USDC

[Gauntlet] Weekly Market Update: Ethereum USDC (7/21/23 - 7/28/23)

Gauntlet would like to provide the community with an update on metrics from the Ethereum USDC comet over the past week and will include any relevant recommendations.

Simple Summary

  • Gauntlet has an outstanding proposal to increase supply caps for WBTC, LINK, and UNI. Otherwise, Gauntlet recommends no additional changes at this time.
  • Based on community preferences, we will more aggressively move to deprecate the v2 market in favor of v3.
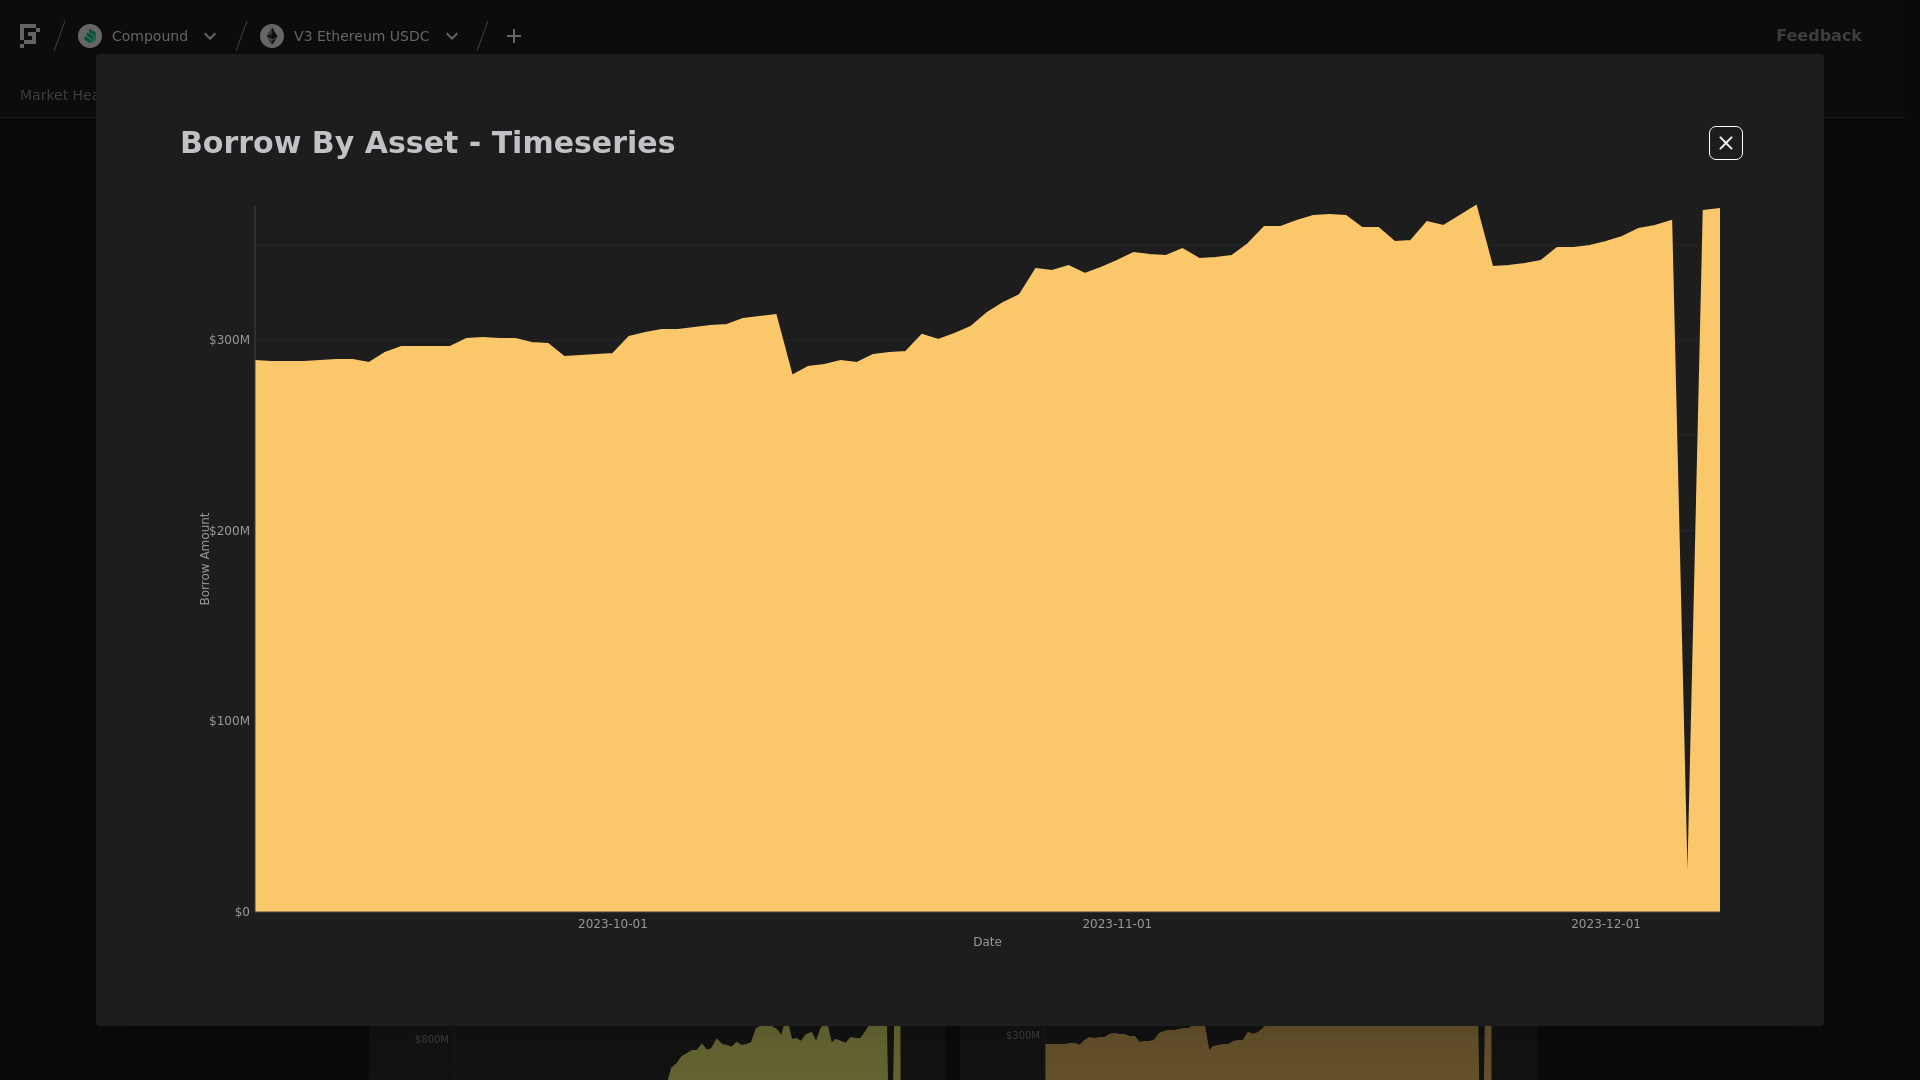
  • USDC borrows are down 0.51%.
  • USDC supply is down 1.88%. However, on the date of this post, a user deposited $45.4M USDC, increasing the USDC supply by 9.8%. This will be included in the market update next week.
  • The comet accumulated $43.6k USDC reserves over the past week, with an average reserve growth of 14.1%.
  • The comet distributed $230.3k COMP rewards over the past week, for a Net Protocol Profit of -$186.7k.

Analysis

Below are metrics of the market and parameters over the past week.

Market Growth

Total Collateral (USD) is down 0.77%, from $748.65M to $742.87M.

USDC Borrows are down 0.51%, from $363.31M to $361.45M.

USDC Supply is down 1.88%, from $387.69M to $380.41M. However, on the date of this post, a user deposited $45.4M USDC, increasing the USDC supply by 9.8% to $425.63M. This will be included in the market update next week.

Supply Caps

As seen above, WBTC (75.2%), COMP (90.5%), LINK (100%), and UNI (100%), all have supply cap utilizations > 75%. We have an outstanding proposal to increase supply caps for WBTC, LINK, and UNI, and we recommend not increasing the COMP supply cap due to lower liquidity.

Above is a time series of supply cap utilization for each asset over the past week.

Utilization and Reserves

The minimum USDC utilization was 93.7%, and the maximum was 97.9%.

The minimum USDC reserve growth was 4.4%, and the maximum was 18.3%. The average USDC reserve growth was 14.1%.

The comet steadily accumulated $43.6k USDC reserves, while distributing $230.3k COMP rewards, for a weekly Net Protocol Profit of -$186.7k.

3 Likes

Ethereum USDC Market Update (7/28/23 - 8/3/23)

Gauntlet would like to provide the community with an update on metrics from the Ethereum USDC comet over the past week.

Simple Summary

  • Gauntlet’s proposal to increase supply caps for WBTC, LINK, and UNI was executed on 7/31/23.
  • USDC borrows are up 7.52%.
  • USDC supply is up 2.52%.
  • The comet accumulated $27.8k USDC reserves over the past week, with an average reserve growth of 9.2%.
  • The comet distributed $225.8k COMP rewards over the past week, for a Net Protocol Profit of -$198.0k.

Analysis

Below are metrics of the market and parameters over the past week.

Market Growth

Total Collateral (USD) is up 5.54%, from $726.93M to $767.18M.

USDC Borrows are up 7.52%, from $361.45M to $388.63M.

USDC Supply is up 2.52%, from $380.41M to $389.99M.

Supply Caps

Gauntlet’s proposal to increase supply caps for WBTC, LINK, and UNI was executed on 7/31/23.

As seen above, only COMP (93.6%) has a supply cap utilization> 75%. We recommend not increasing the COMP supply cap due to lower liquidity.

Above is a time series of supply cap utilization for each asset over the past week.

Utilization and Reserves

The minimum USDC utilization was 84.9%, and the maximum was 100.3%.

The minimum USDC reserve growth was -1.0%, and the maximum was 18.3%. The average USDC reserve growth was 9.2%.

The comet accumulated $27.8k USDC reserves while distributing $225.8k COMP rewards for a weekly Net Protocol Profit of -$198.0k.

1 Like

[Gauntlet] Ethereum USDC Market Update (8/4/23 - 8/10/23)

Gauntlet would like to provide the community with an update on metrics from the Ethereum USDC comet over the past week.

Simple Summary

  • USDC Borrows are up 1.97%, from $388.63M to $396.27M.
  • USDC Supply is up 2.12%, from $389.99M to $398.26M.
  • USDC utilization slightly decreased from 99.7% to 99.5%.
  • The comet accumulated $12.97k USDC reserves, with an average reserve growth was 3.0%.
  • The comet distributed $189.44k COMP rewards for a weekly Net Protocol Profit of -$176.47k.

Analysis

Below are metrics of the market and parameters over the past week.

Market Growth

Total Collateral (USD) is down 4.89%, from $769.90M to $732.25M.

USDC Borrows are up 1.97%, from $388.63M to $396.27M.

USDC Supply is up 2.12%, from $389.99M to $398.26M.

As seen above, only COMP (93.3%) has a supply cap utilization> 75%. We recommend not increasing the COMP supply cap due to lower liquidity.

Above is a time series of supply cap utilization for each asset over the past week.

Utilization and Reserves

USDC utilization slightly decreased from 99.7% to 99.5%.

The minimum USDC utilization was 96.6%, and the maximum was 99.7%.

The minimum USDC reserve growth was 0.2%, and the maximum was 9.4%. The average USDC reserve growth was 3.0%.

The comet accumulated $12.97k USDC reserves while distributing $189.44k COMP rewards for a weekly Net Protocol Profit of -$176.47k.

[Gauntlet] Ethereum v3 USDC Update (08/11/2023 - 08/17/2023)

Gauntlet would like to provide the community with an update on metrics from the Ethereum v3 USDC comet over the past week.

Simple Summary

  • USDC Borrows are down 12.18%, from $396.27M to $348.01M.
  • USDC Supply is up 2.14%, from $398.26M to $406.77M.
  • USDC utilization decreased 14.23%, from 99.5% to 85.3%.
  • The minimum USDC reserve growth was -0.9%, and the maximum was 14.3%. The average USDC reserve growth was 7.4%.
  • The comet accumulated $28.21k USDC reserves while distributing $171.5k COMP rewards for a weekly Net Protocol Profit of -$143.29k.

Note that, as of today, USDC supply has decreased to $351M and USDC borrows have decreased to $298M. These updates will be included in the weekly update next week.

A large reason USDC borrows have decreased is due to liquidations in the recent market downturn, particularly the user with address 0x930af7923b8b5f8d3461ad1999ceeb8a62884b19. This user supplied $35.97M collateral (98.5% WETH, 1.5% COMP) and borrowed $28.37M USDC.

As a result of the recent liquidations, Ethereum v3 USDC reserves have increased from $1.39M to $2.93M (+$1.54M), effectively increasing total Compound USDC reserves across v2 and v3 comets by ~10%.

Analysis

Below are metrics of the market and parameters over the past week. Note that collateral supply values are normalized to end date token prices, in order to get an idea of intentional user behavior as opposed to fluctuations in underlying token prices.

Market Growth

Total Collateral (USD) is down 7.57%, from $703.19M to $649.94M.

USDC Supply is up 2.14%, from $398.26M to $406.77M.

USDC Borrows are down 12.18%, from $396.27M to $348.01M.

USDC utilization decreased 14.23%, from 99.5% to 85.3%.

As seen above, only COMP (91.1%) has a supply cap utilization> 75%. We recommend not increasing the COMP supply cap due to lower liquidity.

Above is a time series of supply cap utilization for each asset over the past week.

Utilization and Reserves

The minimum USDC utilization was 85.3%, and the maximum was 100.3%.

The minimum USDC reserve growth was -0.9%, and the maximum was 14.3%. The average USDC reserve growth was 7.4%.

The comet accumulated $28.21k USDC reserves while distributing $171.5k COMP rewards for a weekly Net Protocol Profit of -$143.29k.

2 Likes

[Gauntlet] Ethereum v3 USDC Update (08/18/2023 - 08/24/2023)

Gauntlet would like to provide the community with an update on metrics from the Ethereum v3 USDC comet over the past week.

Simple Summary

  • USDC Borrows are down 21.76%, from $348.01M to $272.28M.
  • USDC Supply is down 19.38%, from $406.77M to $327.93M.
  • USDC utilization decreased 2.95%, from 85.6% to 83.0%.
  • The minimum USDC reserve growth was 9.3%, and the maximum was 14.2%. The average USDC reserve growth was 11.8%.
  • The comet accumulated $23.73k USDC reserves while distributing $142.46k COMP rewards for a weekly Net Protocol Profit of -$118.73k.

Analysis

Below are metrics of the market and parameters over the past week. Note that collateral supply values are normalized to end date token prices, in order to get an idea of intentional user behavior as opposed to fluctuations in underlying token prices.

Market Growth

Total Collateral (USD) is down 14.19%, from $600.32M to $515.12M.

USDC Supply is down 19.38%, from $406.77M to $327.93M.

USDC Borrows are down 21.76%, from $348.01M to $272.28M.

USDC utilization decreased 2.95%, from 85.6% to 83.0%.

Supply Caps

As seen above, only COMP (91.9%) has a supply cap utilization > 75%. We do not recommend increasing the COMP supply cap due to lower liquidity.

Above is a time series of supply cap utilization for each asset over the past week.

Utilization and Reserves

The minimum USDC utilization was 82.6%, and the maximum was 89.0%.

The minimum USDC reserve growth was 9.3%, and the maximum was 14.2%. The average USDC reserve growth was 11.8%.

The comet accumulated $23.73k USDC reserves while distributing $142.46k COMP rewards for a weekly Net Protocol Profit of -$118.73k.

1 Like

[Gauntlet] Ethereum v3 USDC Update (08/25/2023 - 08/31/2023)

Gauntlet would like to provide the community with an update on metrics from the Ethereum v3 USDC comet over the past week.

Simple Summary

  • USDC Borrows are up 4.19%, from $272.28M to $283.68M.
  • USDC Supply is down 2.57%, from $327.93M to $319.52M.
  • USDC utilization increased 6.56%, from 83.0% to 88.5%.
  • The minimum USDC reserve growth was 9.6%, and the maximum was 14.3%. The average USDC reserve growth was 11.4%.
  • The comet accumulated $23.06k USDC reserves while distributing $141.9k COMP rewards for a weekly Net Protocol Profit of $-118.84k.

Analysis

Below are metrics of the market and parameters over the past week. Note that collateral supply values are normalized to end date token prices, in order to get an idea of intentional user behavior as opposed to fluctuations in underlying token prices.

Market Growth

Total Collateral (USD) is up 4.56%, from $524.75M to $548.66M.

USDC Supply is down 2.57%, from $327.93M to $319.52M.

USDC Borrows are up 4.19%, from $272.28M to $283.68M.

USDC utilization increased 6.56%, from 83.0% to 88.5%.

Supply Caps

Above are the current supply cap utilizations for each collateral asset.

Above is a time series of supply cap utilization for each asset over the past week.

Utilization and Reserves

The minimum USDC utilization was 83.0%, and the maximum was 89.1%.

The minimum USDC reserve growth was 9.6%, and the maximum was 14.3%. The average USDC reserve growth was 11.4%.

The comet accumulated $23.06k USDC reserves while distributing $141.9k COMP rewards for a weekly Net Protocol Profit of $-118.84k.

[Gauntlet] Ethereum v3 USDC Update (09/01/2023 - 09/07/2023)

Gauntlet would like to provide the community with an update on metrics from the Ethereum v3 USDC comet over the past week.

Simple Summary

  • USDC Borrows are down 0.25%, from $283.68M to $282.97M.
  • USDC Supply is up 0.04%, from $319.52M to $319.65M.
  • USDC utilization decreased 0.29%, from 88.8% to 88.5%.
  • The minimum USDC reserve growth was 11.8%, and the maximum was 15.4%. The average USDC reserve growth was 14.3%.
  • The comet accumulated $30.61k USDC reserves while distributing $134.49k COMP rewards for a weekly Net Protocol Profit of $-103.88k.

Analysis

Below are metrics of the market and parameters over the past week. Note that collateral supply values are normalized to end date token prices, in order to get an idea of intentional user behavior as opposed to fluctuations in underlying token prices.

Market Growth

Total Collateral (USD) is up 2.89%, from $521.13M to $536.22M.

USDC Supply is up 0.04%, from $319.52M to $319.65M.

USDC Borrows are down 0.25%, from $283.68M to $282.97M.

USDC utilization decreased 0.29%, from 88.8% to 88.5%.

Supply Caps

Above are the current supply cap utilizations for each collateral asset.

Above is a time series of supply cap utilization for each asset over the past week.

Utilization and Reserves

The minimum USDC utilization was 85.7%, and the maximum was 90.7%.

The minimum USDC reserve growth was 11.8%, and the maximum was 15.4%. The average USDC reserve growth was 14.3%.

The comet accumulated $30.61k USDC reserves while distributing $134.49k COMP rewards for a weekly Net Protocol Profit of $-103.88k.

2 Likes

[Gauntlet] Ethereum v3 USDC Update (09/08/2023 - 09/14/2023)

Gauntlet would like to provide the community with an update on metrics from the Ethereum v3 USDC comet over the past week.

Simple Summary

  • USDC Borrows are up 2.30%, from $282.41M to $288.9M.
  • USDC Supply is down 2.25%, from $319.29M to $312.1M.
  • USDC utilization increased 4.64%, from 88.5% to 92.6%.
  • The minimum USDC reserve growth was 13.8%, and the maximum was 17.4%. The average USDC reserve growth was 16.7%.
  • The comet accumulated $37.55k USDC reserves while distributing $127.98k COMP rewards for a weekly Net Protocol Profit of $-90.43k.

Analysis

Below are metrics of the market and parameters over the past week. Note that collateral supply values are normalized to end date token prices, in order to get an idea of intentional user behavior as opposed to fluctuations in underlying token prices.

Market Growth

Total Collateral (USD) is up 3.15%, from $537.2M to $554.11M.

USDC Supply is down 2.25%, from $319.29M to $312.1M.

USDC Borrows are up 2.30%, from $282.41M to $288.9M.

USDC utilization increased 4.64%, from 88.5% to 92.6%.

Supply Caps


Above are the current supply cap utilizations for each collateral asset.

Above is a time series of supply cap utilization for each asset over the past week.

Utilization and Reserves

The minimum USDC utilization was 88.4%, and the maximum was 93.5%.
The minimum USDC reserve growth was 13.8%, and the maximum was 17.4%. The average USDC reserve growth was 16.7%.

The comet accumulated $37.55k USDC reserves while distributing $127.98k COMP rewards for a weekly Net Protocol Profit of $-90.43k.

[Gauntlet] Ethereum v3 USDC Update (09/15/2023 - 09/21/2023)

Gauntlet would like to provide the community with an update on metrics from the Ethereum v3 USDC comet over the past week.

Simple Summary

  • USDC Borrows are up 2.37%, from $288.9M to $295.75M.
  • USDC Supply is up 8.30%, from $312.1M to $337.99M.
  • USDC utilization decreased 5.47%, from 92.6% to 87.6%.
  • The minimum USDC reserve growth was 13.2%, and the maximum was 17.6%. The average USDC reserve growth was 15.6%.
  • The comet accumulated $36.73k USDC reserves while distributing $157.59k COMP rewards for a weekly Net Protocol Profit of $-120.86k.

Analysis

Below are metrics of the market and parameters over the past week. Note that collateral supply values are normalized to end date token prices, in order to get an idea of intentional user behavior as opposed to fluctuations in underlying token prices.

Market Growth

Total Collateral (USD) is up 1.91%, from $568.11M to $578.98M.

USDC Supply is up 8.30%, from $312.1M to $337.99M.

USDC Borrows are up 2.37%, from $288.9M to $295.75M.

USDC utilization decreased 5.47%, from 92.6% to 87.6%.

Supply Caps

Above are the current supply cap utilizations for each collateral asset.

Above is a time series of supply cap utilization for each asset over the past week.

Utilization and Reserves

The minimum USDC utilization was 87.6%, and the maximum was 93.9%.

The minimum USDC reserve growth was 13.2%, and the maximum was 17.6%. The average USDC reserve growth was 15.6%.

The comet accumulated $36.73k USDC reserves while distributing $157.59k COMP rewards for a weekly Net Protocol Profit of $-120.86k.

[Gauntlet] Ethereum v3 USDC Update (09/22/2023 - 09/28/2023)

Gauntlet would like to provide the community with an update on metrics from the Ethereum v3 USDC comet over the past week.

Simple Summary

  • USDC Borrows are down 1.79%, from $295.75M to $290.45M.
  • USDC Supply is down 1.08%, from $337.99M to $334.35M.
  • USDC utilization increased 0.84%, from 87.6% to 88.3%.
  • The minimum USDC reserve growth was 12.8%, and the maximum was 14.1%. The average USDC reserve growth was 13.5%.
  • The comet accumulated $30.36k USDC reserves while distributing $183.45k COMP rewards for a weekly Net Protocol Profit of $-153.09k.

Analysis

Below are metrics of the market and parameters over the past week. Note that collateral supply values are normalized to end date token prices, in order to get an idea of intentional user behavior as opposed to fluctuations in underlying token prices.

Market Growth

Total Collateral (USD) is down 0.49%, from $567.45M to $564.7M.

USDC Supply is down 1.08%, from $337.99M to $334.35M.

USDC Borrows are down 1.79%, from $295.75M to $290.45M.

USDC utilization increased 0.84%, from 87.6% to 88.3%.

Supply Caps

Above are the current supply cap utilizations for each collateral asset.

Above is a time series of supply cap utilization for each asset over the past week.

Utilization and Reserves

The minimum USDC utilization was 87.1%, and the maximum was 88.9%.

The minimum USDC reserve growth was 12.8%, and the maximum was 14.1%. The average USDC reserve growth was 13.5%.

The comet accumulated $30.36k USDC reserves while distributing $183.45k COMP rewards for a weekly Net Protocol Profit of $-153.09k.

[Gauntlet] Ethereum v3 USDC Update (09/29/2023 - 10/05/2023)

Gauntlet would like to provide the community with an update on metrics from the Ethereum v3 USDC comet over the past week.

Simple Summary

  • USDC Borrows are up 4.89%, from $290.94M to $305.18M.
  • USDC Supply is up 2.92%, from $334.66M to $344.42M.
  • USDC utilization increased 1.92%, from 86.9% to 88.6%.
  • The minimum USDC reserve growth was 11.8%, and the maximum was 15.0%. The average USDC reserve growth was 13.3%.
  • The comet accumulated $29.64k USDC reserves while distributing $203.75k COMP rewards for a weekly Net Protocol Profit of $-174.11k.

Analysis

Below are metrics of the market and parameters over the past week. Note that collateral supply values are normalized to end date token prices, in order to get an idea of intentional user behavior as opposed to fluctuations in underlying token prices.

Market Growth

Total Collateral (USD) is up 3.35%, from $591.64M to $611.45M.

USDC Supply is up 2.92%, from $334.66M to $344.42M.

USDC Borrows are up 4.89%, from $290.94M to $305.18M.

USDC utilization increased 1.92%, from 86.9% to 88.6%.

Supply Caps

Above are the current supply cap utilizations for each collateral asset.

Above is a time series of supply cap utilization for each asset over the past week.

Utilization and Reserves

The minimum USDC utilization was 85.8%, and the maximum was 90.1%.

The minimum USDC reserve growth was 11.8%, and the maximum was 15.0%. The average USDC reserve growth was 13.3%.

The comet accumulated $29.64k USDC reserves while distributing $203.75k COMP rewards for a weekly Net Protocol Profit of $-174.11k.

[Gauntlet] Ethereum v3 USDC Update (10/06/2023 - 10/12/2023)

Gauntlet would like to provide the community with an update on metrics from the Ethereum v3 USDC comet over the past week.

Simple Summary

  • USDC Borrows are down 7.94%, from $305.18M to $280.95M.
  • USDC Supply is down 9.93%, from $344.42M to $310.2M.
  • USDC utilization increased 2.21%, from 88.6% to 90.6%.
  • The minimum USDC reserve growth was 13.6%, and the maximum was 16.1%. The average USDC reserve growth was 14.5%.
  • The comet accumulated $33.93k USDC reserves while distributing $188.29k COMP rewards for a weekly Net Protocol Profit of $-154.37k.

Analysis

Below are metrics of the market and parameters over the past week. Note that collateral supply values are normalized to end date token prices, in order to get an idea of intentional user behavior as opposed to fluctuations in underlying token prices.

Market Growth

Total Collateral (USD) is down 5.23%, from $587.08M to $556.35M.

USDC Supply is down 9.93%, from $344.42M to $310.2M.

USDC Borrows are down 7.94%, from $305.18M to $280.95M.

USDC utilization increased 2.21%, from 88.6% to 90.6%.

Supply Caps

Above are the current supply cap utilizations for each collateral asset.

Above is a time series of supply cap utilization for each asset over the past week.

Utilization and Reserves

The minimum USDC utilization was 88.2%, and the maximum was 91.7%.
The minimum USDC reserve growth was 13.6%, and the maximum was 16.1%. The average USDC reserve growth was 14.5%.

The comet accumulated $33.93k USDC reserves while distributing $188.29k COMP rewards for a weekly Net Protocol Profit of $-154.37k.

[Gauntlet] Ethereum v3 USDC Update (10/13/2023 - 10/19/2023)

Gauntlet would like to provide the community with an update on metrics from the Ethereum v3 USDC comet over the past week.

Simple Summary

  • USDC Borrows are up 4.51%, from $280.95M to $293.61M.
  • USDC Supply is up 1.52%, from $310.2M to $314.92M.
  • USDC utilization increased 2.94%, from 90.6% to 93.2%.
  • The minimum USDC reserve growth was 11.8%, and the maximum was 16.9%. The average USDC reserve growth was 16.0%.
  • The comet accumulated $36.09k USDC reserves while distributing $180.41k COMP rewards for a weekly Net Protocol Profit of $-144.32k.

Analysis

Below are metrics of the market and parameters over the past week. Note that collateral supply values are normalized to end date token prices, in order to get an idea of intentional user behavior as opposed to fluctuations in underlying token prices.

Market Growth

Total Collateral (USD) is up 2.92%, from $573.28M to $590.0M.

USDC Supply is up 1.52%, from $310.2M to $314.92M.

USDC Borrows are up 4.51%, from $280.95M to $293.61M.

USDC utilization increased 2.94%, from 90.6% to 93.2%.

Supply Caps

Above are the current supply cap utilizations for each collateral asset.

Above is a time series of supply cap utilization for each asset over the past week.

Utilization and Reserves

The minimum USDC utilization was 90.4%, and the maximum was 93.9%.

The minimum USDC reserve growth was 11.8%, and the maximum was 16.9%. The average USDC reserve growth was 16.0%.

The comet accumulated $36.09k USDC reserves while distributing $180.41k COMP rewards for a weekly Net Protocol Profit of $-144.32k.

[Gauntlet] Ethereum v3 USDC Update (10/20/2023 - 10/26/2023)

Gauntlet would like to provide the community with an update on metrics from the Ethereum v3 USDC comet over the past week.

Simple Summary

  • USDC Borrows are up 10.22%, from $293.61M to $323.6M.
  • USDC Supply is up 10.15%, from $314.92M to $346.9M.
  • USDC utilization increased 0.10%, from 93.2% to 93.3%.
  • The minimum USDC reserve growth was 7.6%, and the maximum was 17.0%. The average USDC reserve growth was 13.7%.
  • The comet accumulated $37.46k USDC reserves while distributing $196.85k COMP rewards for a weekly Net Protocol Profit of $-159.39k.

Analysis

Below are metrics of the market and parameters over the past week. Note that collateral supply values are normalized to end date token prices, in order to get an idea of intentional user behavior as opposed to fluctuations in underlying token prices.

Market Growth

Total Collateral (USD) is up 6.65%, from $705.54M to $752.45M.

USDC Supply is up 10.15%, from $314.92M to $346.9M.

USDC Borrows are up 10.22%, from $293.61M to $323.6M.

USDC utilization increased 0.10%, from 93.2% to 93.3%.

Supply Caps

Above are the current supply cap utilizations for each collateral asset.

Above is a time series of supply cap utilization for each asset over the past week.

Utilization and Reserves

The minimum USDC utilization was 89.4%, and the maximum was 95.6%.
The minimum USDC reserve growth was 7.6%, and the maximum was 17.0%. The average USDC reserve growth was 13.7%.

The comet accumulated $37.46k USDC reserves while distributing $196.85k COMP rewards for a weekly Net Protocol Profit of $-159.39k.

[Gauntlet] Ethereum v3 USDC Update (10/27/2023 - 11/02/2023)

Gauntlet would like to provide the community with an update on metrics from the Ethereum v3 USDC comet over the past week.

Simple Summary

  • USDC Borrows are up 6.75%, from $323.6M to $345.45M.
  • USDC Supply is up 5.43%, from $346.9M to $365.74M.
  • USDC utilization increased 1.25%, from 93.3% to 94.4%.
  • The minimum USDC reserve growth was 6.5%, and the maximum was 17.0%. The average USDC reserve growth was 12.4%.
  • The comet accumulated $41.55k USDC reserves while distributing $206.9k COMP rewards for a weekly Net Protocol Profit of $-165.36k.

Analysis

Below are metrics of the market and parameters over the past week. Note that collateral supply values are normalized to end date token prices, in order to get an idea of intentional user behavior as opposed to fluctuations in underlying token prices.

Market Growth

Total Collateral (USD) is up 2.02%, from $776.59M to $792.28M.

USDC Supply is up 5.43%, from $346.9M to $365.74M.

USDC Borrows are up 6.75%, from $323.6M to $345.45M.

USDC utilization increased 1.25%, from 93.3% to 94.4%.

Supply Caps

Above are the current supply cap utilizations for each collateral asset.

Above is a time series of supply cap utilization for each asset over the past week.

Utilization and Reserves

The minimum USDC utilization was 90.9%, and the maximum was 96.9%.
The minimum USDC reserve growth was 6.5%, and the maximum was 17.0%. The average USDC reserve growth was 12.4%.

The comet accumulated $41.55k USDC reserves while distributing $206.9k COMP rewards for a weekly Net Protocol Profit of $-165.36k.

[Gauntlet] Ethereum v3 USDC Update: (11/03/2023 - 11/09/2023)

Gauntlet would like to provide the community with an update on the USDC comet over the past week.

Simple Summary

  • USDC Borrows decreased 0.4%, from $345.48M to $344.1M.
  • USDC Supply increased 0.04%, from $365.79M to $365.95M.
  • USDC utilization decreased 0.44%, from 94.45% to 94.03%.
  • The minimum USDC reserve growth was 6.67%, and the maximum was 17.0%. The average USDC reserve growth was 11.28%.
  • The comet accumulated $42.4k USDC reserves while distributing $225.41k COMP rewards for a weekly Net Protocol Profit of $-183.01k.

Collateral Asset Supply

This graph shows the time series of total supply of all collateral assets.

To see updated statistics, please see the live version of this graph here.

Base Asset Borrows

This graph shows the time series of total borrows of the base asset.

To see updated statistics, please see the live version of this graph here.

Utilization

This graph shows the utilization (borrow / supply) of the base asset over the past week.

Supply Cap Usage

This graph shows the supply cap usage (supply / supply cap) of all collateral assets over the past week.

[Gauntlet] Ethereum v3 USDC Update: (11/10/23 - 11/16/23)

Gauntlet would like to provide the community with an update on the Ethereum v3 USDC comet over the past week.

Simple Summary

  • USDC Borrows increased 4.28%, from $350.15M to $365.12M.
  • USDC Supply increased 4.85%, from $368.84M to $386.74M.
  • USDC utilization decreased 0.55%, from 94.93% to 94.41%.
  • The minimum USDC reserve growth was 7.03%, and the maximum was 17.0%. The average USDC reserve growth was 10.06%.
  • The comet accumulated $37.09K USDC reserves while distributing $208.06K COMP rewards for a weekly Net Protocol Profit of $-170.98K.

Collateral Asset Supply

This graph shows the time series of total supply of all collateral assets.

To see updated statistics, please see the live version of this graph here.

USDC Borrows

This graph shows the time series of USDC borrows.

To see updated statistics, please see the live version of this graph here.

Utilization

This graph shows the utilization (borrow / supply) of USDC over the past week.

Supply Cap Usage

This graph shows the supply cap usage (supply / supply cap) of all collateral assets over the past week.

[Gauntlet] Ethereum v3 USDC Update: (11/17/23 - 11/23/23)

Gauntlet would like to provide the community with an update on the Ethereum v3 USDC comet over the past week.

Simple Summary

  • USDC Borrows increased 2.36%, from $358.6M to $367.07M.
  • USDC Supply increased 0.51%, from $387.31M to $389.29M.
  • USDC utilization increased 1.84%, from 92.59% to 94.29%.
  • The minimum USDC reserve growth was 7.12%, and the maximum was 16.96%. The average USDC reserve growth was 10.98%.
  • The comet accumulated $37.32K USDC reserves while distributing $194.86K COMP rewards for a weekly Net Protocol Profit of $-157.54K.

Asset Supply

This graph shows the time series of total supply of all assets.

To see updated statistics, please see the live version of this graph here.

USDC Borrows

This graph shows the time series of USDC borrows.

To see updated statistics, please see the live version of this graph here.

Utilization

This graph shows the utilization (borrow / supply) of USDC over the past week.

Supply Cap Usage

This graph shows the supply cap usage (supply / supply cap) of all collateral assets over the past week.

[Gauntlet] Ethereum v3 USDC Update: (11/24/23 - 11/30/23)

Gauntlet would like to provide the community with an update on the Ethereum v3 USDC comet over the past week.

Simple Summary

  • USDC Borrows decreased 5.92%, from $370.37M to $348.42M.
  • USDC Supply decreased 5.04%, from $391.14M to $371.41M.
  • USDC utilization decreased 0.93%, from 94.69% to 93.81%.
  • The minimum USDC reserve growth was 8.88%, and the maximum was 16.61%. The average USDC reserve growth was 14.11%.
  • The comet accumulated $33.87K USDC reserves while distributing $198.02K COMP rewards for a weekly Net Protocol Profit of $-164.15K.

Asset Supply

This graph shows the time series of total supply of all assets.

To see updated statistics, please see the live version of this graph here.

USDC Borrows

This graph shows the time series of USDC borrows.

To see updated statistics, please see the live version of this graph here.

Utilization

This graph shows the utilization (borrow / supply) of USDC over the past week.

Supply Cap Usage

This graph shows the supply cap usage (supply / supply cap) of all collateral assets over the past week.

[Gauntlet] Ethereum v3 USDC Update: (12/1/23 - 12/7/23)

Gauntlet would like to provide the community with an update on the Ethereum v3 USDC comet over the past week.

Simple Summary

  • USDC Borrows increased 2.72%, from $349.44M to $358.93M.
  • USDC Supply increased 2.98%, from $372.78M to $383.89M.
  • USDC utilization decreased 0.26%, from 93.74% to 93.5%.
  • The minimum USDC reserve growth was 7.17%, and the maximum was 15.08%. The average USDC reserve growth was 9.69%.
  • The comet accumulated $30.27K USDC reserves while distributing $165.17K COMP rewards for a weekly Net Protocol Profit of $-134.9K.

Asset Supply

This graph shows the time series of total supply of all assets.

To see updated statistics, please see the live version of this graph here.

USDC Borrows

This graph shows the time series of USDC borrows.

To see updated statistics, please see the live version of this graph here.

Utilization

This graph shows the utilization (borrow / supply) of USDC over the past week.

Supply Cap Usage

This graph shows the supply cap usage (supply / supply cap) of all collateral assets over the past week.