[Gauntlet] Scroll USDC Comet Update: (2024-04-15 through 2024-04-21)
Gauntlet would like to provide the community with an update on the Scroll USDC comet over the past week.
Simple Summary
-
USDC Borrows increased 159.98%, from $19.80K to $51.47K.
-
USDC Supply increased 172.00%, from $27.31K to $74.29K.
-
USDC utilization decreased 4.42%, from 72.48% to 69.28%.
-
The minimum USDC reserve growth was -26.80%, and the maximum was 19.97%. The average USDC reserve growth was -0.56%.
-
The comet accumulated $1.54 USDC reserves while distributing $0.00 COMP rewards for a weekly Net Protocol Profit of $1.54.
Base Asset APR Trend
Reserve Analysis
COMP Rewards Analysis
| Chain |
CometRewards COMP token holdings |
Daily aggregate COMP token reward distributions |
Remaining days of rewards runway (not including existing claimable rewards) |
| Scroll |
0.00 |
0.00 |
0.00 |
Collateral Asset Supply
This graph shows the total supply of all collateral assets over the past week.
To see updated statistics, please see the live version of this graph here.
Base Asset Borrows
This graph shows the total borrows of the base asset over the past week.
To see updated statistics, please see the live version of this graph here.
Utilization
This graph shows the utilization (borrow / supply) of the base asset over the past week.
Supply Cap Usage
This graph shows the supply cap usage (supply / supply cap) of all collateral assets over the past week.
[Gauntlet] Scroll USDC Comet Update: (2024-04-22 through 2024-04-28)
Gauntlet would like to provide the community with an update on the Scroll USDC comet over the past week. We have reviewed the markets and no IR adjustments are necessary at this time.
Simple Summary
-
USDC Borrows increased 9.51%, from $51.47K to $56.37K.
-
USDC Supply decreased 4.41%, from $74.37K to $71.09K.
-
USDC utilization increased 14.57%, from 69.21% to 79.29%.
-
The minimum USDC reserve growth was -10.18%, and the maximum was 18.55%. The average USDC reserve growth was 5.73%.
-
The comet accumulated $4.90 USDC reserves while distributing $0.00 COMP rewards for a weekly Net Protocol Profit of $4.90.
Base Asset APR Trend
Reserve Analysis
COMP Rewards Analysis
| Chain |
CometRewards COMP token holdings |
Daily aggregate COMP token reward distributions |
Remaining days of rewards runway (not including existing claimable rewards) |
| Scroll |
0.00 |
0.00 |
0.00 |
Collateral Asset Supply
This graph shows the total supply of all collateral assets over the past week.
To see updated statistics, please see the live version of this graph here.
Base Asset Borrows
This graph shows the total borrows of the base asset over the past week.
To see updated statistics, please see the live version of this graph here.
Utilization
This graph shows the utilization (borrow / supply) of the base asset over the past week.
Supply Cap Usage
This graph shows the supply cap usage (supply / supply cap) of all collateral assets over the past week.
1 Like
[Gauntlet] Scroll USDC Comet Update: (2024-04-29 through 2024-05-05)
Gauntlet would like to provide the community with an update on the Scroll USDC comet over the past week.
Simple Summary
-
USDC Borrows increased 67.26%, from $57.50K to $96.17K.
-
USDC Supply increased 54.16%, from $73.37K to $113.10K.
-
USDC utilization increased 8.50%, from 78.37% to 85.03%.
-
The minimum USDC reserve growth was 4.94%, and the maximum was 20.03%. The average USDC reserve growth was 14.49%.
-
The comet accumulated $19.19 USDC reserves while distributing $0.00 COMP rewards for a weekly Net Protocol Profit of $19.19.
Base Asset APR Trend
Reserve Analysis
COMP Rewards Analysis
| Chain |
CometRewards COMP token holdings |
Daily aggregate COMP token reward distributions |
Remaining days of rewards runway (not including existing claimable rewards) |
| Scroll |
0.00 |
0.00 |
0.00 |
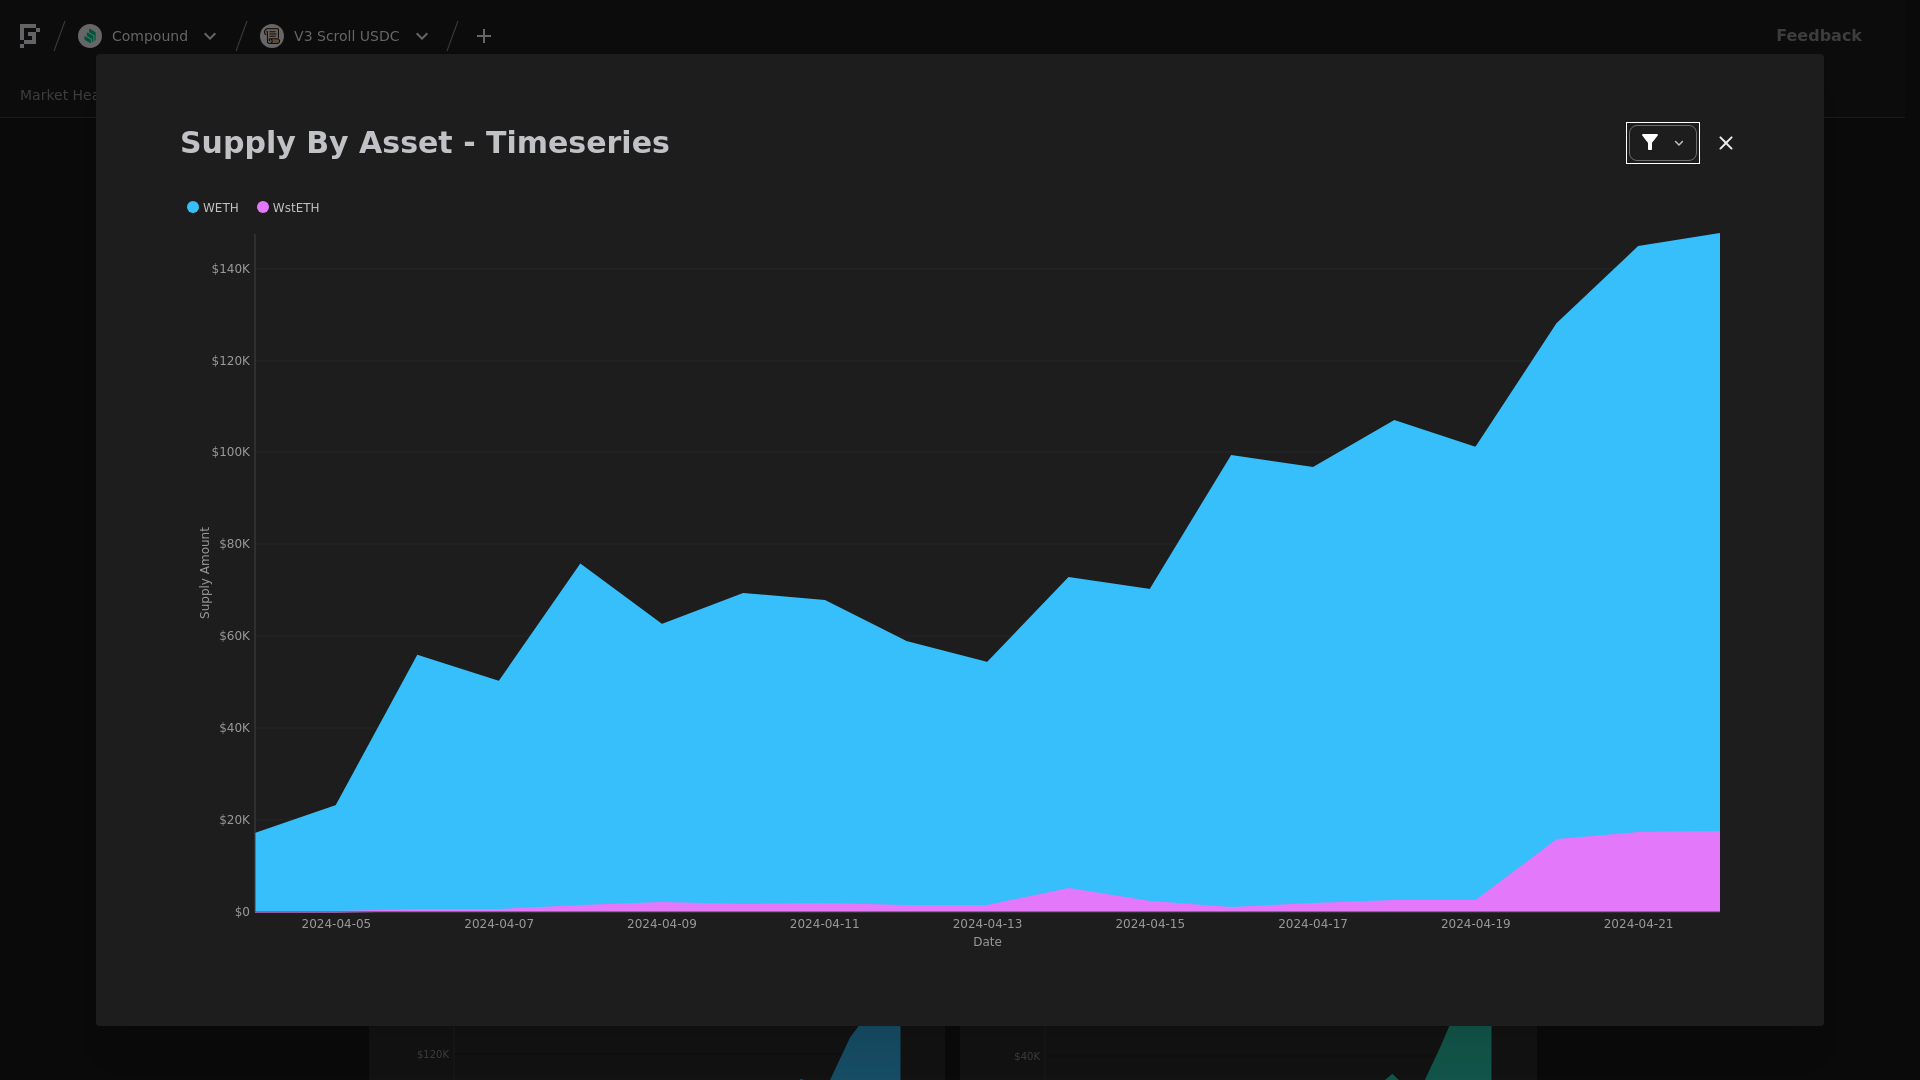
Collateral Asset Supply
This graph shows the total supply of all collateral assets over the past week.
To see updated statistics, please see the live version of this graph here.
Base Asset Borrows
This graph shows the total borrows of the base asset over the past week.
To see updated statistics, please see the live version of this graph here.
Utilization
This graph shows the utilization (borrow / supply) of the base asset over the past week.
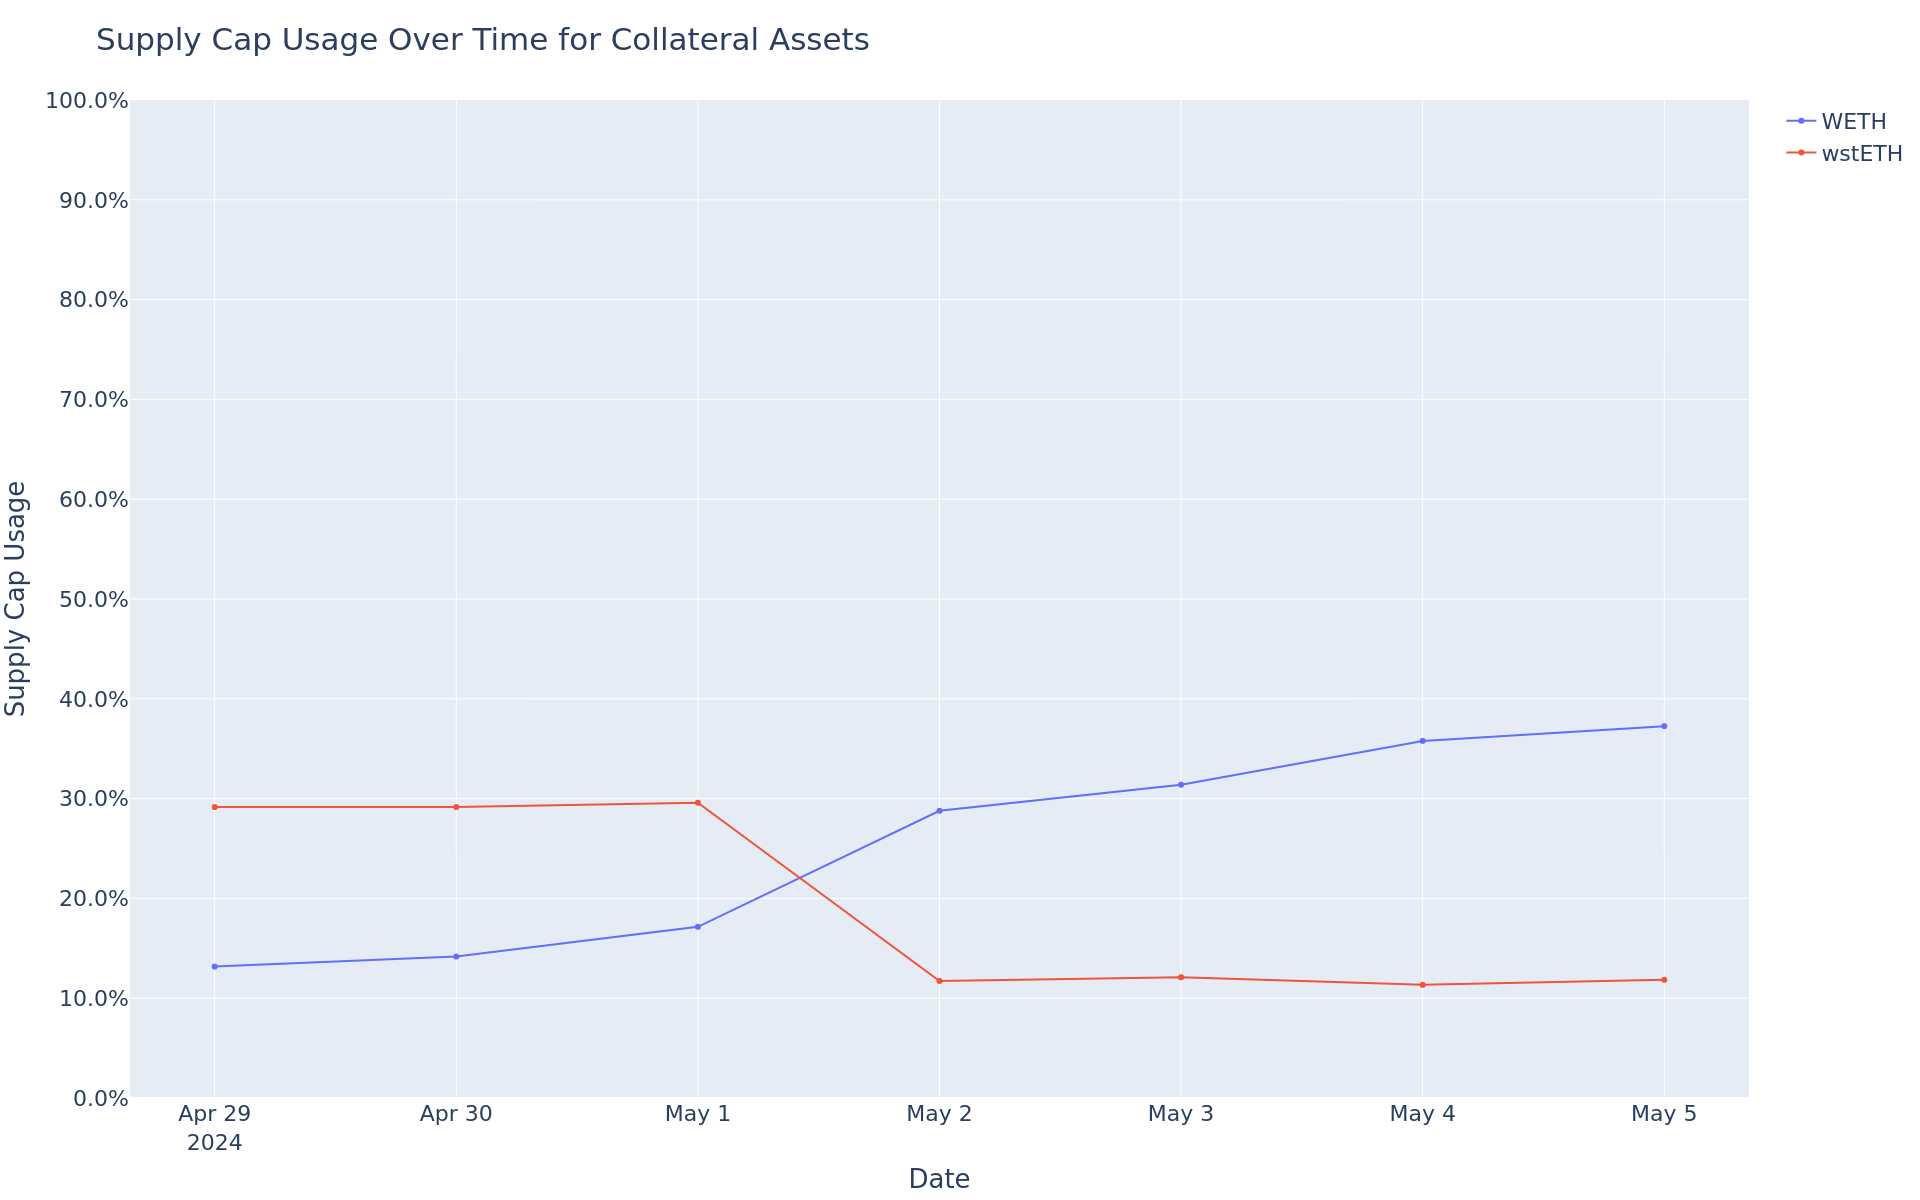
Supply Cap Usage
This graph shows the supply cap usage (supply / supply cap) of all collateral assets over the past week.
[Gauntlet] Scroll USDC Comet Update: (2024-05-06 through 2024-05-12)
Gauntlet would like to provide the community with an update on the Scroll USDC comet over the past week.
Simple Summary
-
USDC Borrows increased 58.91%, from $96.24K to $152.93K.
-
USDC Supply increased 58.89%, from $113.59K to $180.48K.
-
USDC utilization did not change, remaining at 84.72%.
-
The minimum USDC reserve growth was 10.52%, and the maximum was 19.88%. The average USDC reserve growth was 13.34%.
-
The comet accumulated $61.51 USDC reserves while distributing $0.00 COMP rewards for a weekly Net Protocol Profit of $61.51.
Base Asset APR Trend
Reserve Analysis
COMP Rewards Analysis
| Chain |
CometRewards COMP token holdings |
Daily aggregate COMP token reward distributions |
Remaining days of rewards runway (not including existing claimable rewards) |
| Scroll |
0.00 |
0.00 |
0.00 |
Collateral Asset Supply
This graph shows the total supply of all collateral assets over the past week.
To see updated statistics, please see the live version of this graph here.
Base Asset Borrows
This graph shows the total borrows of the base asset over the past week.
To see updated statistics, please see the live version of this graph here.
Utilization
This graph shows the utilization (borrow / supply) of the base asset over the past week.
Supply Cap Usage
This graph shows the supply cap usage (supply / supply cap) of all collateral assets over the past week.
1 Like
[Gauntlet] Scroll USDC Comet Update: (2024-05-13 through 2024-05-19)
Gauntlet would like to provide the community with an update on the Scroll USDC comet over the past week.
Simple Summary
-
USDC Borrows decreased 5.72%, from $150.09K to $141.51K.
-
USDC Supply decreased 5.31%, from $178.37K to $168.90K.
-
USDC utilization did not change, remaining at 84.14%.
-
The minimum USDC reserve growth was 10.52%, and the maximum was 19.81%. The average USDC reserve growth was 13.43%.
-
The comet accumulated $43.40 USDC reserves while distributing $0.00 COMP rewards for a weekly Net Protocol Profit of $43.40.
Base Asset APR Trend
Reserve Analysis
COMP Rewards Analysis
| Chain |
CometRewards COMP token holdings |
Daily aggregate COMP token reward distributions |
Remaining days of rewards runway (not including existing claimable rewards) |
| Scroll |
0.00 |
0.00 |
0.00 |
Collateral Asset Supply
This graph shows the total supply of all collateral assets over the past week.
To see updated statistics, please see the live version of this graph here.
Base Asset Borrows
This graph shows the total borrows of the base asset over the past week.
To see updated statistics, please see the live version of this graph here.
Utilization
This graph shows the utilization (borrow / supply) of the base asset over the past week.
Supply Cap Usage
This graph shows the supply cap usage (supply / supply cap) of all collateral assets over the past week.
[Gauntlet] Scroll USDC Comet Update: (2024-05-20 through 2024-05-26)
Gauntlet would like to provide the community with an update on the Scroll USDC comet over the past week.
Simple Summary
-
USDC Borrows increased 28.64%, from $142.23K to $182.96K.
-
USDC Supply increased 27.09%, from $168.90K to $214.65K.
-
USDC utilization increased 1.22%, from 84.21% to 85.24%.
-
The minimum USDC reserve growth was 10.52%, and the maximum was 19.97%. The average USDC reserve growth was 14.54%.
-
The comet accumulated $59.78 USDC reserves while distributing $0.00 COMP rewards for a weekly Net Protocol Profit of $59.78.
Base Asset APR Trend
Reserve Analysis
COMP Rewards Analysis
| Chain |
CometRewards COMP token holdings |
Daily aggregate COMP token reward distributions |
Remaining days of rewards runway (not including existing claimable rewards) |
| Scroll |
0.00 |
0.00 |
0.00 |
Collateral Asset Supply
This graph shows the total supply of all collateral assets over the past week.
To see updated statistics, please see the live version of this graph here.
Base Asset Borrows
This graph shows the total borrows of the base asset over the past week.
To see updated statistics, please see the live version of this graph here.
Utilization
This graph shows the utilization (borrow / supply) of the base asset over the past week.
Supply Cap Usage
This graph shows the supply cap usage (supply / supply cap) of all collateral assets over the past week.
[Gauntlet] Scroll USDC Comet Update: (2024-05-27 through 2024-06-02)
Gauntlet would like to provide the community with an update on the Scroll USDC comet over the past week.
Simple Summary
-
USDC Borrows decreased 5.87%, from $177.49K to $167.08K.
-
USDC Supply decreased 7.05%, from $215.02K to $199.87K.
-
USDC utilization increased 1.27%, from 82.55% to 83.59%.
-
The minimum USDC reserve growth was 10.52%, and the maximum was 20.04%. The average USDC reserve growth was 14.74%.
-
The comet accumulated $46.06 USDC reserves while distributing $0.00 COMP rewards for a weekly Net Protocol Profit of $46.06.
Base Asset APR Trend
Reserve Analysis
COMP Rewards Analysis
| Chain |
CometRewards COMP token holdings |
Daily aggregate COMP token reward distributions |
Remaining days of rewards runway (not including existing claimable rewards) |
| Scroll |
0.00 |
0.00 |
0.00 |
Collateral Asset Supply
This graph shows the total supply of all collateral assets over the past week.
To see updated statistics, please see the live version of this graph here.
Base Asset Borrows
This graph shows the total borrows of the base asset over the past week.
To see updated statistics, please see the live version of this graph here.
Utilization
This graph shows the utilization (borrow / supply) of the base asset over the past week.
Supply Cap Usage
This graph shows the supply cap usage (supply / supply cap) of all collateral assets over the past week.
1 Like
[Gauntlet] Scroll USDC Comet Update: (2024-06-03 through 2024-06-09)
Gauntlet would like to provide the community with an update on the Scroll USDC comet over the past week.
Simple Summary
-
USDC Borrows increased 3.92%, from $167.07K to $173.62K.
-
USDC Supply has not changed, remaining at $199.48K.
-
USDC utilization increased 3.04%, from 83.76% to 86.30%.
-
The minimum USDC reserve growth was -1.70%, and the maximum was 19.63%. The average USDC reserve growth was 12.24%.
-
The comet accumulated $63.27 USDC reserves while distributing $0.00 COMP rewards for a weekly Net Protocol Profit of $63.27.
Base Asset APR Trend
Reserve Analysis
COMP Rewards Analysis
| Chain |
CometRewards COMP token holdings |
Daily aggregate COMP token reward distributions |
Remaining days of rewards runway (not including existing claimable rewards) |
| Scroll |
0.00 |
0.00 |
0.00 |
Collateral Asset Supply
This graph shows the total supply of all collateral assets over the past week.
To see updated statistics, please see the live version of this graph here.
Base Asset Borrows
This graph shows the total borrows of the base asset over the past week.
To see updated statistics, please see the live version of this graph here.
Utilization
This graph shows the utilization (borrow / supply) of the base asset over the past week.
Supply Cap Usage
This graph shows the supply cap usage (supply / supply cap) of all collateral assets over the past week.
[Gauntlet] Scroll USDC Comet Update: (2024-06-10 through 2024-06-16)
Gauntlet would like to provide the community with an update on the Scroll USDC comet over the past week.
Simple Summary
-
USDC Borrows increased 66.89%, from $173.60K to $289.72K.
-
USDC Supply increased 49.37%, from $201.67K to $301.25K.
-
USDC utilization increased 11.73%, from 86.08% to 96.17%.
-
The minimum USDC reserve growth was 10.52%, and the maximum was 20.05%. The average USDC reserve growth was 14.12%.
-
The comet accumulated $70.39 USDC reserves while distributing $0.00 COMP rewards for a weekly Net Protocol Profit of $70.39.
Base Asset APR Trend
Reserve Analysis
COMP Rewards Analysis
| Chain |
CometRewards COMP token holdings |
Daily aggregate COMP token reward distributions |
Remaining days of rewards runway (not including existing claimable rewards) |
| Scroll |
0.00 |
0.00 |
0.00 |
Collateral Asset Supply
This graph shows the total supply of all collateral assets over the past week.
To see updated statistics, please see the live version of this graph here.
Base Asset Borrows
This graph shows the total borrows of the base asset over the past week.
To see updated statistics, please see the live version of this graph here.
Utilization
This graph shows the utilization (borrow / supply) of the base asset over the past week.
Supply Cap Usage
This graph shows the supply cap usage (supply / supply cap) of all collateral assets over the past week.
[Gauntlet] Scroll USDC Comet Update: (2024-06-17 through 2024-06-23)
Gauntlet would like to provide the community with an update on the Scroll USDC comet over the past week.
Simple Summary
-
USDC Borrows decreased 8.13%, from $298.84K to $274.56K.
-
USDC Supply increased 127.78%, from $301.11K to $685.86K.
-
USDC utilization decreased 59.67%, from 99.25% to 40.03%.
-
The minimum USDC reserve growth was -83.77%, and the maximum was 20.06%. The average USDC reserve growth was 2.08%.
-
The comet accumulated $39.39 USDC reserves while distributing $0.00 COMP rewards for a weekly Net Protocol Profit of $39.39.
Base Asset APR Trend
Reserve Analysis
COMP Rewards Analysis
| Chain |
CometRewards COMP token holdings |
Daily aggregate COMP token reward distributions |
Remaining days of rewards runway (not including existing claimable rewards) |
| Scroll |
0.00 |
0.00 |
0.00 |
Collateral Asset Supply
This graph shows the total supply of all collateral assets over the past week.
To see updated statistics, please see the live version of this graph here.
Base Asset Borrows
This graph shows the total borrows of the base asset over the past week.
To see updated statistics, please see the live version of this graph here.
Utilization
This graph shows the utilization (borrow / supply) of the base asset over the past week.
Supply Cap Usage
This graph shows the supply cap usage (supply / supply cap) of all collateral assets over the past week.
[Gauntlet] Scroll USDC Comet Update: (2024-06-24 through 2024-06-30)
Gauntlet would like to provide the community with an update on the Scroll USDC comet over the past week.
Simple Summary
-
USDC Borrows increased 32.85%, from $262.10K to $348.19K.
-
USDC Supply increased 15.44%, from $630.74K to $728.14K.
-
USDC utilization increased 15.08%, from 41.55% to 47.82%.
-
The minimum USDC reserve growth was -67.56%, and the maximum was -16.51%. The average USDC reserve growth was -34.86%.
-
The comet accumulated $-75.99 USDC reserves while distributing 0.00 COMP rewards for a weekly Net Protocol Profit of -75.99.
Base Asset APR Trend
Reserve Analysis
COMP Rewards Analysis
| Chain |
CometRewards COMP token holdings |
Daily aggregate COMP token reward distributions |
Remaining days of rewards runway (not including existing claimable rewards) |
| Scroll |
0.00 |
0.00 |
0.00 |
Collateral Asset Supply
This graph shows the total supply of all collateral assets over the past week.
To see updated statistics, please see the live version of this graph here.
Base Asset Borrows
This graph shows the total borrows of the base asset over the past week.
To see updated statistics, please see the live version of this graph here.
Utilization
This graph shows the utilization (borrow / supply) of the base asset over the past week.
Supply Cap Usage
This graph shows the supply cap usage (supply / supply cap) of all collateral assets over the past week.
[Gauntlet] Scroll USDC Comet Update: (2024-06-30 through 2024-07-06)
Gauntlet would like to provide the community with an update on the Scroll USDC comet over the past week.
Simple Summary
-
USDC Borrows decreased 1.85%, from $348.24K to $341.81K.
-
USDC Supply increased 4.89%, from $728.33K to $763.97K.
-
USDC utilization decreased 6.43%, from 47.81% to 44.74%.
-
The minimum USDC reserve growth was -33.77%, and the maximum was -18.91%. The average USDC reserve growth was -27.32%.
-
The comet accumulated $-67.25 USDC reserves while distributing 0.00 COMP rewards for a weekly Net Protocol Profit of -67.25.
Base Asset APR Trend
Reserve Analysis
COMP Rewards Analysis
| Chain |
CometRewards COMP token holdings |
Daily aggregate COMP token reward distributions |
Remaining days of rewards runway (not including existing claimable rewards) |
| Scroll |
0.00 |
0.00 |
0.00 |
Collateral Asset Supply
This graph shows the total supply of all collateral assets over the past week.
To see updated statistics, please see the live version of this graph here.
Base Asset Borrows
This graph shows the total borrows of the base asset over the past week.
To see updated statistics, please see the live version of this graph here.
Utilization
This graph shows the utilization (borrow / supply) of the base asset over the past week.
Supply Cap Usage
This graph shows the supply cap usage (supply / supply cap) of all collateral assets over the past week.