This report builds upon Gauntlet’s Market Downturn Risk Review to keep the community informed of market risks pertaining to Compound. So far, Gauntlet has executed 9 sets of parameter recommendations as part of our Dynamic Risk Parameters engagement. Over the past three months, Gauntlet has executed 4 sets of recs and has implemented twelve (12) parameter suggestions across eight (8) assets.
| Old Collateral Factor | New Collateral Factor |
|---|---|
| ETH (80%) | 82.5% |
| UNI (70%) | 75% |
| LINK (70%) | 75% |
| MKR (55%) | 65%** |
| AAVE (60%) | 65% |
| YFI (60%) | 70%** |
| SUSHI (55%) | 70%*** |
| ZRX (60%) | 65% |
Asterisks represent CFs that have been adjusted multiple times over the last three months.
Gauntlet’s parameter updates align with the Moderate risk level that the Community has collectively voted for.
In addition to managing market risk for Compound, Gauntlet also has invested in creating educational resources to help the Compound Community and the broader DeFi community better understand market risk. Gauntlet has recently published the following educational documentation and advises that the community review these resources:
- Gauntlet Announces Collaboration with Moody’s on Risk Management in DeFi
- Gauntlet Parameter Recommendation Methodology
- Gauntlet Model Methodology
- Deep Dive on Value at Risk
Gauntlet has launched the Compound Risk Dashboard and has invested in improvements to its infrastructure to enable daily updates. The community should use the dashboard linked above to understand better the updated parameter suggestions and general market risk in Compound. Gauntlet is keen on continuously bettering its dashboards and has been conducting user studies with members of this community and others to inform future iterations.
Highlights
Supply changes of key collateral assets from 01/01/2022 to 03/31/2022

Borrow changes of key collateral assets from 01/01/2022 to 03/31/2022

Price changes of key collateral assets from 01/01/2022 to 03/31/2022

Liquidations breakdown by collateral from 01/01/2022 to 03/31/2022

Liquidations breakdown by account from 01/01/2022 to 03/31/2022

Top 10 liquidations breakdown by account from 01/01/2022 to 03/31/2022

Insolvent accounts on 03/31/2022

New insolvent accounts from 01/01/2022 to 03/31/2022
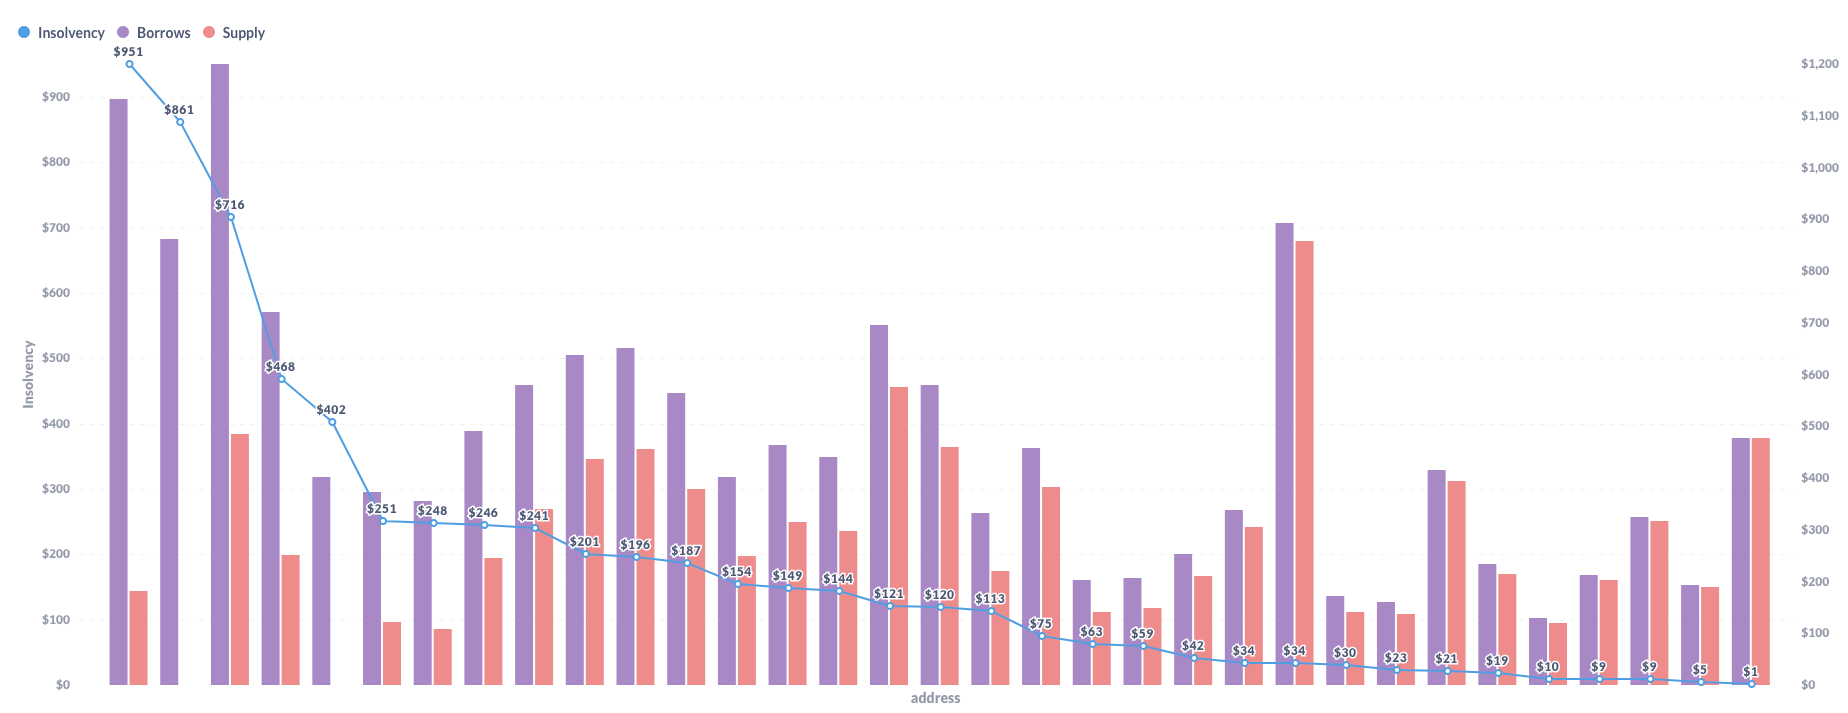
This shows all insolvent accounts on 03/31/2022, which were solvent on 01/01/2022. Note that the only insolvencies are from negligible dust accounts, the largest of which has $859 supplied and the largest insolvent amount of $951.
Previous insolvent accounts from 01/01/2022 and differences up to 03/31/2022

This shows the 03/31/2022 state of all accounts which were insolvent on 01/01/2022.
Total insolvencies from 01/01/2022 to 03/31/2022

Time series of collateral-specific volatility from 01/01/2022 to 03/31/2022

Using the 28 day trailing data and the Garman Klass volatility estimator, which utilizes both daily high H_i and low L_i prices, as well as daily opening O_i and closing C_i prices, the annualized volatility for each asset can be calculated as follows:

If you are unfamiliar with the concept of volatility, please reference this writeup from Gauntlet.
Time series of collateral-specific protocol collateralization ratios from 01/01/2022 to 03/31/2022

The average collateralization ratio for an asset is a valuable indicator of how risky borrowers behave.
Time series of liquidation volume from 01/01/2022 to 03/31/2022
