[Gauntlet] Mantle Ecosystem Update: (2025-01-13 through 2025-01-19)
Mantle USDe Comet
Gauntlet would like to provide the community with an update on the Mantle USDe comet over the past week.
Simple Summary
-
USDe Borrows decreased 5.08%, from $3.40M to $3.23M.
-
USDe Supply has not changed, remaining at $10.00M.
-
USDe utilization decreased 4.96%, from 33.99% to 32.30%.
-
The minimum USDe reserve growth was -51.57%, and the maximum was -46.50%. The average USDe reserve growth was -48.84%.
-
The comet accumulated $-825.16 USDe reserves while distributing 4.54K COMP rewards for a weekly Net Protocol Profit of -5.36K.
Base Asset APR Trend
Reserve Analysis
COMP Rewards Analysis
| Chain |
CometRewards COMP token holdings |
Daily aggregate COMP token reward distributions |
Remaining days of rewards runway (not including existing claimable rewards) |
| Mantle |
0.00 |
0.00 |
0.00 |
Collateral Asset Supply
This graph shows the total supply of all collateral assets over the past week.
To see updated statistics, please see the live version of this graph here.
Base Asset Borrows
This graph shows the total borrows of the base asset over the past week.
To see updated statistics, please see the live version of this graph here.
Utilization
This graph shows the utilization (borrow / supply) of the base asset over the past week.
Supply Cap Usage
This graph shows the supply cap usage (supply / supply cap) of all collateral assets over the past week.
[Gauntlet] Mantle Ecosystem Update: (2025-01-20 through 2025-01-26)
mantle USDe Comet
Gauntlet would like to provide the community with an update on the mantle USDe comet over the past week.
Simple Summary
-
USDe Borrows increased 5.63%, from $3.23M to $3.41M.
-
USDe Supply has not changed, remaining at $9.98M.
-
USDe utilization increased 5.33%, from 32.30% to 34.02%.
-
The minimum USDe reserve growth was -51.42%, and the maximum was -48.12%. The average USDe reserve growth was -49.26%.
-
The comet accumulated $-824.65 USDe reserves while distributing 4.32K COMP rewards for a weekly Net Protocol Profit of -5.14K.
Base Asset APR Trend
Reserve Analysis
COMP Rewards Analysis
| Chain |
CometRewards COMP token holdings |
Daily aggregate COMP token reward distributions |
Remaining days of rewards runway (not including existing claimable rewards) |
| mantle |
0.00 |
0.00 |
0.00 |
Collateral Asset Supply
This graph shows the total supply of all collateral assets over the past week.
To see updated statistics, please see the live version of this graph here.
Base Asset Borrows
This graph shows the total borrows of the base asset over the past week.
To see updated statistics, please see the live version of this graph here.
Utilization
This graph shows the utilization (borrow / supply) of the base asset over the past week.
Supply Cap Usage
This graph shows the supply cap usage (supply / supply cap) of all collateral assets over the past week.
1 Like
[Gauntlet] Mantle Ecosystem Update: (2025-01-27 through 2025-02-02)
mantle USDe Comet
Gauntlet would like to provide the community with an update on the mantle USDe comet over the past week.
Simple Summary
-
USDe Borrows increased 24.16%, from $3.41M to $4.23M.
-
USDe Supply has not changed, remaining at $10.01M.
-
USDe utilization increased 24.30%, from 34.02% to 42.29%.
-
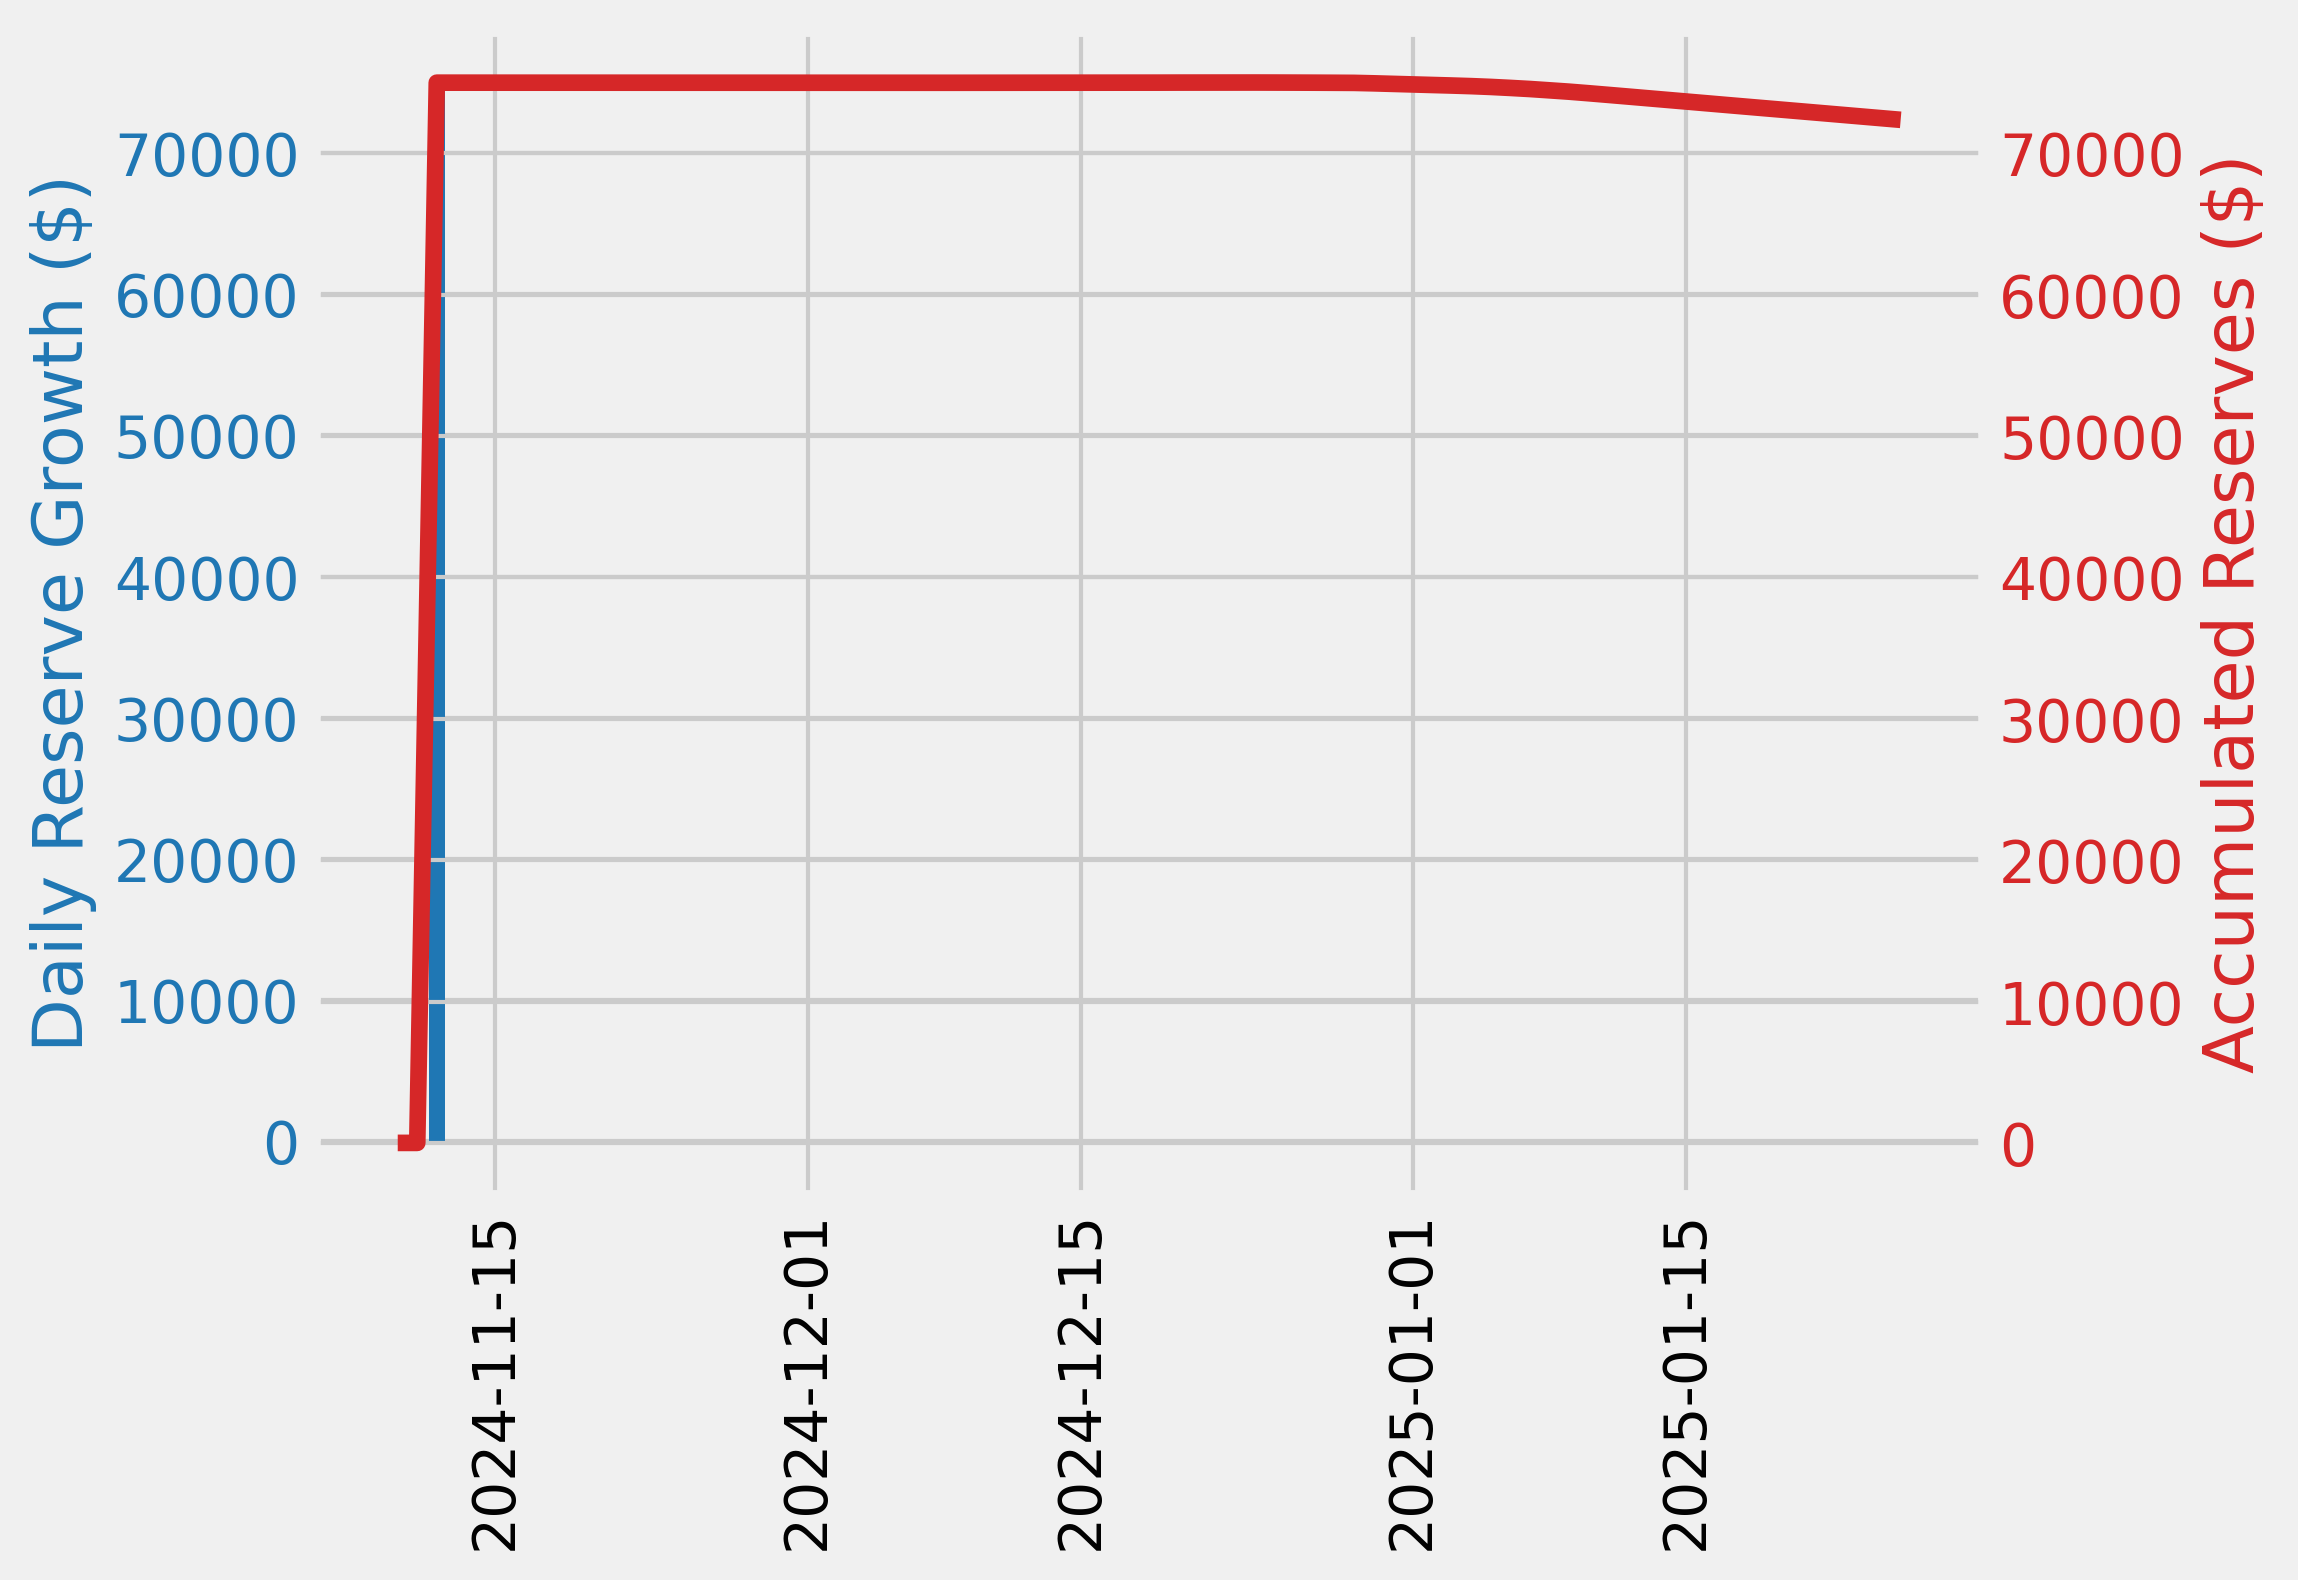
The minimum USDe reserve growth was -48.12%, and the maximum was -33.67%. The average USDe reserve growth was -35.52%.
-
The comet accumulated $-811.33 USDe reserves while distributing 3.74K COMP rewards for a weekly Net Protocol Profit of -4.55K.
Base Asset APR Trend
Reserve Analysis
COMP Rewards Analysis
| Chain |
CometRewards COMP token holdings |
Daily aggregate COMP token reward distributions |
Remaining days of rewards runway (not including existing claimable rewards) |
| mantle |
0.00 |
0.00 |
0.00 |
Collateral Asset Supply
This graph shows the total supply of all collateral assets over the past week.
To see updated statistics, please see the live version of this graph here.
Base Asset Borrows
This graph shows the total borrows of the base asset over the past week.
To see updated statistics, please see the live version of this graph here.
Utilization
This graph shows the utilization (borrow / supply) of the base asset over the past week.
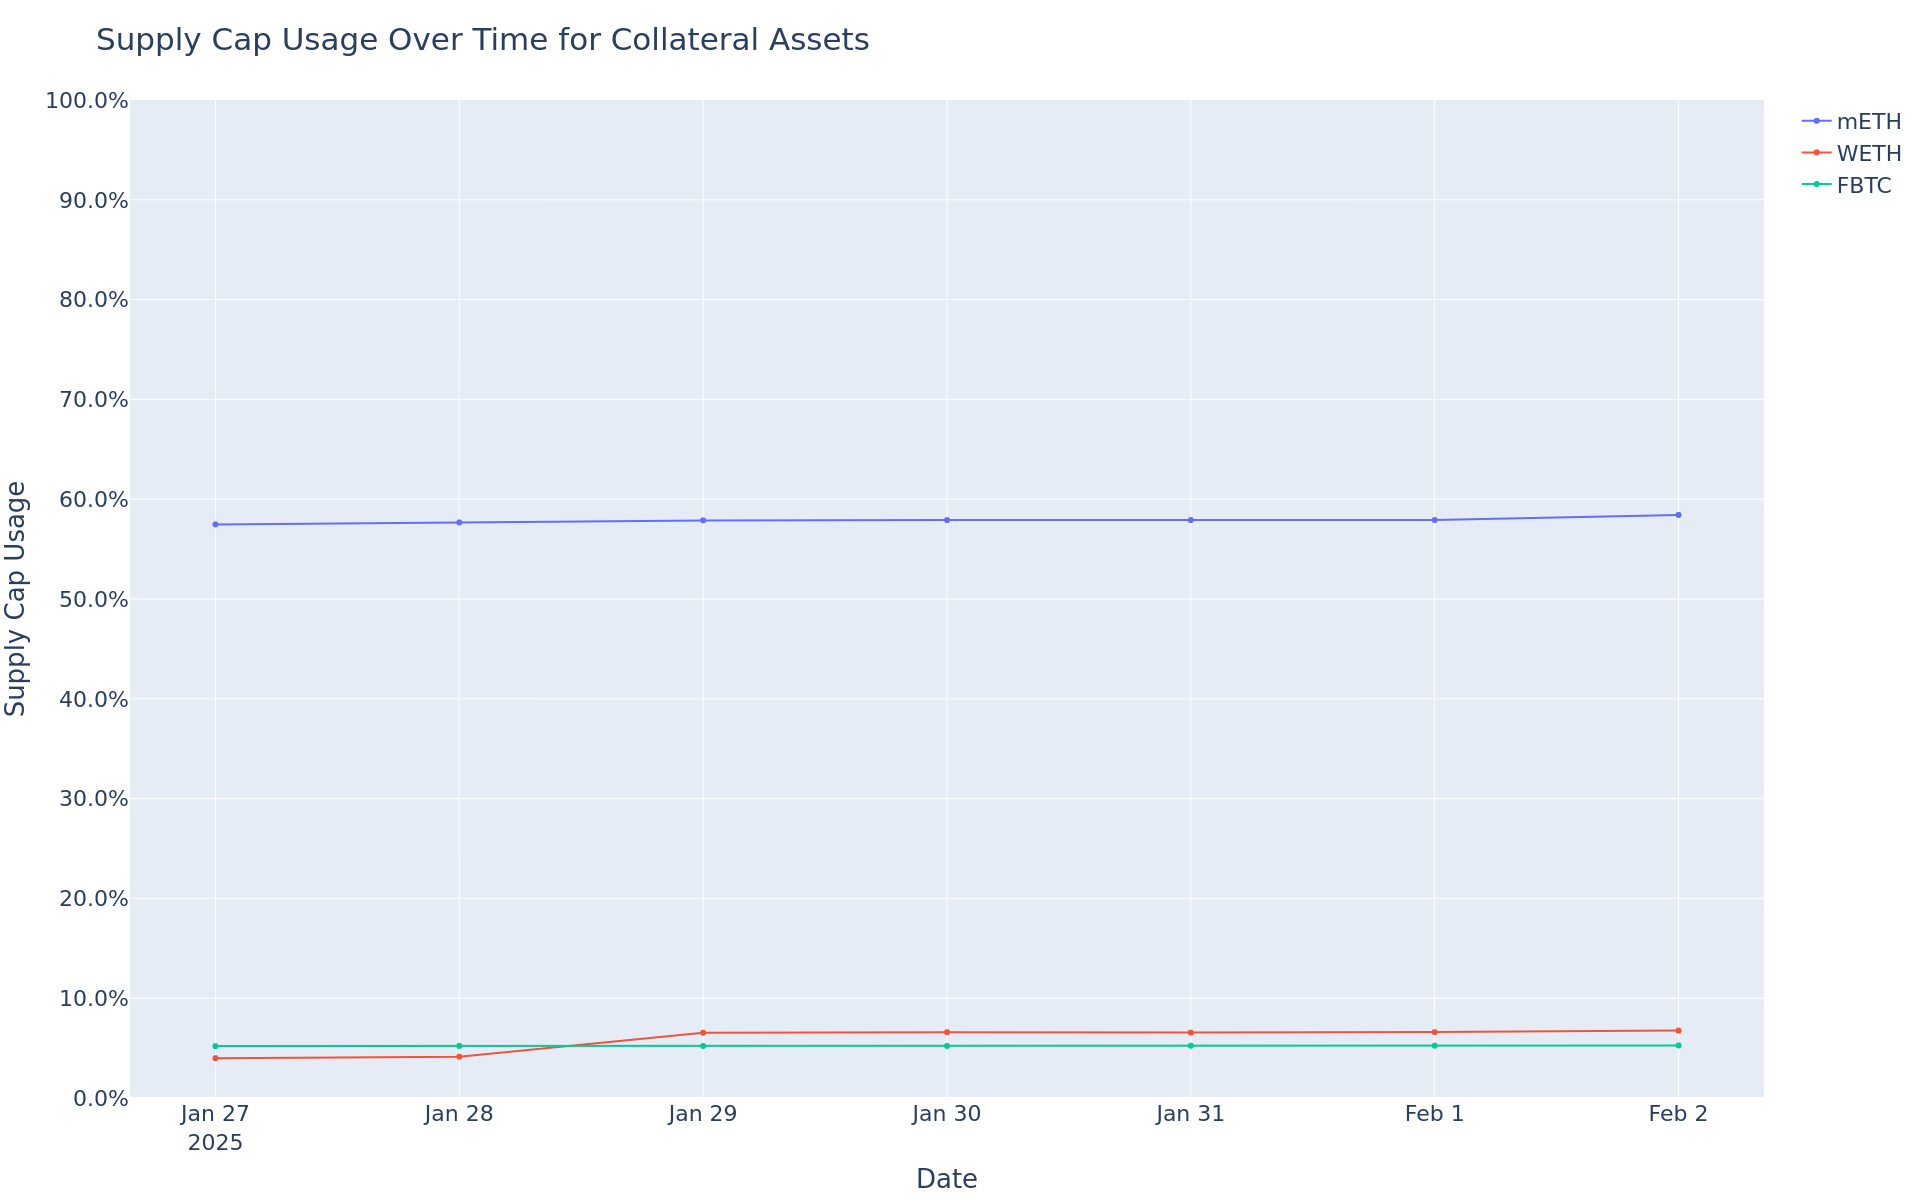
Supply Cap Usage
This graph shows the supply cap usage (supply / supply cap) of all collateral assets over the past week.
[Gauntlet] Mantle Ecosystem Update: (2025-02-03 through 2025-02-09)
mantle USDe Comet
Gauntlet would like to provide the community with an update on the mantle USDe comet over the past week.
Simple Summary
-
USDe Borrows decreased 30.78%, from $4.23M to $2.93M.
-
USDe Supply has not changed, remaining at $10.00M.
-
USDe utilization decreased 30.87%, from 42.30% to 29.24%.
-
The minimum USDe reserve growth was -91.00%, and the maximum was -34.09%. The average USDe reserve growth was -71.31%.
-
The comet accumulated $-713.83 USDe reserves while distributing 2.89K COMP rewards for a weekly Net Protocol Profit of -3.60K.
Base Asset APR Trend
Reserve Analysis
COMP Rewards Analysis
| Chain |
CometRewards COMP token holdings |
Daily aggregate COMP token reward distributions |
Remaining days of rewards runway (not including existing claimable rewards) |
| mantle |
0.00 |
0.00 |
0.00 |
Collateral Asset Supply
This graph shows the total supply of all collateral assets over the past week.
To see updated statistics, please see the live version of this graph here.
Base Asset Borrows
This graph shows the total borrows of the base asset over the past week.
To see updated statistics, please see the live version of this graph here.
Utilization
This graph shows the utilization (borrow / supply) of the base asset over the past week.
Supply Cap Usage
This graph shows the supply cap usage (supply / supply cap) of all collateral assets over the past week.
1 Like
[Gauntlet] Mantle Ecosystem Update: (2025-02-11 through 2025-02-17)
mantle USDe Comet
Gauntlet would like to provide the community with an update on the mantle USDe comet over the past week.
Simple Summary
-
USDe Borrows increased 7.51%, from $3.07M to $3.31M.
-
USDe Supply has not changed, remaining at $10.01M.
-
USDe utilization increased 7.52%, from 30.70% to 33.01%.
-
The minimum USDe reserve growth was -67.22%, and the maximum was -50.04%. The average USDe reserve growth was -55.48%.
-
The comet accumulated $-805.17 USDe reserves while distributing 3.17K COMP rewards for a weekly Net Protocol Profit of -3.98K.
Base Asset APR Trend
Reserve Analysis
COMP Rewards Analysis
| Chain |
CometRewards COMP token holdings |
Daily aggregate COMP token reward distributions |
Remaining days of rewards runway (not including existing claimable rewards) |
| mantle |
0.00 |
0.00 |
0.00 |
Collateral Asset Supply
This graph shows the total supply of all collateral assets over the past week.
To see updated statistics, please see the live version of this graph here.
Base Asset Borrows
This graph shows the total borrows of the base asset over the past week.
To see updated statistics, please see the live version of this graph here.
Utilization
This graph shows the utilization (borrow / supply) of the base asset over the past week.
Supply Cap Usage
This graph shows the supply cap usage (supply / supply cap) of all collateral assets over the past week.
[Gauntlet] Mantle Ecosystem Update: (2025-02-17 through 2025-02-23)
mantle USDe Comet
Gauntlet would like to provide the community with an update on the mantle USDe comet over the past week.
Simple Summary
-
USDe Borrows decreased 6.20%, from $3.30M to $3.09M.
-
USDe Supply has not changed, remaining at $10.01M.
-
USDe utilization decreased 6.24%, from 32.91% to 30.85%.
-
The minimum USDe reserve growth was -55.16%, and the maximum was -33.59%. The average USDe reserve growth was -49.01%.
-
The comet accumulated $-816.64 USDe reserves while distributing 3.07K COMP rewards for a weekly Net Protocol Profit of -3.88K.
Base Asset APR Trend
Reserve Analysis
COMP Rewards Analysis
| Chain |
CometRewards COMP token holdings |
Daily aggregate COMP token reward distributions |
Remaining days of rewards runway (not including existing claimable rewards) |
| mantle |
0.00 |
0.00 |
0.00 |
Collateral Asset Supply
This graph shows the total supply of all collateral assets over the past week.
To see updated statistics, please see the live version of this graph here.
Base Asset Borrows
This graph shows the total borrows of the base asset over the past week.
To see updated statistics, please see the live version of this graph here.
Utilization
This graph shows the utilization (borrow / supply) of the base asset over the past week.
Supply Cap Usage
This graph shows the supply cap usage (supply / supply cap) of all collateral assets over the past week.
[Gauntlet] Mantle Ecosystem Update: (2025-02-24 through 2025-03-02)
mantle USDe Comet
Gauntlet would like to provide the community with an update on the mantle USDe comet over the past week.
Simple Summary
-
USDe Borrows decreased 2.74%, from $3.09M to $3.01M.
-
USDe Supply has not changed, remaining at $10.02M.
-
USDe utilization decreased 2.68%, from 30.85% to 30.03%.
-
The minimum USDe reserve growth was -57.95%, and the maximum was -52.42%. The average USDe reserve growth was -54.73%.
-
The comet accumulated $-811.42 USDe reserves while distributing 2.88K COMP rewards for a weekly Net Protocol Profit of -3.69K.
Base Asset APR Trend
Reserve Analysis
COMP Rewards Analysis
| Chain |
CometRewards COMP token holdings |
Daily aggregate COMP token reward distributions |
Remaining days of rewards runway (not including existing claimable rewards) |
| mantle |
0.00 |
0.00 |
0.00 |
Collateral Asset Supply
This graph shows the total supply of all collateral assets over the past week.
To see updated statistics, please see the live version of this graph here.
Base Asset Borrows
This graph shows the total borrows of the base asset over the past week.
To see updated statistics, please see the live version of this graph here.
Utilization
This graph shows the utilization (borrow / supply) of the base asset over the past week.
Supply Cap Usage
This graph shows the supply cap usage (supply / supply cap) of all collateral assets over the past week.
1 Like
[Gauntlet] Mantle Ecosystem Update: (2025-03-03 through 2025-03-09)
mantle USDe Comet
Gauntlet would like to provide the community with an update on the mantle USDe comet over the past week.
Simple Summary
-
USDe Borrows decreased 3.95%, from $3.01M to $2.89M.
-
USDe Supply has not changed, remaining at $10.01M.
-
USDe utilization decreased 4.00%, from 30.03% to 28.83%.
-
The minimum USDe reserve growth was -58.54%, and the maximum was -53.52%. The average USDe reserve growth was -56.96%.
-
The comet accumulated $-803.48 USDe reserves while distributing 2.72K COMP rewards for a weekly Net Protocol Profit of -3.52K.
Base Asset APR Trend
Reserve Analysis
COMP Rewards Analysis
| Chain |
CometRewards COMP token holdings |
Daily aggregate COMP token reward distributions |
Remaining days of rewards runway (not including existing claimable rewards) |
| mantle |
0.00 |
0.00 |
0.00 |
Collateral Asset Supply
This graph shows the trend of total supply of all collateral assets.
To see updated statistics, please see the live version of this graph here.
Base Asset Borrows
This graph shows the trend of total borrows of the base asset.
To see updated statistics, please see the live version of this graph here.
Utilization
This graph shows the utilization (borrow / supply) of the base asset over the past week.
Supply Cap Usage
This graph shows the supply cap usage (supply / supply cap) of all collateral assets over the past week.