[Gauntlet] Scroll Ecosystem Update: (2024-11-25 through 2024-12-01)
scroll USDC Comet
Gauntlet would like to provide the community with an update on the scroll USDC comet over the past week.
Simple Summary
-
USDC Borrows decreased 10.08%, from $173.71K to $156.20K.
-
USDC Supply decreased 11.30%, from $190.56K to $169.03K.
-
USDC utilization increased 1.38%, from 91.16% to 92.41%.
-
The minimum USDC reserve growth was 6.71%, and the maximum was 12.46%. The average USDC reserve growth was 8.69%.
-
The comet accumulated $32.89 USDC reserves while distributing $0.00 COMP rewards for a weekly Net Protocol Profit of $32.89.
Base Asset APR Trend
Reserve Analysis
COMP Rewards Analysis
| Chain |
CometRewards COMP token holdings |
Daily aggregate COMP token reward distributions |
Remaining days of rewards runway (not including existing claimable rewards) |
| scroll |
0.00 |
0.00 |
0.00 |
Collateral Asset Supply
This graph shows the total supply of all collateral assets over the past week.
To see updated statistics, please see the live version of this graph here.
Base Asset Borrows
This graph shows the total borrows of the base asset over the past week.
To see updated statistics, please see the live version of this graph here.
Utilization
This graph shows the utilization (borrow / supply) of the base asset over the past week.
Supply Cap Usage
This graph shows the supply cap usage (supply / supply cap) of all collateral assets over the past week.
[Gauntlet] Scroll Ecosystem Update: (2024-12-02 through 2024-12-08)
scroll USDC Comet
Gauntlet would like to provide the community with an update on the scroll USDC comet over the past week.
Simple Summary
-
USDC Borrows decreased 3.76%, from $156.21K to $150.32K.
-
USDC Supply decreased 3.88%, from $169.01K to $162.45K.
-
USDC utilization did not change, remaining at 92.42%.
-
The minimum USDC reserve growth was 6.70%, and the maximum was 11.78%. The average USDC reserve growth was 7.08%.
-
The comet accumulated $33.87 USDC reserves while distributing $0.00 COMP rewards for a weekly Net Protocol Profit of $33.87.
Base Asset APR Trend
Reserve Analysis
COMP Rewards Analysis
| Chain |
CometRewards COMP token holdings |
Daily aggregate COMP token reward distributions |
Remaining days of rewards runway (not including existing claimable rewards) |
| scroll |
0.00 |
0.00 |
0.00 |
Collateral Asset Supply
This graph shows the total supply of all collateral assets over the past week.
To see updated statistics, please see the live version of this graph here.
Base Asset Borrows
This graph shows the total borrows of the base asset over the past week.
To see updated statistics, please see the live version of this graph here.
Utilization
This graph shows the utilization (borrow / supply) of the base asset over the past week.
Supply Cap Usage
This graph shows the supply cap usage (supply / supply cap) of all collateral assets over the past week.
[Gauntlet] Scroll Ecosystem Update: (2024-12-09 through 2024-12-15)
scroll USDC Comet
Gauntlet would like to provide the community with an update on the scroll USDC comet over the past week.
Simple Summary
-
USDC Borrows decreased 5.86%, from $150.32K to $141.52K.
-
USDC Supply decreased 5.53%, from $162.40K to $153.42K.
-
USDC utilization did not change, remaining at 92.57%.
-
The minimum USDC reserve growth was 6.70%, and the maximum was 12.67%. The average USDC reserve growth was 8.03%.
-
The comet accumulated $25.34 USDC reserves while distributing $0.00 COMP rewards for a weekly Net Protocol Profit of $25.34.
Base Asset APR Trend
Reserve Analysis
COMP Rewards Analysis
| Chain |
CometRewards COMP token holdings |
Daily aggregate COMP token reward distributions |
Remaining days of rewards runway (not including existing claimable rewards) |
| scroll |
0.00 |
0.00 |
0.00 |
Collateral Asset Supply
This graph shows the total supply of all collateral assets over the past week.
To see updated statistics, please see the live version of this graph here.
Base Asset Borrows
This graph shows the total borrows of the base asset over the past week.
To see updated statistics, please see the live version of this graph here.
Utilization
This graph shows the utilization (borrow / supply) of the base asset over the past week.
Supply Cap Usage
This graph shows the supply cap usage (supply / supply cap) of all collateral assets over the past week.
[Gauntlet] Scroll Ecosystem Update: (2024-12-16 through 2024-12-22)
scroll USDC Comet
Gauntlet would like to provide the community with an update on the scroll USDC comet over the past week.
Simple Summary
-
USDC Borrows decreased 2.38%, from $141.52K to $138.15K.
-
USDC Supply decreased 2.53%, from $152.32K to $148.47K.
-
USDC utilization did not change, remaining at 92.91%.
-
The minimum USDC reserve growth was 6.70%, and the maximum was 8.77%. The average USDC reserve growth was 7.02%.
-
The comet accumulated $26.63 USDC reserves while distributing $0.00 COMP rewards for a weekly Net Protocol Profit of $26.63.
Base Asset APR Trend
Reserve Analysis
COMP Rewards Analysis
| Chain |
CometRewards COMP token holdings |
Daily aggregate COMP token reward distributions |
Remaining days of rewards runway (not including existing claimable rewards) |
| scroll |
0.00 |
0.00 |
0.00 |
Collateral Asset Supply
This graph shows the total supply of all collateral assets over the past week.
To see updated statistics, please see the live version of this graph here.
Base Asset Borrows
This graph shows the total borrows of the base asset over the past week.
To see updated statistics, please see the live version of this graph here.
Utilization
This graph shows the utilization (borrow / supply) of the base asset over the past week.
Supply Cap Usage
This graph shows the supply cap usage (supply / supply cap) of all collateral assets over the past week.
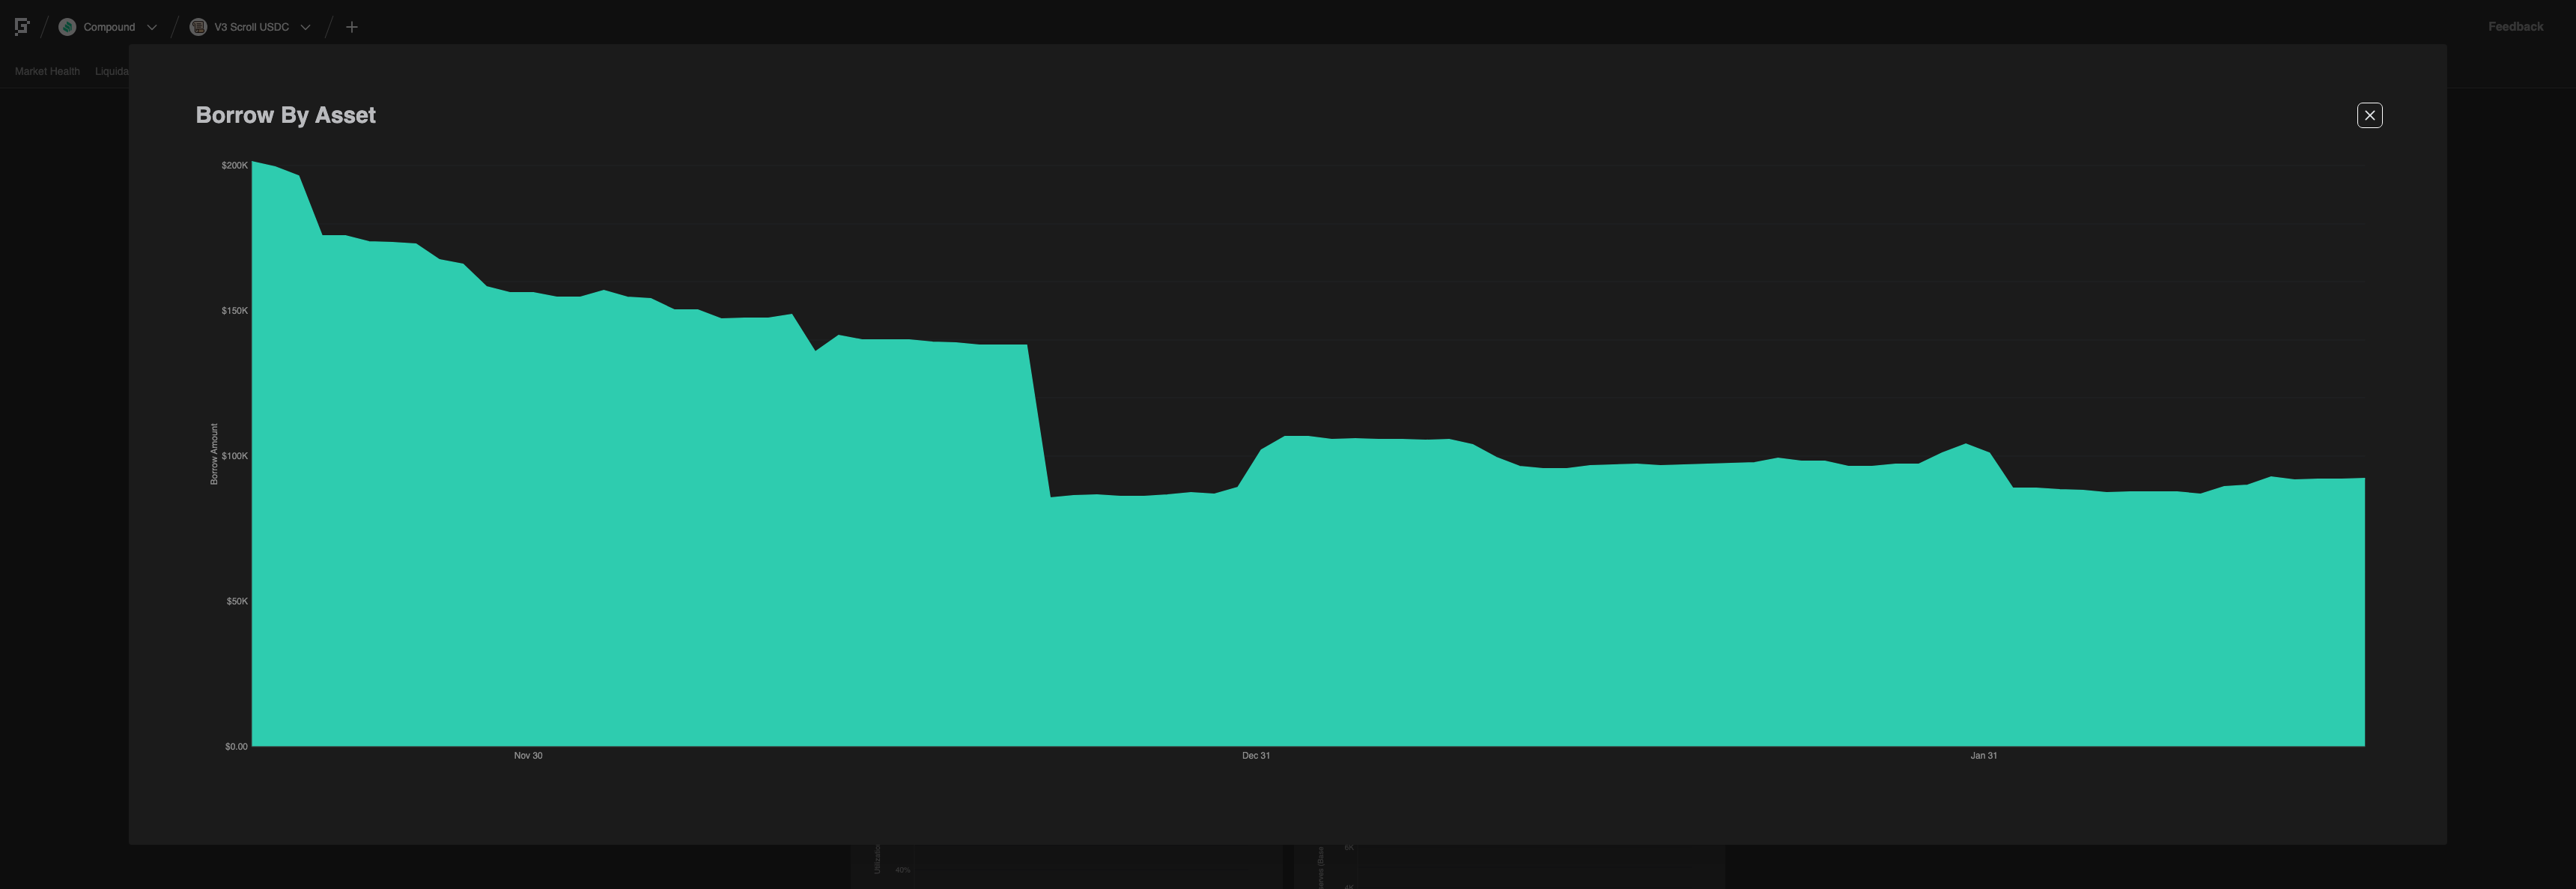
[Gauntlet] Scroll Ecosystem Update: (2024-12-23 through 2024-12-29)
scroll USDC Comet
Gauntlet would like to provide the community with an update on the scroll USDC comet over the past week.
Simple Summary
-
USDC Borrows decreased 37.41%, from $138.16K to $86.47K.
-
USDC Supply decreased 14.36%, from $148.47K to $127.15K.
-
USDC utilization decreased 26.92%, from 93.05% to 68.01%.
-
The minimum USDC reserve growth was -15.52%, and the maximum was 13.00%. The average USDC reserve growth was -5.28%.
-
The comet accumulated $3.91 USDC reserves while distributing $0.00 COMP rewards for a weekly Net Protocol Profit of $3.91.
Base Asset APR Trend
Reserve Analysis
COMP Rewards Analysis
| Chain |
CometRewards COMP token holdings |
Daily aggregate COMP token reward distributions |
Remaining days of rewards runway (not including existing claimable rewards) |
| scroll |
0.00 |
0.00 |
0.00 |
Collateral Asset Supply
This graph shows the total supply of all collateral assets over the past week.
To see updated statistics, please see the live version of this graph here.
Base Asset Borrows
This graph shows the total borrows of the base asset over the past week.
To see updated statistics, please see the live version of this graph here.
Utilization
This graph shows the utilization (borrow / supply) of the base asset over the past week.
Supply Cap Usage
This graph shows the supply cap usage (supply / supply cap) of all collateral assets over the past week.
[Gauntlet] Scroll Ecosystem Update: (2024-12-30 through 2025-01-05)
scroll USDC Comet
Gauntlet would like to provide the community with an update on the scroll USDC comet over the past week.
Simple Summary
-
USDC Borrows increased 22.29%, from $86.47K to $105.75K.
-
USDC Supply decreased 3.84%, from $127.15K to $122.27K.
-
USDC utilization increased 27.17%, from 68.01% to 86.49%.
-
The minimum USDC reserve growth was -3.68%, and the maximum was 11.70%. The average USDC reserve growth was 3.79%.
-
The comet accumulated $3.61 USDC reserves while distributing $0.00 COMP rewards for a weekly Net Protocol Profit of $3.61.
Base Asset APR Trend
Reserve Analysis
COMP Rewards Analysis
| Chain |
CometRewards COMP token holdings |
Daily aggregate COMP token reward distributions |
Remaining days of rewards runway (not including existing claimable rewards) |
| scroll |
0.00 |
0.00 |
0.00 |
Collateral Asset Supply
This graph shows the total supply of all collateral assets over the past week.
To see updated statistics, please see the live version of this graph here.
Base Asset Borrows
This graph shows the total borrows of the base asset over the past week.
To see updated statistics, please see the live version of this graph here.
Utilization
This graph shows the utilization (borrow / supply) of the base asset over the past week.
Supply Cap Usage
This graph shows the supply cap usage (supply / supply cap) of all collateral assets over the past week.
[Gauntlet] Scroll Ecosystem Update: (2025-01-06 through 2025-01-12)
scroll USDC Comet
Gauntlet would like to provide the community with an update on the scroll USDC comet over the past week.
Simple Summary
-
USDC Borrows decreased 5.87%, from $105.75K to $99.54K.
-
USDC Supply decreased 10.01%, from $122.27K to $110.03K.
-
USDC utilization increased 4.60%, from 86.49% to 90.46%.
-
The minimum USDC reserve growth was 6.80%, and the maximum was 13.27%. The average USDC reserve growth was 11.69%.
-
The comet accumulated $11.44 USDC reserves while distributing $0.00 COMP rewards for a weekly Net Protocol Profit of $11.44.
Base Asset APR Trend
Reserve Analysis
COMP Rewards Analysis
| Chain |
CometRewards COMP token holdings |
Daily aggregate COMP token reward distributions |
Remaining days of rewards runway (not including existing claimable rewards) |
| scroll |
0.00 |
0.00 |
0.00 |
Collateral Asset Supply
This graph shows the total supply of all collateral assets over the past week.
To see updated statistics, please see the live version of this graph here.
Base Asset Borrows
This graph shows the total borrows of the base asset over the past week.
To see updated statistics, please see the live version of this graph here.
Utilization
This graph shows the utilization (borrow / supply) of the base asset over the past week.
Supply Cap Usage
This graph shows the supply cap usage (supply / supply cap) of all collateral assets over the past week.
[Gauntlet] Scroll Ecosystem Update: (2025-01-13 through 2025-01-19)
scroll USDC Comet
Gauntlet would like to provide the community with an update on the scroll USDC comet over the past week.
Simple Summary
-
USDC Borrows decreased 2.98%, from $99.53K to $96.56K.
-
USDC Supply decreased 7.66%, from $110.03K to $101.60K.
-
USDC utilization increased 5.07%, from 90.46% to 95.05%.
-
The minimum USDC reserve growth was 6.80%, and the maximum was 13.26%. The average USDC reserve growth was 10.43%.
-
The comet accumulated $14.92 USDC reserves while distributing $0.00 COMP rewards for a weekly Net Protocol Profit of $14.92.
Base Asset APR Trend
Reserve Analysis
COMP Rewards Analysis
| Chain |
CometRewards COMP token holdings |
Daily aggregate COMP token reward distributions |
Remaining days of rewards runway (not including existing claimable rewards) |
| scroll |
0.00 |
0.00 |
0.00 |
Collateral Asset Supply
This graph shows the total supply of all collateral assets over the past week.
To see updated statistics, please see the live version of this graph here.
Base Asset Borrows
This graph shows the total borrows of the base asset over the past week.
To see updated statistics, please see the live version of this graph here.
Utilization
This graph shows the utilization (borrow / supply) of the base asset over the past week.
Supply Cap Usage
This graph shows the supply cap usage (supply / supply cap) of all collateral assets over the past week.
[Gauntlet] Scroll Ecosystem Update: (2025-01-20 through 2025-01-26)
scroll USDC Comet
Gauntlet would like to provide the community with an update on the scroll USDC comet over the past week.
Simple Summary
-
USDC Borrows increased 1.64%, from $96.57K to $98.15K.
-
USDC Supply increased 10.28%, from $101.60K to $112.04K.
-
USDC utilization decreased 7.83%, from 95.05% to 87.60%.
-
The minimum USDC reserve growth was -22.05%, and the maximum was 13.14%. The average USDC reserve growth was 9.46%.
-
The comet accumulated $22.44 USDC reserves while distributing $0.00 COMP rewards for a weekly Net Protocol Profit of $22.44.
Base Asset APR Trend
Reserve Analysis
COMP Rewards Analysis
| Chain |
CometRewards COMP token holdings |
Daily aggregate COMP token reward distributions |
Remaining days of rewards runway (not including existing claimable rewards) |
| scroll |
0.00 |
0.00 |
0.00 |
Collateral Asset Supply
This graph shows the total supply of all collateral assets over the past week.
To see updated statistics, please see the live version of this graph here.
Base Asset Borrows
This graph shows the total borrows of the base asset over the past week.
To see updated statistics, please see the live version of this graph here.
Utilization
This graph shows the utilization (borrow / supply) of the base asset over the past week.
Supply Cap Usage
This graph shows the supply cap usage (supply / supply cap) of all collateral assets over the past week.
[Gauntlet] Scroll Ecosystem Update: (2025-01-27 through 2025-02-02)
scroll USDC Comet
Gauntlet would like to provide the community with an update on the scroll USDC comet over the past week.
Simple Summary
-
USDC Borrows increased 2.83%, from $98.15K to $100.93K.
-
USDC Supply increased 38.14%, from $112.95K to $156.03K.
-
USDC utilization decreased 25.56%, from 86.90% to 64.69%.
-
The minimum USDC reserve growth was -17.00%, and the maximum was 12.06%. The average USDC reserve growth was -5.18%.
-
The comet accumulated $-4.33 USDC reserves while distributing 0.00 COMP rewards for a weekly Net Protocol Profit of -4.33.
Base Asset APR Trend
Reserve Analysis
COMP Rewards Analysis
| Chain |
CometRewards COMP token holdings |
Daily aggregate COMP token reward distributions |
Remaining days of rewards runway (not including existing claimable rewards) |
| scroll |
0.00 |
0.00 |
0.00 |
Collateral Asset Supply
This graph shows the total supply of all collateral assets over the past week.
To see updated statistics, please see the live version of this graph here.
Base Asset Borrows
This graph shows the total borrows of the base asset over the past week.
To see updated statistics, please see the live version of this graph here.
Utilization
This graph shows the utilization (borrow / supply) of the base asset over the past week.
Supply Cap Usage
This graph shows the supply cap usage (supply / supply cap) of all collateral assets over the past week.
[Gauntlet] Scroll Ecosystem Update: (2025-02-03 through 2025-02-09)
scroll USDC Comet
Gauntlet would like to provide the community with an update on the scroll USDC comet over the past week.
Simple Summary
-
USDC Borrows decreased 13.28%, from $100.93K to $87.53K.
-
USDC Supply decreased 40.28%, from $154.95K to $92.53K.
-
USDC utilization increased 45.23%, from 65.14% to 94.60%.
-
The minimum USDC reserve growth was -24.79%, and the maximum was 18.23%. The average USDC reserve growth was -10.11%.
-
The comet accumulated $6.33 USDC reserves while distributing $0.00 COMP rewards for a weekly Net Protocol Profit of $6.33.
Base Asset APR Trend
Reserve Analysis
COMP Rewards Analysis
| Chain |
CometRewards COMP token holdings |
Daily aggregate COMP token reward distributions |
Remaining days of rewards runway (not including existing claimable rewards) |
| scroll |
0.00 |
0.00 |
0.00 |
Collateral Asset Supply
This graph shows the total supply of all collateral assets over the past week.
To see updated statistics, please see the live version of this graph here.
Base Asset Borrows
This graph shows the total borrows of the base asset over the past week.
To see updated statistics, please see the live version of this graph here.
Utilization
This graph shows the utilization (borrow / supply) of the base asset over the past week.
Supply Cap Usage
This graph shows the supply cap usage (supply / supply cap) of all collateral assets over the past week.
[Gauntlet] Scroll Ecosystem Update: (2025-02-11 through 2025-02-17)
scroll USDC Comet
Gauntlet would like to provide the community with an update on the scroll USDC comet over the past week.
Simple Summary
-
USDC Borrows increased 5.04%, from $87.55K to $91.96K.
-
USDC Supply increased 5.01%, from $105.34K to $110.62K.
-
USDC utilization did not change, remaining at 83.11%.
-
The minimum USDC reserve growth was 4.36%, and the maximum was 9.95%. The average USDC reserve growth was 8.02%.
-
The comet accumulated $8.30 USDC reserves while distributing $0.00 COMP rewards for a weekly Net Protocol Profit of $8.30.
Base Asset APR Trend
Reserve Analysis
COMP Rewards Analysis
| Chain |
CometRewards COMP token holdings |
Daily aggregate COMP token reward distributions |
Remaining days of rewards runway (not including existing claimable rewards) |
| scroll |
0.00 |
0.00 |
0.00 |
Collateral Asset Supply
This graph shows the total supply of all collateral assets over the past week.
To see updated statistics, please see the live version of this graph here.
Base Asset Borrows
This graph shows the total borrows of the base asset over the past week.
To see updated statistics, please see the live version of this graph here.
Utilization
This graph shows the utilization (borrow / supply) of the base asset over the past week.
Supply Cap Usage
This graph shows the supply cap usage (supply / supply cap) of all collateral assets over the past week.
[Gauntlet] Scroll Ecosystem Update: (2025-02-17 through 2025-02-23)
scroll USDC Comet
Gauntlet would like to provide the community with an update on the scroll USDC comet over the past week.
Simple Summary
-
USDC Borrows increased 1.37%, from $91.95K to $93.21K.
-
USDC Supply increased 33.85%, from $105.53K to $141.25K.
-
USDC utilization decreased 24.27%, from 87.13% to 65.99%.
-
The minimum USDC reserve growth was -16.81%, and the maximum was 7.80%. The average USDC reserve growth was -9.67%.
-
The comet accumulated $-7.81 USDC reserves while distributing 0.00 COMP rewards for a weekly Net Protocol Profit of -7.81.
Base Asset APR Trend
Reserve Analysis
COMP Rewards Analysis
| Chain |
CometRewards COMP token holdings |
Daily aggregate COMP token reward distributions |
Remaining days of rewards runway (not including existing claimable rewards) |
| scroll |
0.00 |
0.00 |
0.00 |
Collateral Asset Supply
This graph shows the total supply of all collateral assets over the past week.
To see updated statistics, please see the live version of this graph here.
Base Asset Borrows
This graph shows the total borrows of the base asset over the past week.
To see updated statistics, please see the live version of this graph here.
Utilization
This graph shows the utilization (borrow / supply) of the base asset over the past week.
Supply Cap Usage
This graph shows the supply cap usage (supply / supply cap) of all collateral assets over the past week.
[Gauntlet] Scroll Ecosystem Update: (2025-02-24 through 2025-03-02)
scroll USDC Comet
Gauntlet would like to provide the community with an update on the scroll USDC comet over the past week.
Simple Summary
-
USDC Borrows decreased 2.18%, from $93.21K to $91.17K.
-
USDC Supply decreased 4.61%, from $141.25K to $134.74K.
-
USDC utilization increased 2.54%, from 65.99% to 67.67%.
-
The minimum USDC reserve growth was -13.15%, and the maximum was -10.58%. The average USDC reserve growth was -12.05%.
-
The comet accumulated $-10.29 USDC reserves while distributing 0.00 COMP rewards for a weekly Net Protocol Profit of -10.29.
Base Asset APR Trend
Reserve Analysis
COMP Rewards Analysis
| Chain |
CometRewards COMP token holdings |
Daily aggregate COMP token reward distributions |
Remaining days of rewards runway (not including existing claimable rewards) |
| scroll |
0.00 |
0.00 |
0.00 |
Collateral Asset Supply
This graph shows the total supply of all collateral assets over the past week.
To see updated statistics, please see the live version of this graph here.
Base Asset Borrows
This graph shows the total borrows of the base asset over the past week.
To see updated statistics, please see the live version of this graph here.
Utilization
This graph shows the utilization (borrow / supply) of the base asset over the past week.
Supply Cap Usage
This graph shows the supply cap usage (supply / supply cap) of all collateral assets over the past week.
[Gauntlet] Scroll Ecosystem Update: (2025-03-03 through 2025-03-09)
scroll USDC Comet
Gauntlet would like to provide the community with an update on the scroll USDC comet over the past week.
Simple Summary
-
USDC Borrows decreased 5.08%, from $91.18K to $86.54K.
-
USDC Supply decreased 4.18%, from $134.74K to $129.11K.
-
USDC utilization did not change, remaining at 67.67%.
-
The minimum USDC reserve growth was -13.93%, and the maximum was -10.13%. The average USDC reserve growth was -12.47%.
-
The comet accumulated $-9.99 USDC reserves while distributing 0.00 COMP rewards for a weekly Net Protocol Profit of -9.99.
Base Asset APR Trend
Reserve Analysis
COMP Rewards Analysis
| Chain |
CometRewards COMP token holdings |
Daily aggregate COMP token reward distributions |
Remaining days of rewards runway (not including existing claimable rewards) |
| scroll |
0.00 |
0.00 |
0.00 |
Collateral Asset Supply
This graph shows the trend of total supply of all collateral assets.
To see updated statistics, please see the live version of this graph here.
Base Asset Borrows
This graph shows the trend of total borrows of the base asset.
To see updated statistics, please see the live version of this graph here.
Utilization
This graph shows the utilization (borrow / supply) of the base asset over the past week.
Supply Cap Usage
This graph shows the supply cap usage (supply / supply cap) of all collateral assets over the past week.