[Gauntlet] Ethereum v3 WETH Update (11/03/2023 - 11/09/2023)
Gauntlet would like to provide the community with an update on metrics from the Ethereum v3 WETH comet over the past week.
Simple Summary
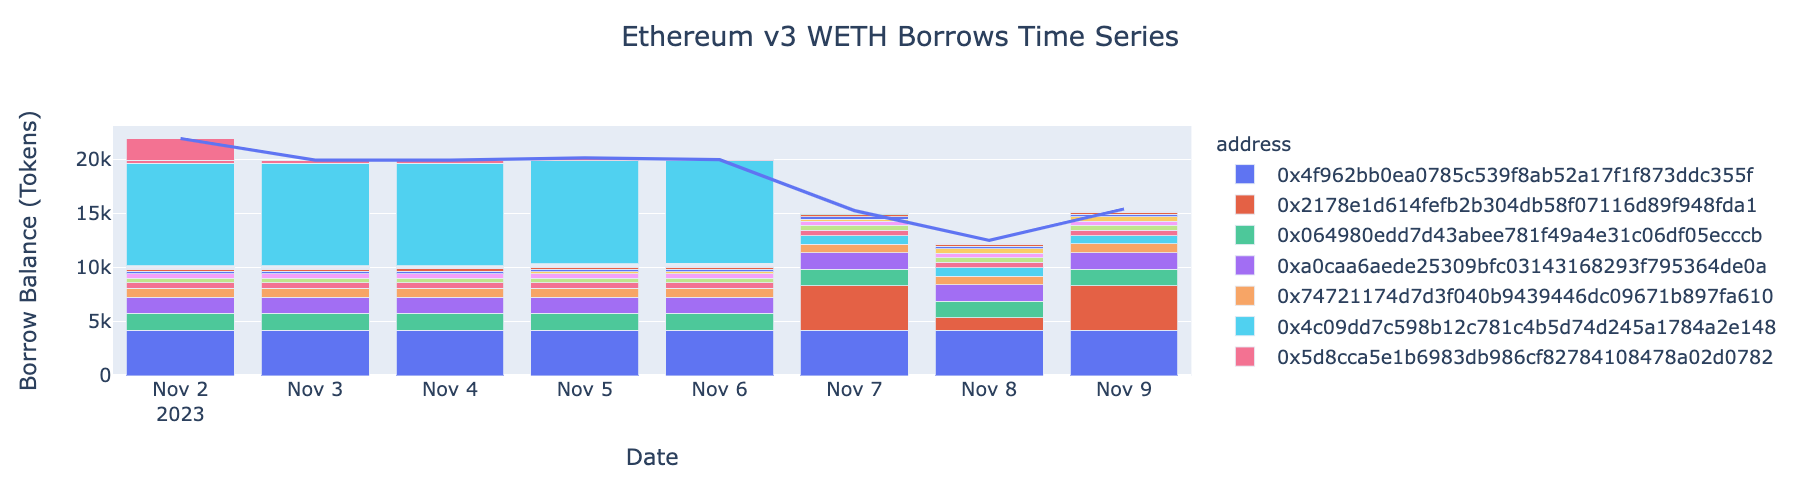
- WETH Borrows are down 29.72%, from 21.94k ($46.55M) to 15.42k ($32.72M).
- WETH Supply is down 1.38%, from 45.27k ($96.24M) to 44.65k ($94.91M).
- WETH utilization decreased 28.74%, from 48.4% to 34.5%.
- The minimum WETH reserve growth was -43.4%, and the maximum was -1.9%. The average WETH reserve growth was -17.4%.
- The comet accumulated $-2.3k WETH reserves while distributing 24.7k COMP rewards for a weekly Net Protocol Profit of -27.0k.
Analysis
Below are metrics of the market and parameters over the past week. Note that collateral supply values are normalized to end date token prices, in order to get an idea of intentional user behavior as opposed to fluctuations in underlying token prices.
Market Growth
Total Collateral (USD) is down 32.66%, from $52.65M to $35.45M.
WETH Supply is down 1.38%, from 45.27k ($96.24M) to 44.65k ($94.91M).
WETH Borrows are down 29.72%, from 21.94k ($46.55M) to 15.42k ($32.72M).
WETH utilization decreased 28.74%, from 48.4% to 34.5%.
Supply Caps
Above are the current supply cap utilizations for each collateral asset.
Above is a time series of supply cap utilization for each asset over the past week.
Utilization and Reserves
The minimum WETH utilization was 26.6%, and the maximum was 48.4%.
The minimum WETH reserve growth was -43.4%, and the maximum was -1.9%. The average WETH reserve growth was -17.4%.
The comet accumulated $-2.3k WETH reserves while distributing 24.7k COMP rewards for a weekly Net Protocol Profit of -27.0k.
1 Like
[Gauntlet] Ethereum v3 WETH Update: (11/10/23 - 11/16/23)
Gauntlet would like to provide the community with an update on the Ethereum v3 WETH comet over the past week.
Simple Summary
- WETH Borrows increased 16.42%, from $32.06M to $37.33M.
- WETH Supply decreased 10.4%, from $93.01M to $83.34M.
- WETH utilization increased 29.92%, from 34.47% to 44.79%.
- The minimum WETH reserve growth was -25.04%, and the maximum was 3.88%. The average WETH reserve growth was -8.02%.
- The comet accumulated $-1.36K WETH reserves while distributing $26.54K COMP rewards for a weekly Net Protocol Profit of $-27.9K.
Collateral Asset Supply
This graph shows the time series of total supply of all collateral assets.
To see updated statistics, please see the live version of this graph here.
WETH Borrows
This graph shows the time series of WETH borrows.
To see updated statistics, please see the live version of this graph here.
Utilization
This graph shows the utilization (borrow / supply) of WETH over the past week.
Supply Cap Usage
This graph shows the supply cap usage (supply / supply cap) of all collateral assets over the past week.
1 Like
[Gauntlet] Ethereum v3 WETH Update: (11/17/23 - 11/23/23)
Gauntlet would like to provide the community with an update on the Ethereum v3 WETH comet over the past week.
Simple Summary
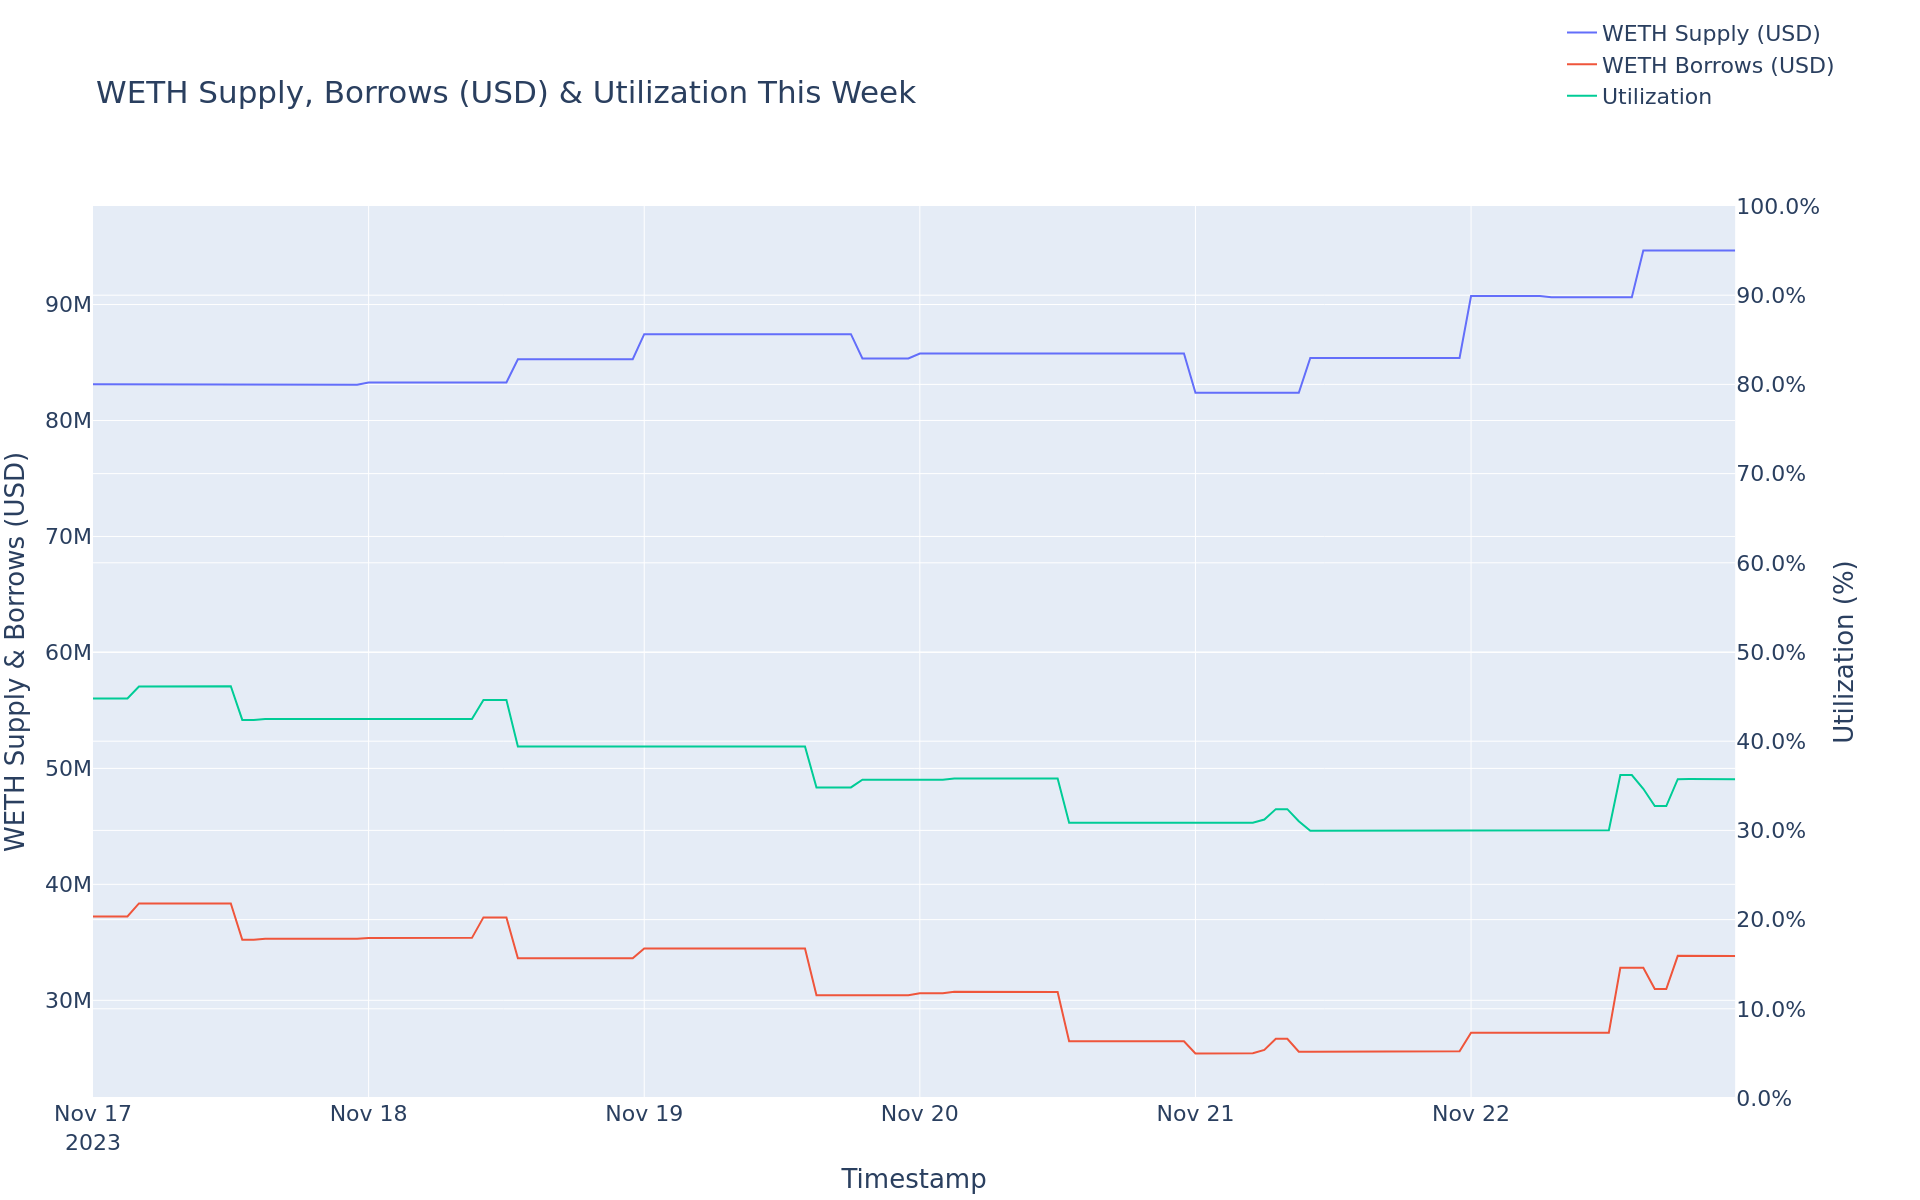
- WETH Borrows decreased 9.14%, from $37.23M to $33.83M.
- WETH Supply increased 13.85%, from $83.13M to $94.65M.
- WETH utilization decreased 20.2%, from 44.79% to 35.74%.
- The minimum WETH reserve growth was -34.99%, and the maximum was -5.02%. The average WETH reserve growth was -21.62%.
- The comet accumulated $-2.39K WETH reserves while distributing $21.35K COMP rewards for a weekly Net Protocol Profit of $-23.74K.
Asset Supply
This graph shows the time series of total supply of all assets.
To see updated statistics, please see the live version of this graph here.
WETH Borrows
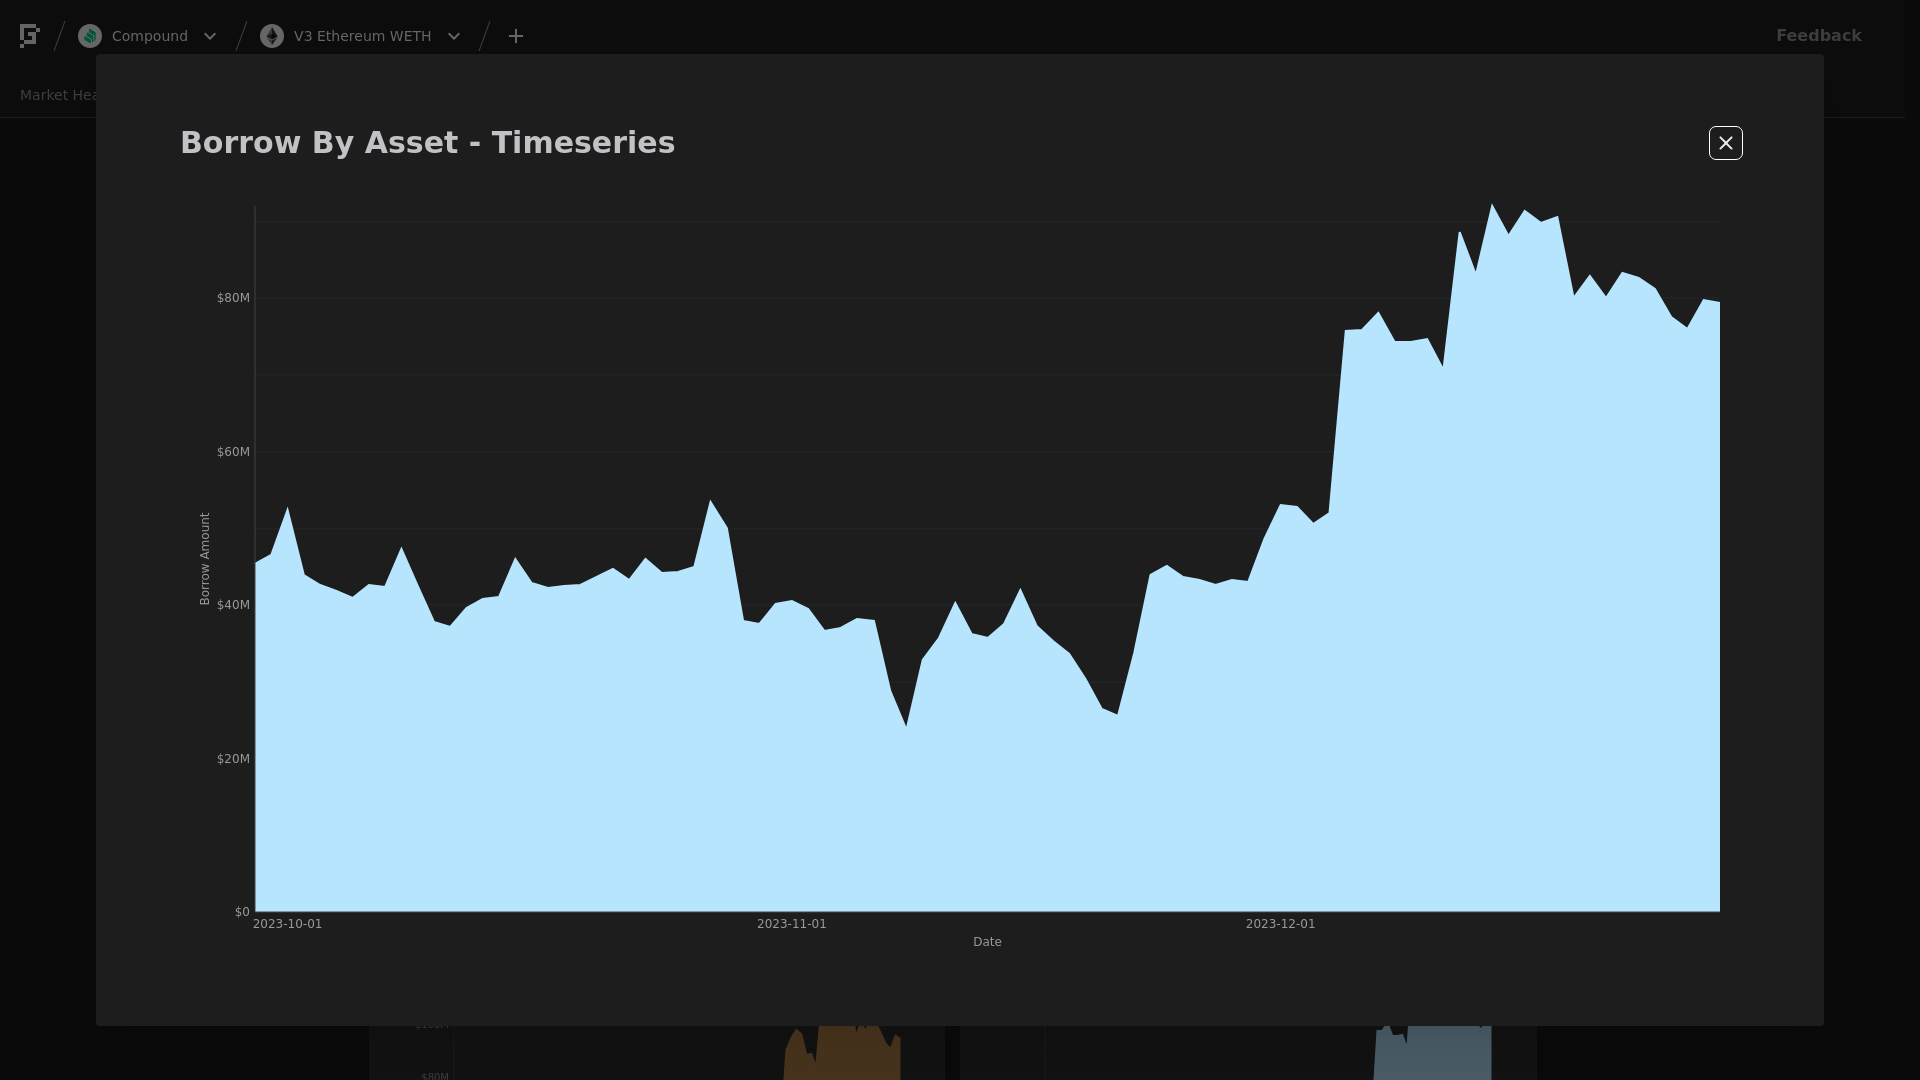
This graph shows the time series of WETH borrows.
To see updated statistics, please see the live version of this graph here.
Utilization
This graph shows the utilization (borrow / supply) of WETH over the past week.
Supply Cap Usage
This graph shows the supply cap usage (supply / supply cap) of all collateral assets over the past week.
1 Like
[Gauntlet] Ethereum v3 WETH Comet: (11/24/23 - 11/30/23)
Gauntlet would like to provide the community with an update on the Ethereum v3 WETH comet over the past week.
Simple Summary
- WETH Borrows decreased 3.24%, from $44.42M to $42.98M.
- WETH Supply increased 13.26%, from $95.58M to $108.25M.
- WETH utilization decreased 14.57%, from 46.48% to 39.71%.
- The minimum WETH reserve growth was -15.22%, and the maximum was -3.26%. The average WETH reserve growth was -7.02%.
- The comet accumulated $-1.31K WETH reserves while distributing $21.7K COMP rewards for a weekly Net Protocol Profit of $-23.01K.
Asset Supply
This graph shows the time series of total supply of all assets.
To see updated statistics, please see the live version of this graph here.
WETH Borrows
This graph shows the time series of WETH borrows.
To see updated statistics, please see the live version of this graph here.
Utilization
This graph shows the utilization (borrow / supply) of WETH over the past week.
Supply Cap Usage
This graph shows the supply cap usage (supply / supply cap) of all collateral assets over the past week.
1 Like
[Gauntlet] Ethereum v3 WETH Update: (12/1/23 - 12/7/23)
Gauntlet would like to provide the community with an update on the Ethereum v3 WETH comet over the past week.
Simple Summary
- WETH Borrows increased 52.3%, from $49.45M to $75.31M.
- WETH Supply increased 10.56%, from $108.47M to $119.92M.
- WETH utilization increased 37.76%, from 45.59% to 62.8%.
- The minimum WETH reserve growth was -7.76%, and the maximum was 14.46%. The average WETH reserve growth was -3.42%.
- The comet accumulated $-0.57K WETH reserves while distributing $18.1K COMP rewards for a weekly Net Protocol Profit of $-18.67K.
Asset Supply
This graph shows the time series of total supply of all assets.
To see updated statistics, please see the live version of this graph here.
WETH Borrows
This graph shows the time series of WETH borrows.
To see updated statistics, please see the live version of this graph here.
Utilization
This graph shows the utilization (borrow / supply) of WETH over the past week.
Supply Cap Usage
This graph shows the supply cap usage (supply / supply cap) of all collateral assets over the past week.
2 Likes
[Gauntlet] Ethereum v3 WETH Update: (12/08/23 - 12/14/23)
Gauntlet would like to provide the community with an update on metrics from the Ethereum v3 WETH comet over the past week.
Simple Summary
- WETH Borrows increased 6.25%, from $78.22M to $83.1M.
- WETH Supply decreased 5.53%, from $123.21M to $116.4M.
- WETH utilization increased 12.47%, from 63.48% to 71.4%.
- The minimum WETH reserve growth was 1.39%, and the maximum was 19.16%. The average WETH reserve growth was 10.63%.
- The comet accumulated $4.2K WETH reserves while distributing $22.26K COMP rewards for a weekly Net Protocol Profit of $-18.06K.
Collateral Asset Supply
This graph shows the total supply of all collateral assets over the past week.
To see updated statistics, please see the live version of this graph here.
Base Asset Borrows
This graph shows the total borrows of the base asset over the past week.
To see updated statistics, please see the live version of this graph here.
Utilization
This graph shows the utilization (borrow / supply) of the base asset over the past week.
Supply Cap Usage
This graph shows the supply cap usage (supply / supply cap) of all collateral assets over the past week.
2 Likes
[Gauntlet] Weekly Market Updates: Ethereum WETH: (2023-12-21 through 2023-12-27)
Gauntlet would like to provide the community with an update on metrics from the Ethereum WETH comet over the past week and will include any relevant recommendations.
Simple Summary
- WETH Borrows decreased 5.4%, from $84.35M to $79.8M.
- WETH Supply increased 17.38%, from $97.4M to $114.32M.
- WETH utilization decreased 19.4%, from 86.61% to 69.8%.
- The minimum WETH reserve growth was 11.34%, and the maximum was 25.77%. The average WETH reserve growth was 18.62%.
- The comet accumulated $8.29K WETH reserves while distributing $28.2K COMP rewards for a weekly Net Protocol Profit of $-19.9K.
Collateral Asset Supply
This graph shows the total supply of all collateral assets over the past week.
To see updated statistics, please see the live version of this graph here.
Base Asset Borrows
This graph shows the total borrows of the base asset over the past week.
To see updated statistics, please see the live version of this graph here.
Utilization
This graph shows the utilization (borrow / supply) of the base asset over the past week.
Supply Cap Usage
This graph shows the supply cap usage (supply / supply cap) of all collateral assets over the past week.
1 Like
[Gauntlet] Weekly Market Updates: Ethereum WETH (2023-12-28 through 2024-01-03)
Gauntlet would like to provide the community with an update on metrics from the Ethereum WETH comet over the past week and will include any relevant recommendations.
Simple Summary
- WETH Borrows decreased 25.05%, from $78.69M to $58.98M.
- WETH Supply decreased 11.2%, from $112.72M to $100.09M.
- WETH utilization decreased 15.59%, from 69.81% to 58.92%.
- The minimum WETH reserve growth was -3.51%, and the maximum was 16.61%. The average WETH reserve growth was 7.54%.
- The comet accumulated $3.03K WETH reserves while distributing $28.73K COMP rewards for a weekly Net Protocol Profit of $-25.71K.
Collateral Asset Supply
This graph shows the total supply of all collateral assets over the past week.
To see updated statistics, please see the live version of this graph here.
Base Asset Borrows
This graph shows the total borrows of the base asset over the past week.
To see updated statistics, please see the live version of this graph here.
Utilization
This graph shows the utilization (borrow / supply) of the base asset over the past week.
Supply Cap Usage
This graph shows the supply cap usage (supply / supply cap) of all collateral assets over the past week.
1 Like
[Gauntlet] WETH Weekly Market Updates: Ethereum WETH (2024-01-04 through 2024-01-10)
Gauntlet would like to provide the community with an update on metrics from the Ethereum WETH comet over the past week and will include any relevant recommendations.
Simple Summary
- WETH Borrows increased 16.84%, from $60.61M to $70.82M.
- WETH Supply increased 12.07%, from $102.87M to $115.28M.
- WETH utilization increased 4.26%, from 58.92% to 61.43%.
- The minimum WETH reserve growth was -6.08%, and the maximum was 3.51%. The average WETH reserve growth was -0.65%.
- The comet accumulated $-0.11K WETH reserves while distributing $25.03K COMP rewards for a weekly Net Protocol Profit of $-25.15K.
Collateral Asset Supply
This graph shows the total supply of all collateral assets over the past week.
To see updated statistics, please see the live version of this graph here.
Base Asset Borrows
This graph shows the total borrows of the base asset over the past week.
To see updated statistics, please see the live version of this graph here.
Utilization
This graph shows the utilization (borrow / supply) of the base asset over the past week.
Supply Cap Usage
This graph shows the supply cap usage (supply / supply cap) of all collateral assets over the past week.
1 Like
[Gauntlet] Weekly Market Updates: Ethereum WETH (2024-01-11 through 2024-01-17)
Gauntlet would like to provide the community with an update on the WETH comet over the past week.
Simple Summary
- WETH Borrows decreased 4.78%, from $71.8M to $68.36M.
- WETH Supply increased 3.75%, from $116.87M to $121.25M.
- WETH utilization decreased 8.22%, from 61.43% to 56.38%.
- The minimum WETH reserve growth was -7.12%, and the maximum was 9.4%. The average WETH reserve growth was -0.91%.
- The comet accumulated $-0.2K WETH reserves while distributing $27.58K COMP rewards for a weekly Net Protocol Profit of $-27.78K.
Collateral Asset Supply
This graph shows the total supply of all collateral assets over the past week.
To see updated statistics, please see the live version of this graph here.
Base Asset Borrows
This graph shows the total borrows of the base asset over the past week.
To see updated statistics, please see the live version of this graph here.
Utilization
This graph shows the utilization (borrow / supply) of the base asset over the past week.
Supply Cap Usage
This graph shows the supply cap usage (supply / supply cap) of all collateral assets over the past week.
1 Like
[Gauntlet] Weekly Market Updates: Ethereum WETH: (2024-01-19 through 2024-01-25)
Gauntlet would like to provide the community with an update on metrics from the Ethereum WETH comet over the past week and will include any relevant recommendations. Gauntlet is continuing to monitor all the Compound markets. Gauntlet is aware of the asset supply caps that are close to full utilziation. Gauntlet will continue to monitor these assets and provide recommendations based on our methodology.
Simple Summary
- WETH Borrows increased 3.29%, from $67.59M to $69.81M.
- WETH Supply increased 3.05%, from $119.4M to $123.04M.
- WETH utilization increased 0.23%, from 56.61% to 56.74%.
- The minimum WETH reserve growth was -17.34%, and the maximum was 10.29%. The average WETH reserve growth was 2.13%.
- The comet accumulated $0.89K WETH reserves while distributing $26.53K COMP rewards for a weekly Net Protocol Profit of $-25.64K.
Collateral Asset Supply
This graph shows the total supply of all collateral assets over the past week.
To see updated statistics, please see the live version of this graph here.
Base Asset Borrows
This graph shows the total borrows of the base asset over the past week.
To see updated statistics, please see the live version of this graph here.
Utilization
This graph shows the utilization (borrow / supply) of the base asset over the past week.
Supply Cap Usage
This graph shows the supply cap usage (supply / supply cap) of all collateral assets over the past week.
1 Like
[Gauntlet] Weekly Market Updates: Ethereum WETH (2024-01-26 through 2024-02-01)
Gauntlet would like to provide the community with an update on metrics from the Ethereum WETH comet over the past week and will include any relevant recommendations.
Simple Summary
- WETH Borrows decreased 10.25%, from $71.41M to $64.09M.
- WETH Supply increased 0.88%, from $125.86M to $126.97M.
- WETH utilization decreased 11.04%, from 56.74% to 50.47%.
- The minimum WETH reserve growth was -14.58%, and the maximum was 9.3%. The average WETH reserve growth was -4.46%.
- The comet accumulated $-1.15K WETH reserves while distributing $26.82K COMP rewards for a weekly Net Protocol Profit of $-27.97K.
Collateral Asset Supply
This graph shows the total supply of all collateral assets over the past week.
To see updated statistics, please see the live version of this graph here.
Base Asset Borrows
This graph shows the total borrows of the base asset over the past week.
To see updated statistics, please see the live version of this graph here.
Utilization
This graph shows the utilization (borrow / supply) of the base asset over the past week.
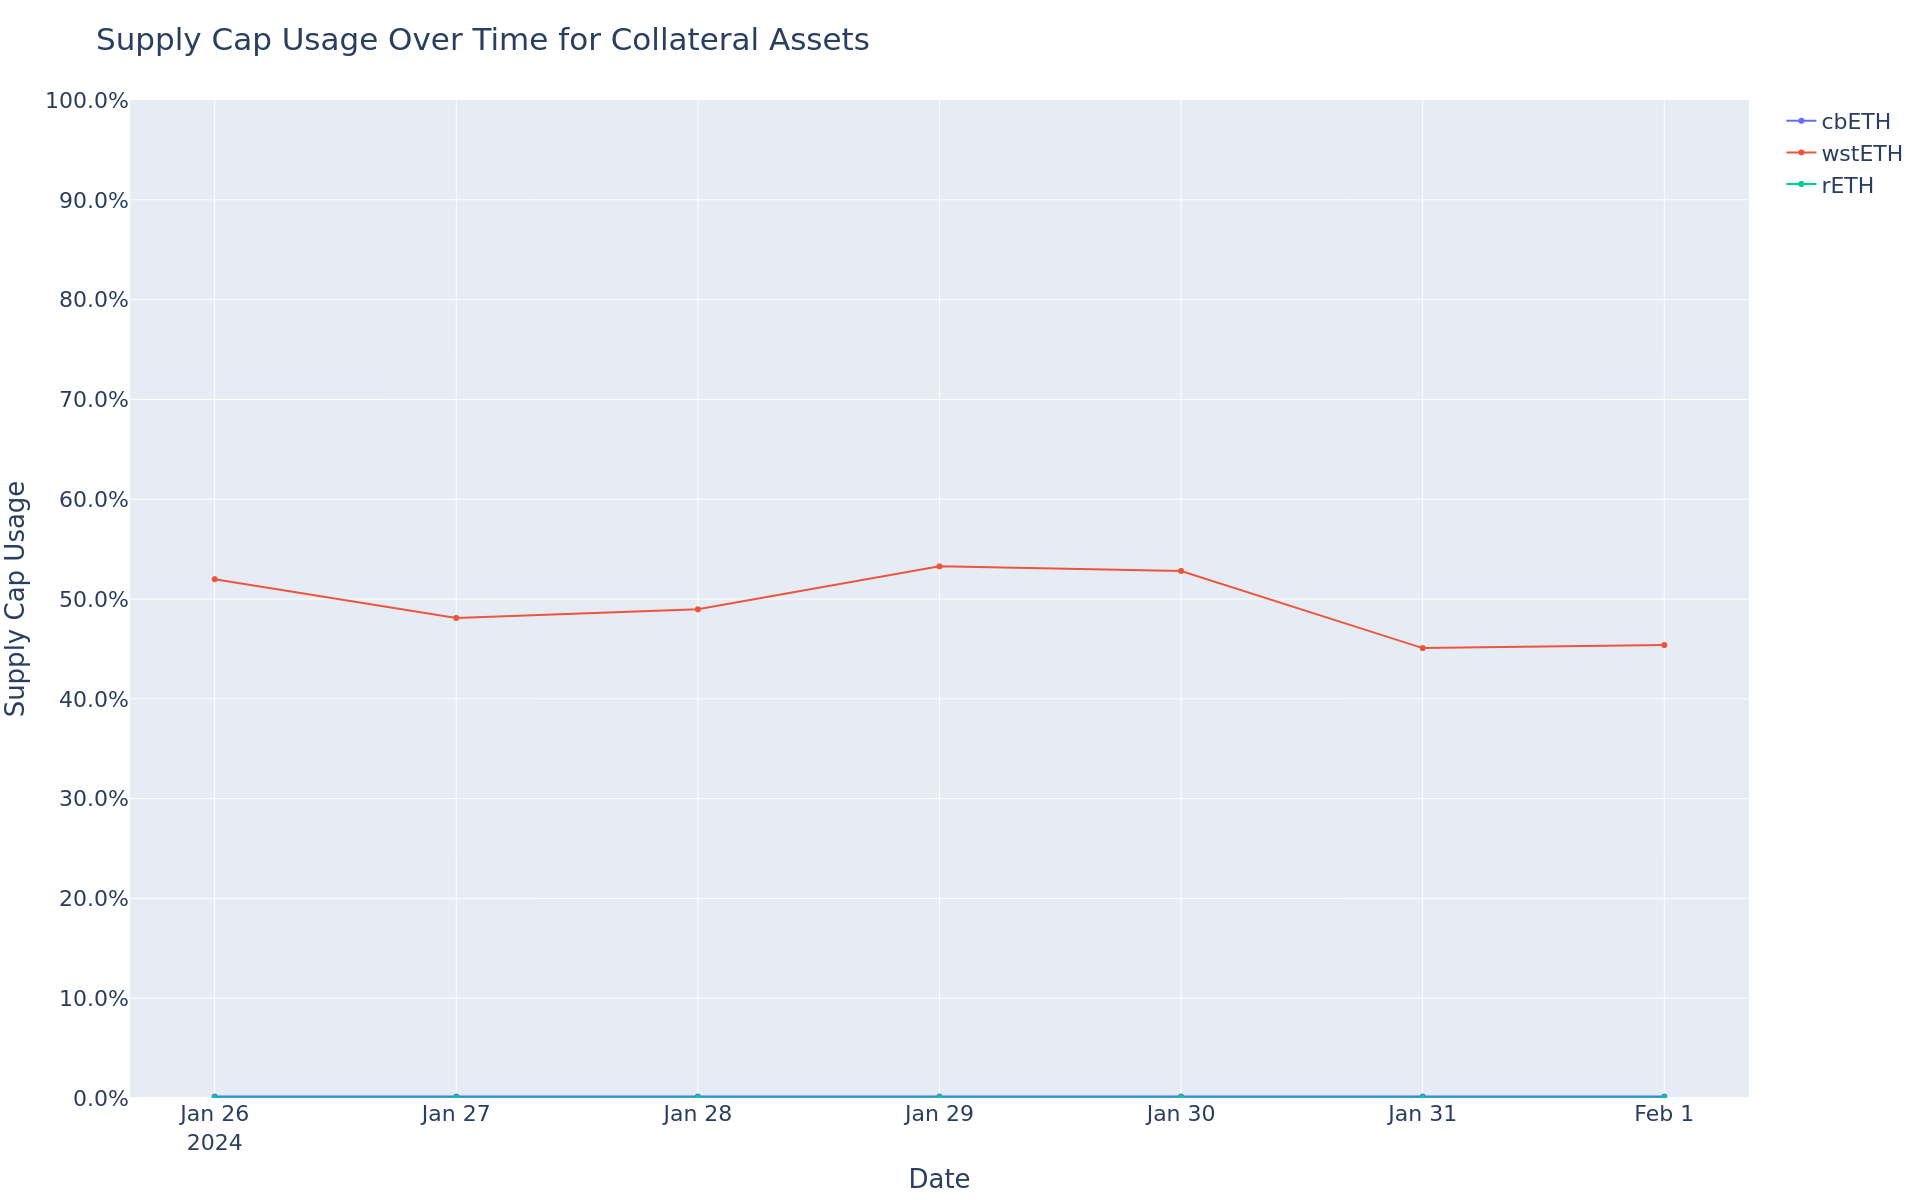
Supply Cap Usage
This graph shows the supply cap usage (supply / supply cap) of all collateral assets over the past week.
1 Like
[Gauntlet] WETH Comet Update: (2024-02-02 through 2024-02-08)
Gauntlet would like to provide the community with an update on the WETH comet over the past week.
Simple Summary
- WETH Borrows increased 8.04%, from $64.21M to $69.38M.
- WETH Supply increased 2.16%, from $127.21M to $129.96M.
- WETH utilization increased 5.76%, from 50.47% to 53.38%.
- The minimum WETH reserve growth was -17.19%, and the maximum was 7.52%. The average WETH reserve growth was -11.2%.
- The comet accumulated $-2.88K WETH reserves while distributing $26.24K COMP rewards for a weekly Net Protocol Profit of $-29.12K.
Utilization
This graph shows the utilization (borrow / supply) of the base asset over the past week.
Supply Cap Usage
This graph shows the supply cap usage (supply / supply cap) of all collateral assets over the past week.
2 Likes
[Gauntlet] Weekly Market Updates: Ethereum WETH (2024-02-09 through 2024-02-15)
Gauntlet would like to provide the community with an update on the WETH comet over the past week.
Simple Summary
- WETH Borrows increased 14.81%, from $71.29M to $81.85M.
- WETH Supply increased 7.08%, from $133.55M to $143.0M.
- WETH utilization increased 7.22%, from 53.38% to 57.24%.
- The minimum WETH reserve growth was -13.05%, and the maximum was 1.28%. The average WETH reserve growth was -9.91%.
- The comet accumulated $-3.01K WETH reserves while distributing $27.63K COMP rewards for a weekly Net Protocol Profit of $-30.63K.
Collateral Asset Supply
This graph shows the total supply of all collateral assets over the past week.
To see updated statistics, please see the live version of this graph here.
Base Asset Borrows
This graph shows the total borrows of the base asset over the past week.
To see updated statistics, please see the live version of this graph here.
Utilization
This graph shows the utilization (borrow / supply) of the base asset over the past week.
Supply Cap Usage
This graph shows the supply cap usage (supply / supply cap) of all collateral assets over the past week.
2 Likes
[Gauntlet] WETH Comet Update: (2024-02-16 through 2024-02-22)
Gauntlet would like to provide the community with an update on the WETH comet over the past week.
Simple Summary
- WETH Borrows increased 24.31%, from $81.28M to $101.05M.
- WETH Supply increased 8.31%, from $142.01M to $153.8M.
- WETH utilization increased 14.78%, from 57.24% to 65.7%.
- The minimum WETH reserve growth was -6.89%, and the maximum was 8.34%. The average WETH reserve growth was 0.38%.
- The comet accumulated $0.31K WETH reserves while distributing $29.15K COMP rewards for a weekly Net Protocol Profit of $-28.84K.
Collateral Asset Supply
This graph shows the total supply of all collateral assets over the past week.
To see updated statistics, please see the live version of this graph here.
Base Asset Borrows
This graph shows the total borrows of the base asset over the past week.
To see updated statistics, please see the live version of this graph here.
Utilization
This graph shows the utilization (borrow / supply) of the base asset over the past week.
Supply Cap Usage
This graph shows the supply cap usage (supply / supply cap) of all collateral assets over the past week.
2 Likes
[Gauntlet] WETH Comet Update: (2024-02-23 through 2024-02-29)
Gauntlet would like to provide the community with an update on the WETH comet over the past week.
Simple Summary
- WETH Borrows increased 20.6%, from $99.59M to $120.1M.
- WETH Supply increased 9.87%, from $151.58M to $166.54M.
- WETH utilization increased 9.76%, from 65.7% to 72.11%.
- The minimum WETH reserve growth was 4.79%, and the maximum was 14.18%. The average WETH reserve growth was 10.81%.
- The comet accumulated $6.25K WETH reserves while distributing $38.19K COMP rewards for a weekly Net Protocol Profit of $-31.94K.
Collateral Asset Supply
This graph shows the total supply of all collateral assets over the past week.
To see updated statistics, please see the live version of this graph here.
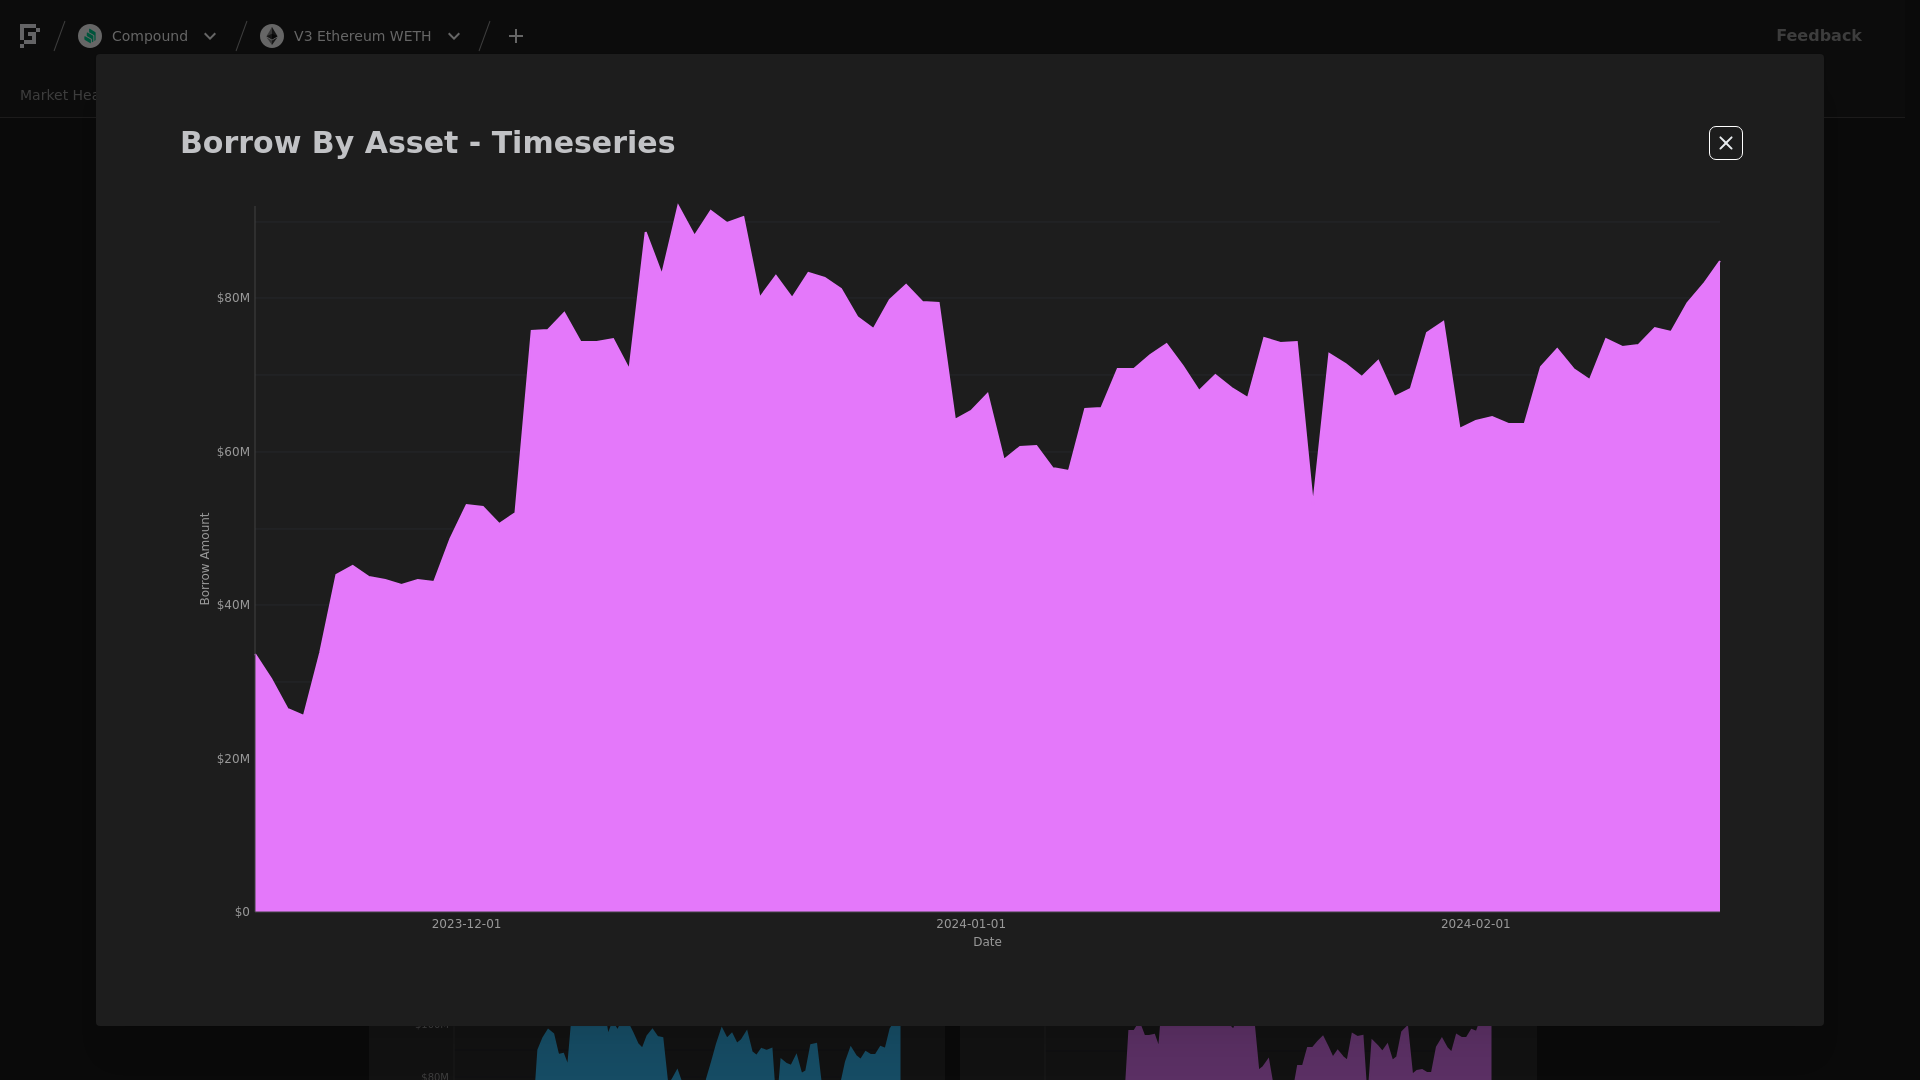
Base Asset Borrows
This graph shows the total borrows of the base asset over the past week.
To see updated statistics, please see the live version of this graph here.
Utilization
This graph shows the utilization (borrow / supply) of the base asset over the past week.
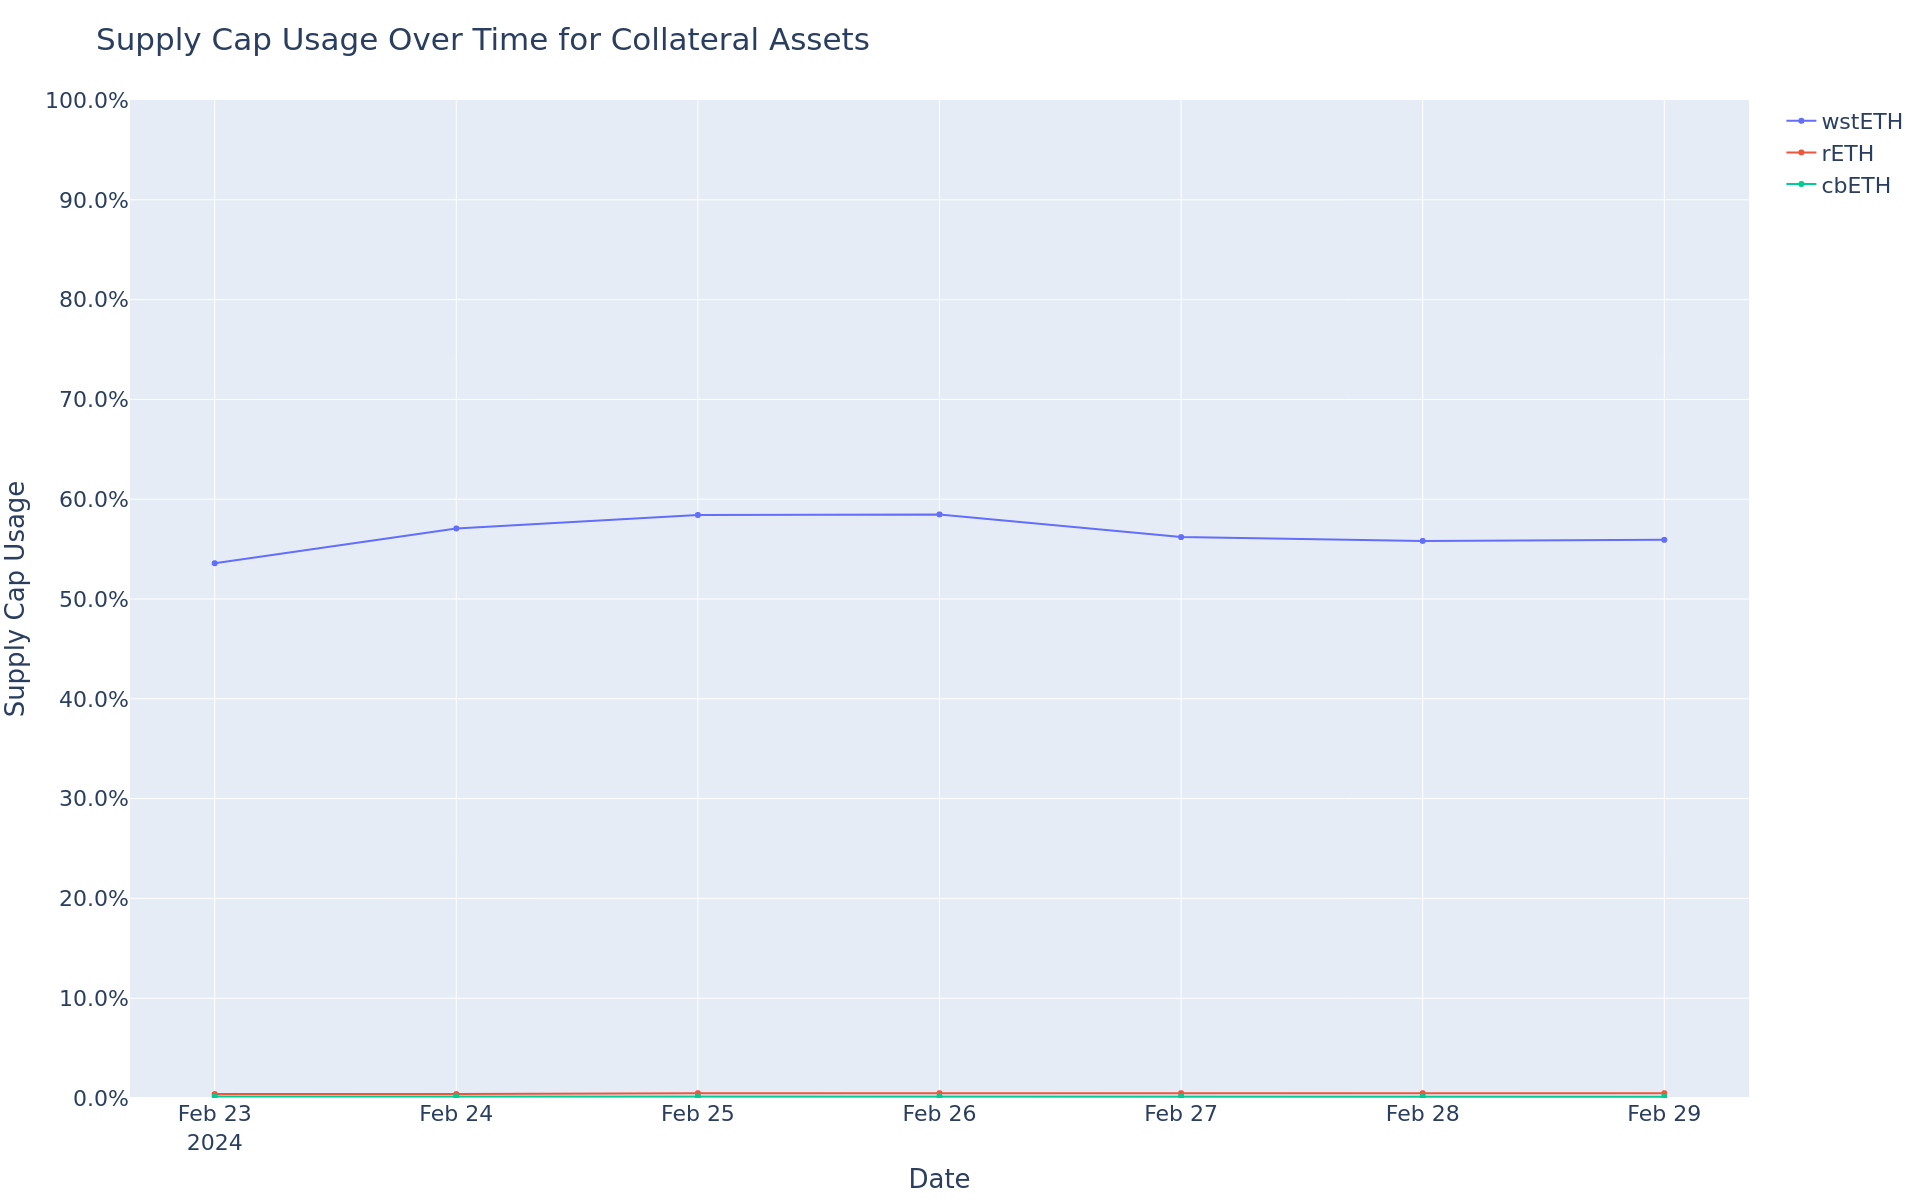
Supply Cap Usage
This graph shows the supply cap usage (supply / supply cap) of all collateral assets over the past week.
1 Like
[Gauntlet] WETH Comet Update: (2024-03-01 through 2024-03-07)
Gauntlet would like to provide the community with an update on the WETH comet over the past week.
Simple Summary
- WETH Borrows increased 6.4%, from $123.18M to $131.07M.
- WETH Supply increased 6.13%, from $170.83M to $181.3M.
- WETH utilization increased 0.25%, from 72.11% to 72.29%.
- The minimum WETH reserve growth was 4.44%, and the maximum was 13.82%. The average WETH reserve growth was 9.57%.
- The comet accumulated $5.79K WETH reserves while distributing $43.87K COMP rewards for a weekly Net Protocol Profit of $-38.09K.
Collateral Asset Supply
This graph shows the total supply of all collateral assets over the past week.
To see updated statistics, please see the live version of this graph here.
Base Asset Borrows
This graph shows the total borrows of the base asset over the past week.
To see updated statistics, please see the live version of this graph here.
Utilization
This graph shows the utilization (borrow / supply) of the base asset over the past week.
Supply Cap Usage
This graph shows the supply cap usage (supply / supply cap) of all collateral assets over the past week.
1 Like
[Gauntlet] Ethereum WETH Comet Update: (2024-03-08 through 2024-03-14)
Gauntlet would like to provide the community with an update on the Ethereum WETH comet over the past week.
Simple Summary
- WETH Borrows decreased 4.18%, from $131.85M to $126.34M.
- WETH Supply decreased 8.81%, from $182.38M to $166.31M.
- WETH utilization increased 5.08%, from 72.29% to 75.97%.
- The minimum WETH reserve growth was 4.26%, and the maximum was 17.23%. The average WETH reserve growth was 10.97%.
- The comet accumulated $6.82K WETH reserves while distributing 43.75K COMP rewards for a weekly Net Protocol Profit of -36.92K.
COMP Rewards Analysis
| Chain |
CometRewards COMP token holdings |
Daily aggregate COMP token reward distributions |
Remaining days of rewards runway (not including existing claimable rewards) |
| Ethereum |
40.26K |
427.40 |
94.20 |
Collateral Asset Supply
This graph shows the total supply of all collateral assets over the past week.
To see updated statistics, please see the live version of this graph here.
Base Asset Borrows
This graph shows the total borrows of the base asset over the past week.
To see updated statistics, please see the live version of this graph here.
Utilization
This graph shows the utilization (borrow / supply) of the base asset over the past week.
Supply Cap Usage
This graph shows the supply cap usage (supply / supply cap) of all collateral assets over the past week.
[Gauntlet] Ethereum WETH Comet Update: (2024-03-15 through 2024-03-21)
Gauntlet would like to provide the community with an update on the Ethereum WETH comet over the past week.
Simple Summary
- WETH Borrows decreased 4.59%, from $126.89M to $121.06M.
- WETH Supply decreased 3.30%, from $167.04M to $161.53M.
- WETH utilization decreased 1.34%, from 75.97% to 74.95%.
- The minimum WETH reserve growth was 3.88%, and the maximum was 21.55%. The average WETH reserve growth was 15.49%.
- The comet accumulated $10.10K WETH reserves while distributing 37.00K COMP rewards for a weekly Net Protocol Profit of -26.91K.
Base Asset IR Analysis
COMP Rewards Analysis
| Chain |
CometRewards COMP token holdings |
Daily aggregate COMP token reward distributions |
Remaining days of rewards runway (not including existing claimable rewards) |
| Ethereum |
37.38K |
427.40 |
87.50 |
Collateral Asset Supply
This graph shows the total supply of all collateral assets over the past week.
To see updated statistics, please see the live version of this graph here.
Base Asset Borrows
This graph shows the total borrows of the base asset over the past week.
To see updated statistics, please see the live version of this graph here.
Utilization
This graph shows the utilization (borrow / supply) of the base asset over the past week.
Supply Cap Usage
This graph shows the supply cap usage (supply / supply cap) of all collateral assets over the past week.
[Gauntlet] Ethereum WETH Comet Update: (2024-03-22 through 2024-03-28)
Gauntlet would like to provide the community with an update on the Ethereum WETH comet over the past week.
Simple Summary
- WETH Borrows increased 1.18%, from $121.12M to $122.55M.
- WETH Supply increased 17.99%, from $161.61M to $190.69M.
- WETH utilization decreased 14.25%, from 74.95% to 64.27%.
- The minimum WETH reserve growth was -2.89%, and the maximum was 19.50%. The average WETH reserve growth was 11.79%.
- The comet accumulated $7.34K WETH reserves while distributing 36.95K COMP rewards for a weekly Net Protocol Profit of -29.62K.
Base Asset APR Trend
COMP Rewards Analysis
| Chain |
CometRewards COMP token holdings |
Daily aggregate COMP token reward distributions |
Remaining days of rewards runway (not including existing claimable rewards) |
| Ethereum |
34.45K |
292.00 |
118.00 |
Collateral Asset Supply
This graph shows the total supply of all collateral assets over the past week.
To see updated statistics, please see the live version of this graph here.
Base Asset Borrows
This graph shows the total borrows of the base asset over the past week.
To see updated statistics, please see the live version of this graph here.
Utilization
This graph shows the utilization (borrow / supply) of the base asset over the past week.
Supply Cap Usage
This graph shows the supply cap usage (supply / supply cap) of all collateral assets over the past week.