Simple Summary
Gauntlet is excited to announce a major upgrade to our risk metrics which will allow us to more accurately and holistically quantify protocol risks. This upgrade is the result of months of research and development on more granular simulation techniques and is now live across all our risk management clients.
What is VaR?
In quantitative analysis, Value-at-Risk (VaR) is a popular metric for the overall riskiness of a system. Given a range of possible profit or loss outcomes, VaR represents the losses incurred in the worst percentiles of the distribution. As a straightforward way to quantify tail risk scenarios, VaR is widely used by market participants ranging from DeFi protocols to major traditional institutions.

For risk management customers, we use VaR to communicate levels of market risk and changes to the level over time. Gauntlet’s dashboards display daily VaR calculations as a topline metric for community information. Frequently, we also highlight changes in VaR due to parameter adjustments or market events that materially affect protocol risk.
Methodology Upgrade
Thanks to simulation improvements, Gauntlet is now able to deliver a more accurate and holistic version of VaR. Our previous methodology estimated the tail risk of a market through a wide range of non-specific simulation scenarios. With the higher granularity of model price paths in our new simulations, we are able to more explicitly capture particular market risks. The new methodology classifies risks into two high-level categories:
- Broad Market Downturn: Large correlated price downturns in many non-stablecoin assets
- Broken Correlation: Large abnormal moves in asset pairs that are typically highly correlated or economically linked. This includes liquid staking tokens diverging from the underlying staked assets and stablecoins diverging from their usual stable prices.
Most DeFi protocols are affected by broad market downturns and some are also subject to broken correlation risks. Depending on the protocol, we tailor our VaR toward the appropriate mix of risk exposures. For example, since the Compound III WETH Comet is primarily used for borrowing against highly correlated collateral, we focus more on broken correlation scenarios for this deployment.
Due to the lower granularity of the old methodology, it also included some unrealistic simulation runs which occasionally exaggerated risk. This resulted in our VaR estimates leaning too pessimistic and overstating the actual worst losses. The new VaR methodology reduces skew from simulation outliers and produces a cleaner and more unbiased estimate of actual risk.
How it Works
All these improvements are enabled by a new approach to modeling asset prices. Since our risk metrics are based on simulated price paths, starting with a more powerful price model unlocks many new opportunities. The key difference in the new methodology is an optional movable price target for any individual asset. Previously, we simulated asset prices based on historical volatility, correlation, and other statistical factors, but did not target any specific price levels looking forward. This resulted in a very wide range of possible price paths and limited our ability to define cases of interest.

In the new price model, we have the option to set targets for individual prices to fine-tune the space of possible outcomes. For example, we can now simulate scenarios like a particular level of ETH price drawdown or a pre-defined percentage disparity between USDC and DAI.
Importantly, this feature does not sacrifice any of the strengths of the old methodology. While targets for the end of the simulation can be set, prices are otherwise still subject to the original model dynamics. Price paths in the new simulations similarly reflect realistic correlations, volatilities, and statistical properties of the market, but now with more granular inputs.
Comparisons to Old Methodology
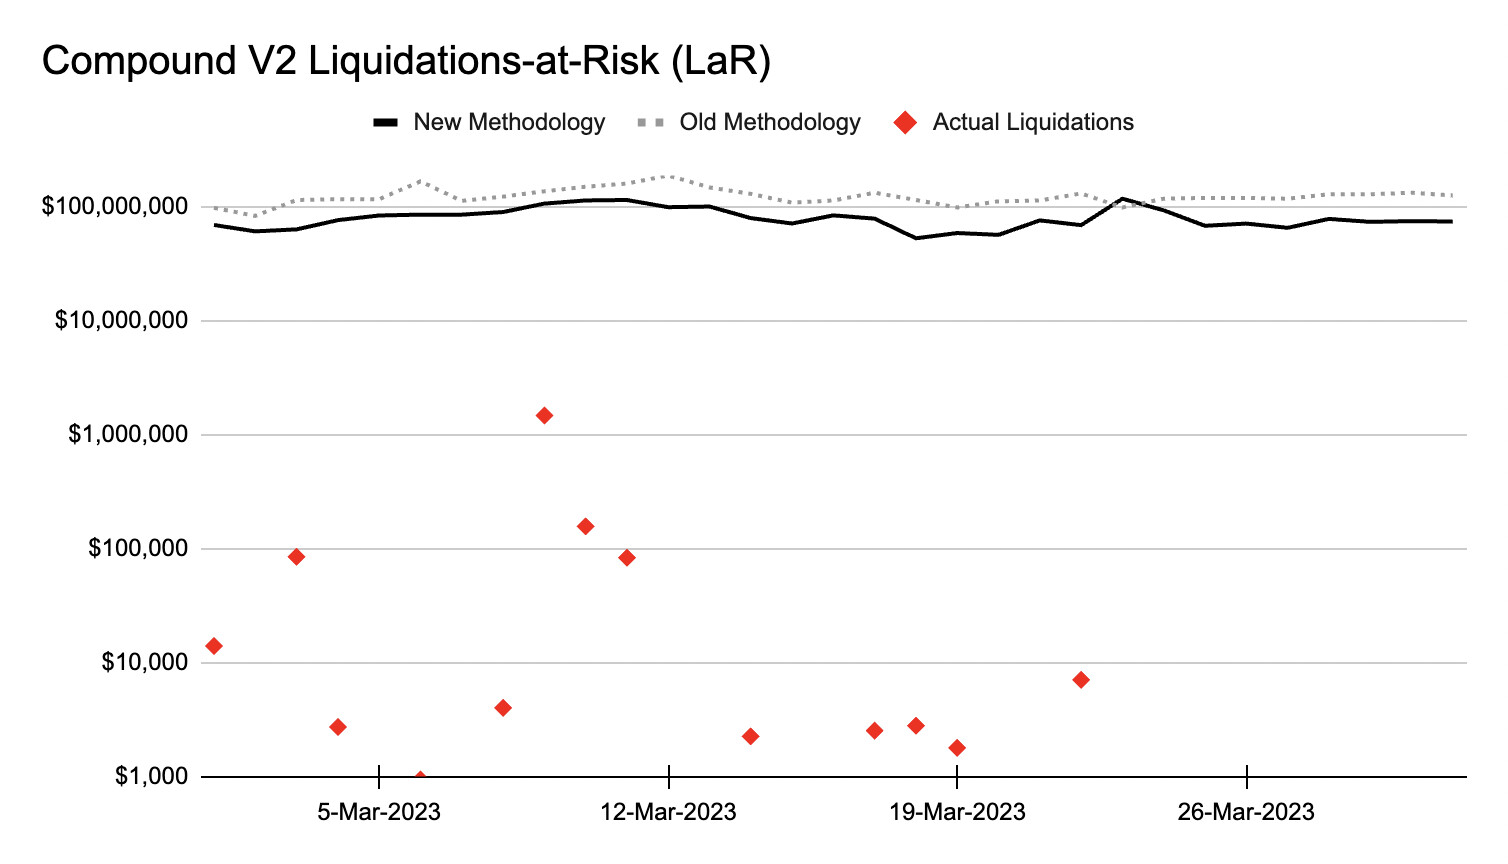
Gauntlet’s new VaR methodology is a significant improvement over our prior work. In the charts below, we contrast our results using both models with the actual insolvencies on Compound. Since VaR is a tail risk metric, the reduced noise in the new model usually produces a somewhat lower estimate. We note that for the Compound V3 WETH Comet, liquidations and insolvencies will only happen during large price deviations in liquid staking tokens. As this has not occured recently, the actual liquidations and insolvencies on the V3 WETH charts are zero.


To supplement VaR, we also calculate a similar metric for liquidations. Though liquidations on lending protocols do not necessarily lead to insolvencies, having a view on them can be helpful for risk management and general information purposes. The new methodology had similar impacts on our Liquidations-at-Risk (LaR) metric, making it more robust and accurate and less skewed by outliers.


By providing these improved metrics, Gauntlet looks to enable better fine-tuning of protocol parameters and clarity around our risk management decisions. While the old and new metrics are usually directionally aligned, the higher accuracy of the new model allows us to be more granular and clear about the actions we recommend. In the future, we look forward to sharing further upgrades as we continue to refine our models for more risk scenarios.
Quick Links
- Summary Tweet
- Medium article
- Gauntlet risk management dashboards