As of 11/8 11:59pm UTC, Compound II has experienced no new insolvencies despite the recent market crash. Prior to the market crash, Compound VaR had greatly decreased this past week due to the market uptick and risky users updating their positions to be safer. Even after the crash, as of 11/8 11:59pm UTC the Value at Risk (VaR) in our simulations is $0, despite Liquidations at Risk (LaR) increasing to $169.59M.
Simulation Statistics

Value at Risk (VaR) time series since 2022-10-01

Liquidations at Risk (LaR) time series since 2022-10-01

Market Snapshot Stats
Total Liquidations by Assets since Nov 1st

Compound market liquidated approximately $747k in collateral assets yesterday. Asset cETH had the largest liquidation amount totaling $605.3k.
Liquidations on Nov 8th by Assets

Compound had liquidation repayment amounts of $580k yesterday with no large insolvencies.
Liquidation Repaid Amount by Assets

AVG Asset Collateralization Rates

AVG Collateralization Ratios represent the entire collateralization ratio of each user and calculate the average ratio by weighing the ratio by total asset supply. Collateralization Ratios did experience some significant changes from Nov 7th to Nov 8th. We would note that Sushi experienced a 30% increase in collateralization ratio.
Percentage Change in AVG Collateralization Ratios from Nov 7th to Nov 8th

Risky Users Analysis
In the charts below, “11/9” refers to data from 11/8 11:59pm UTC.
User: 0xe84a061897afc2e7ff5fb7e3686717c528617487
User supply time series since 2022-11-07

User borrows time series since 2022-11-07

User borrow usage time series since 2022-11-07

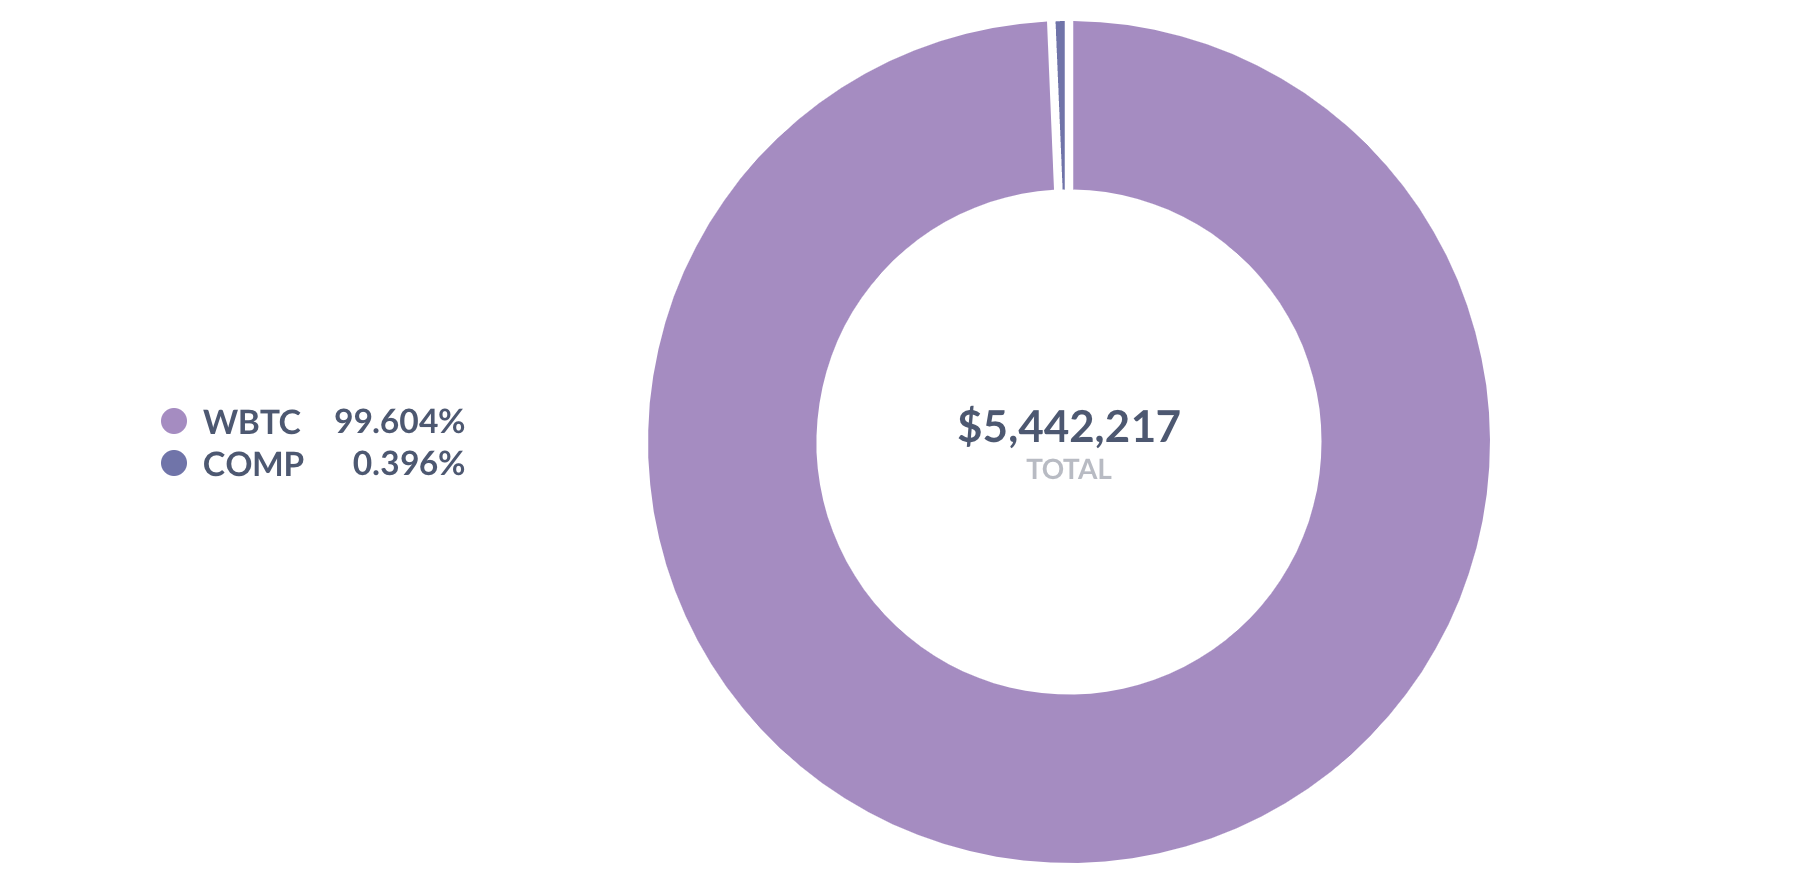
User supply breakdown 11/9

User borrowing power breakdown 11/9

User borrows breakdown 11/9

User borrow usage 11/9

This user has updated their position multiple times today to increase their WBTC supply as WBTC price has continued to decrease, but their position is still riskier than it was prior to the crash (86% borrow usage).
User: 0x99e881e9e89152b0add27c367f0761f0fbe5ddc3
User supply time series since 2022-11-07

User borrows time series since 2022-11-07

User borrow usage time series since 2022-11-07

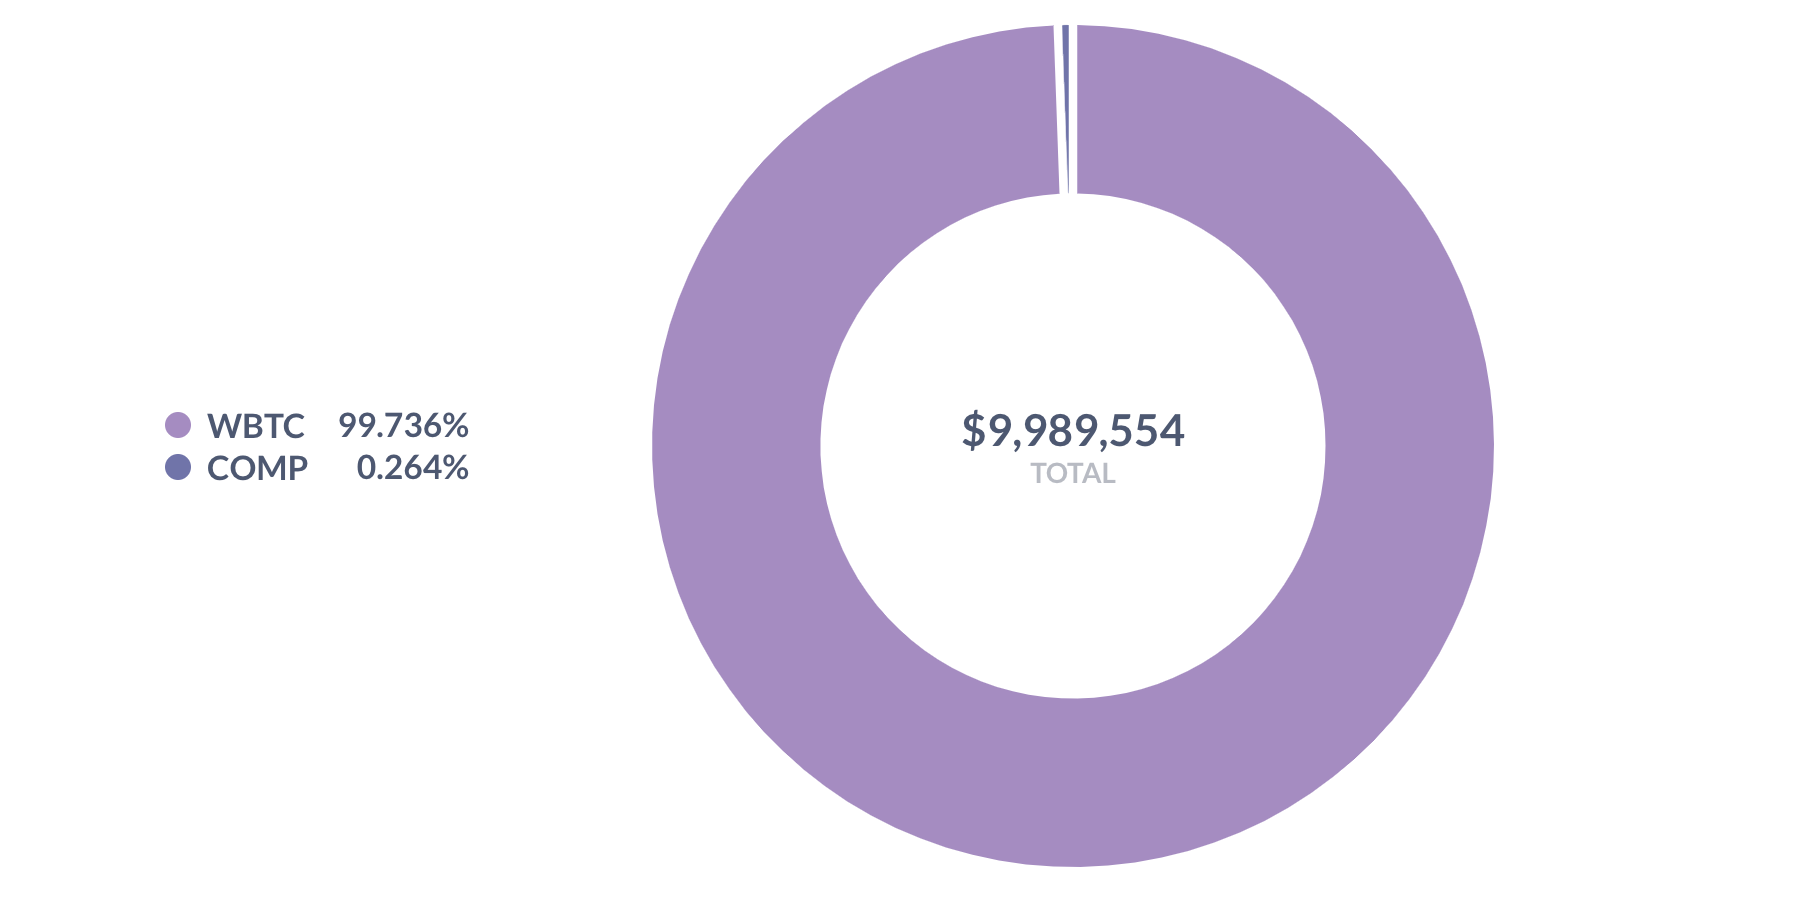
User supply breakdown 11/9

User borrowing power breakdown 11/9

User borrows breakdown 11/9

User borrow usage 11/9

User: 0xceef57f6c40a7cb2392eaad101ee0440aa43ba42
User supply time series since 2022-11-07

User borrows time series since 2022-11-07

User borrow usage time series since 2022-11-07

User supply breakdown 11/9

User borrowing power breakdown 11/9
User borrows breakdown 11/9

User borrow usage 11/9

This user previously had not updated their position since 2022-06-18, but this user updated their position today to decrease their supply to $7.67M WBTC and $32k COMP, and decrease their DAI borrows to $4.49M DAI and $423k USDT, which results in a borrow usage of 91%.
User: 0xedd54cc255ac1fe407f4113ec22a1d82fd5a2f71
User supply time series since 2022-11-07

User borrows time series since 2022-11-07

User borrow usage time series since 2022-11-07

User supply breakdown 11/9

User borrowing power breakdown 11/9

User borrows breakdown 11/9

User borrow usage 11/9

As of 2022-11-09 07:30 PM UTC this user increased their WBTC supply but still has a borrow usage of 91% due to WBTC price continuing to decrease.
User: 0x7e6f6621388047c8a481d963210b514dbd5ea1b9
User supply time series since 2022-11-07

User borrows time series since 2022-11-07

User borrow usage time series since 2022-11-07

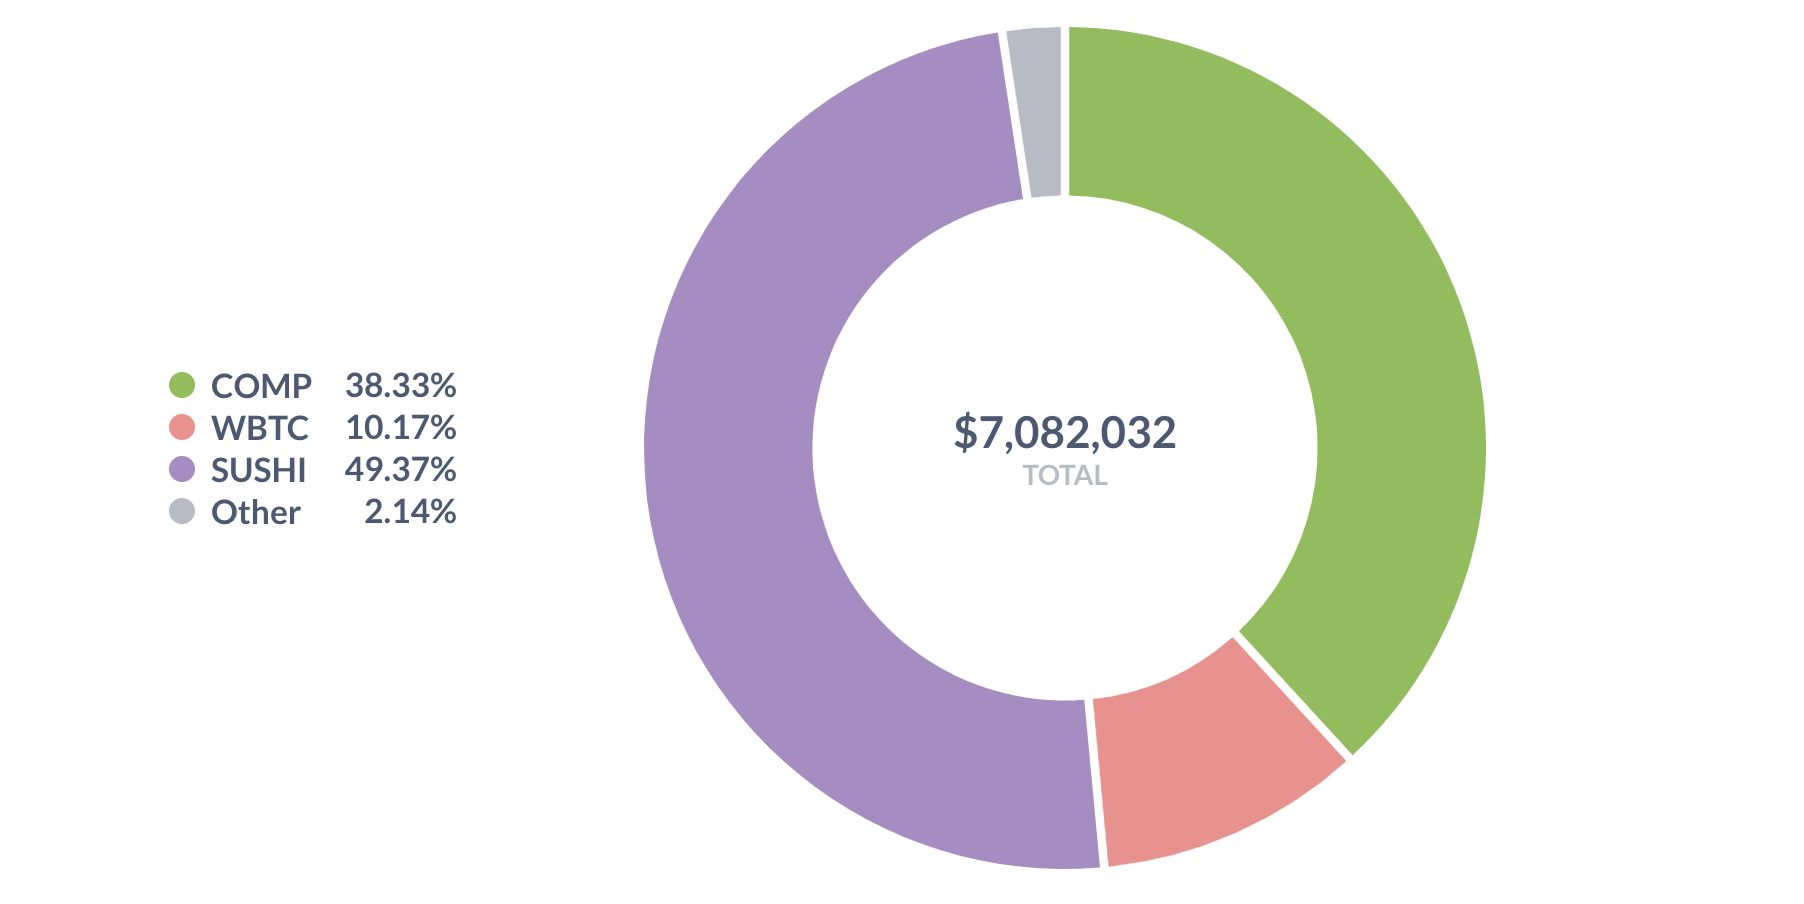
User supply breakdown 11/9
User borrowing power breakdown 11/9

User borrows breakdown 11/9

User borrow usage 11/9

This large SUSHI supplier recently added $2.7M worth of COMP supply to increase the safety of their position.