[Gauntlet] Polygon USDC.e Comet Update: (2024-05-06 through 2024-05-12)
Gauntlet would like to provide the community with an update on the Polygon USDC.e comet over the past week.
Simple Summary
-
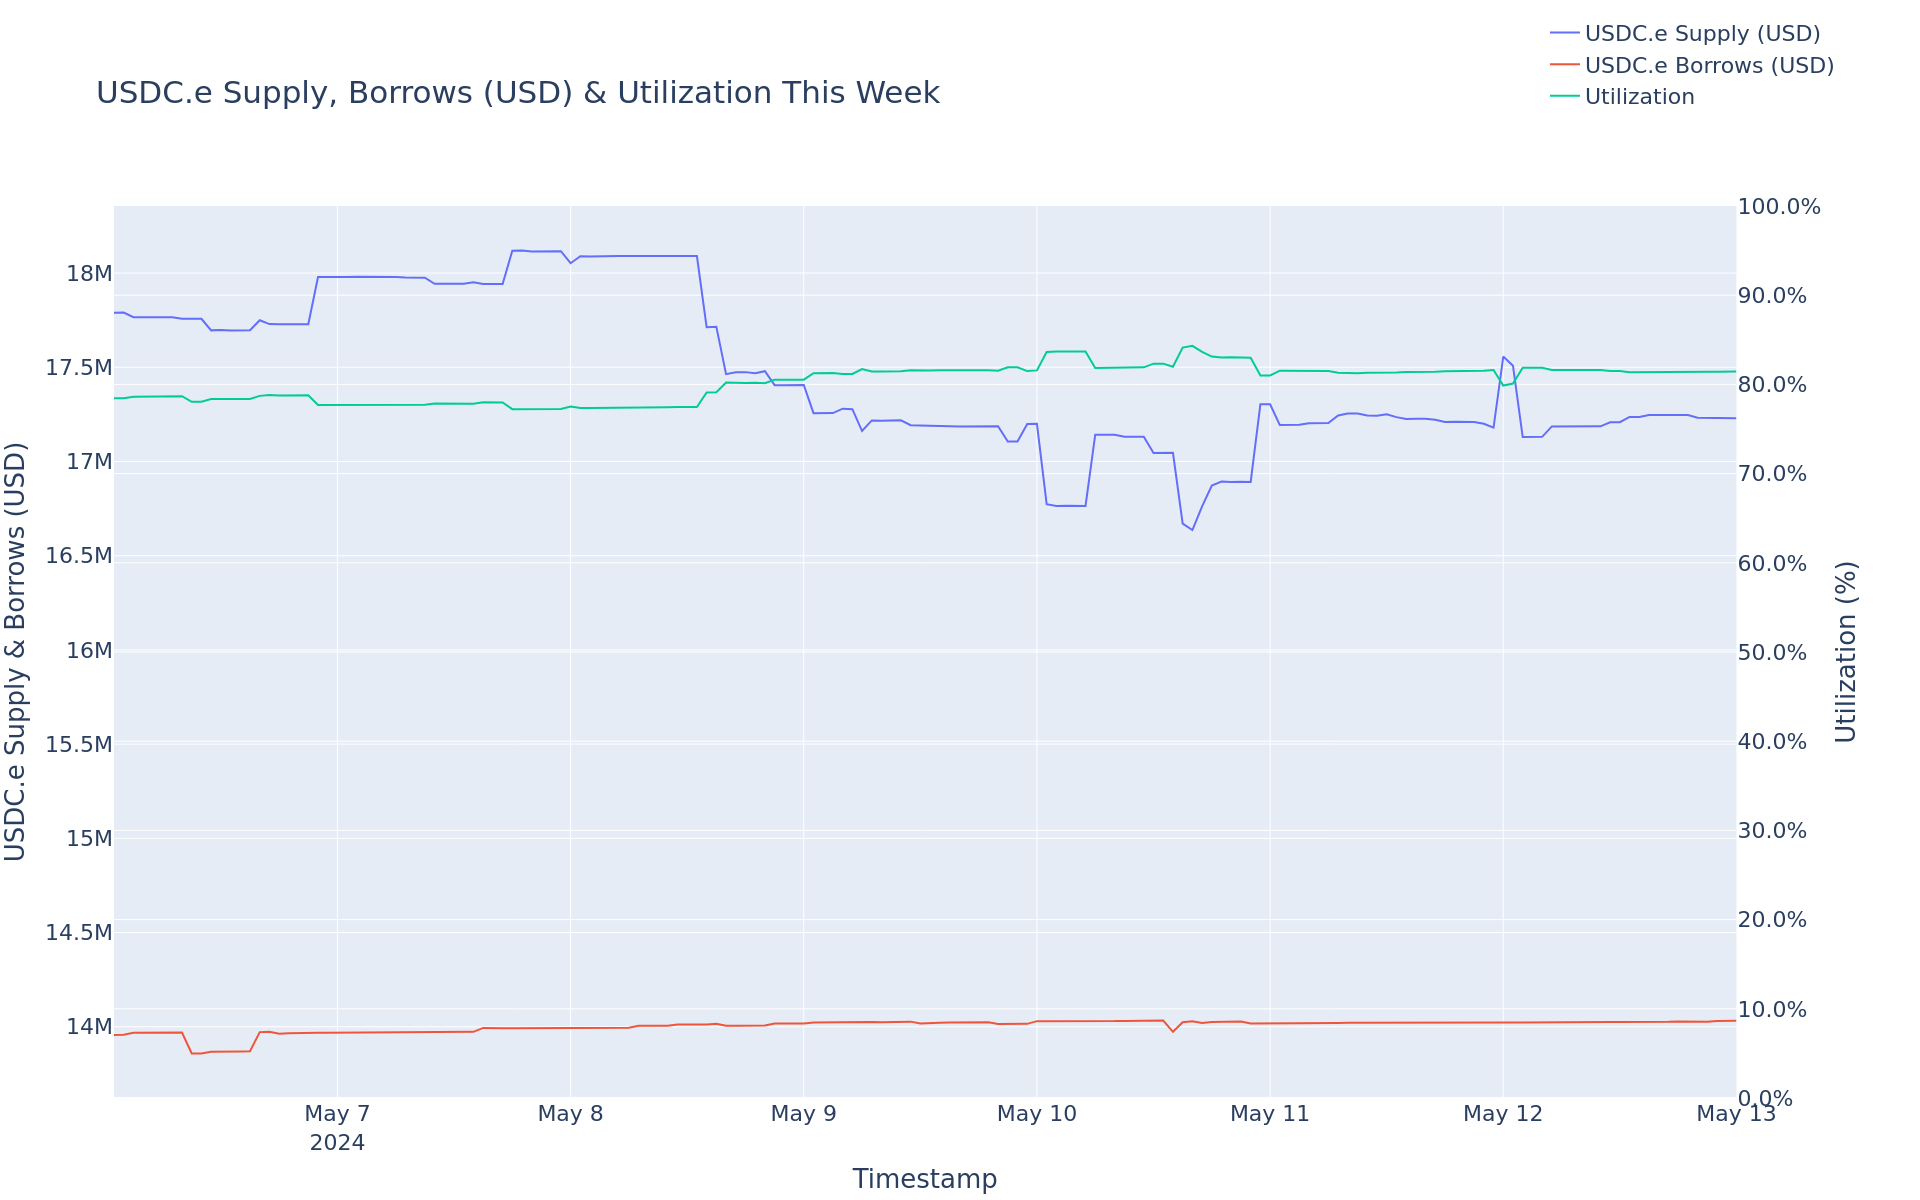
USDC.e Borrows have not changed, remaining at $13.96M.
-
USDC.e Supply decreased 3.15%, from $17.79M to $17.23M.
-
USDC.e utilization increased 3.81%, from 78.45% to 81.44%.
-
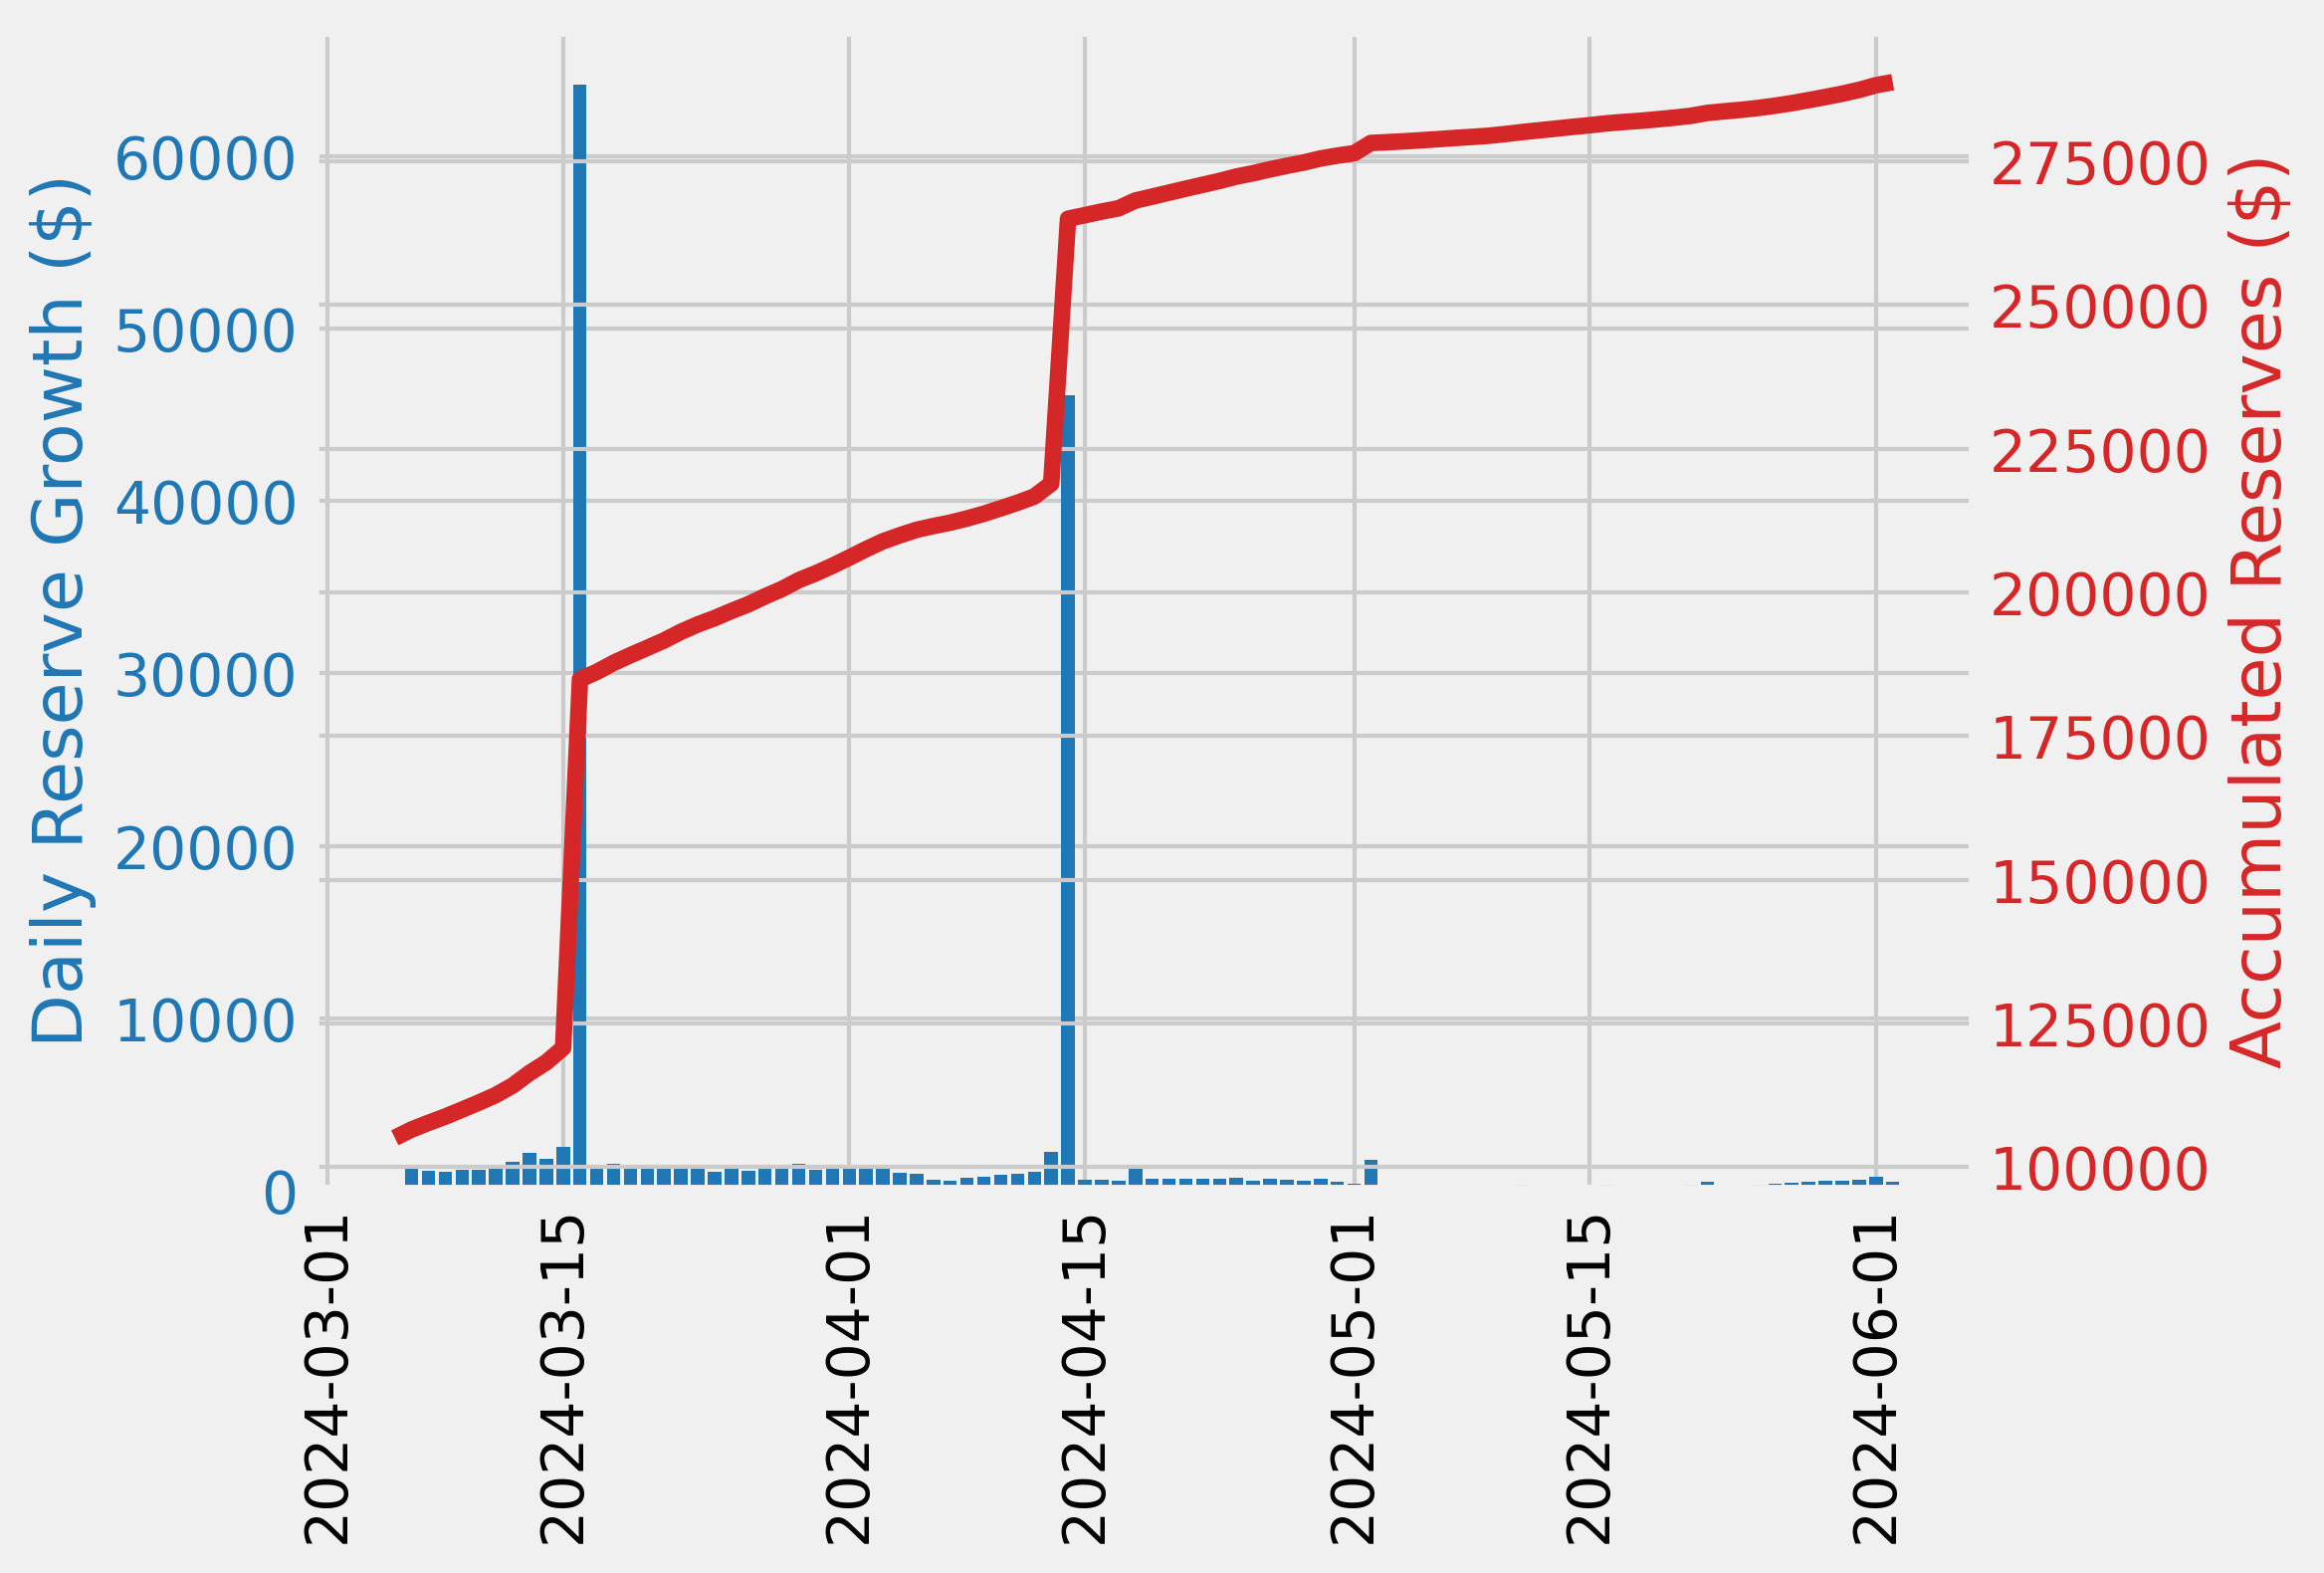
The minimum USDC.e reserve growth was 5.45%, and the maximum was 12.02%. The average USDC.e reserve growth was 8.33%.
-
The comet accumulated $1.84K USDC.e reserves while distributing 8.95K COMP rewards for a weekly Net Protocol Profit of -7.11K.
Base Asset APR Trend
Reserve Analysis
COMP Rewards Analysis
| Chain |
CometRewards COMP token holdings |
Daily aggregate COMP token reward distributions |
Remaining days of rewards runway (not including existing claimable rewards) |
| Polygon |
8.54K |
23.00 |
371.40 |
Collateral Asset Supply
This graph shows the total supply of all collateral assets over the past week.
To see updated statistics, please see the live version of this graph here.
Base Asset Borrows
This graph shows the total borrows of the base asset over the past week.
To see updated statistics, please see the live version of this graph here.
Utilization
This graph shows the utilization (borrow / supply) of the base asset over the past week.
Supply Cap Usage
This graph shows the supply cap usage (supply / supply cap) of all collateral assets over the past week.
[Gauntlet] Polygon USDC.e Comet Update: (2024-05-13 through 2024-05-19)
Gauntlet would like to provide the community with an update on the Polygon USDC.e comet over the past week.
Simple Summary
-
USDC.e Borrows decreased 1.89%, from $14.03M to $13.77M.
-
USDC.e Supply has not changed, remaining at $17.23M.
-
USDC.e utilization decreased 1.24%, from 81.43% to 80.42%.
-
The minimum USDC.e reserve growth was 6.19%, and the maximum was 11.32%. The average USDC.e reserve growth was 8.63%.
-
The comet accumulated $1.89K USDC.e reserves while distributing 8.90K COMP rewards for a weekly Net Protocol Profit of -7.00K.
Base Asset APR Trend
Reserve Analysis
COMP Rewards Analysis
| Chain |
CometRewards COMP token holdings |
Daily aggregate COMP token reward distributions |
Remaining days of rewards runway (not including existing claimable rewards) |
| Polygon |
8.46K |
23.00 |
367.90 |
Collateral Asset Supply
This graph shows the total supply of all collateral assets over the past week.
To see updated statistics, please see the live version of this graph here.
Base Asset Borrows
This graph shows the total borrows of the base asset over the past week.
To see updated statistics, please see the live version of this graph here.
Utilization
This graph shows the utilization (borrow / supply) of the base asset over the past week.
Supply Cap Usage
This graph shows the supply cap usage (supply / supply cap) of all collateral assets over the past week.
[Gauntlet] Polygon USDC.e Comet Update: (2024-05-20 through 2024-05-26)
Gauntlet would like to provide the community with an update on the Polygon USDC.e comet over the past week.
Simple Summary
-
USDC.e Borrows increased 3.76%, from $13.77M to $14.28M.
-
USDC.e Supply decreased 3.38%, from $17.13M to $16.56M.
-
USDC.e utilization increased 7.39%, from 80.34% to 86.28%.
-
The minimum USDC.e reserve growth was 6.24%, and the maximum was 16.40%. The average USDC.e reserve growth was 11.04%.
-
The comet accumulated $2.54K USDC.e reserves while distributing 9.88K COMP rewards for a weekly Net Protocol Profit of -7.34K.
Base Asset APR Trend
Reserve Analysis
COMP Rewards Analysis
| Chain |
CometRewards COMP token holdings |
Daily aggregate COMP token reward distributions |
Remaining days of rewards runway (not including existing claimable rewards) |
| Polygon |
8.26K |
23.00 |
359.00 |
Collateral Asset Supply
This graph shows the total supply of all collateral assets over the past week.
To see updated statistics, please see the live version of this graph here.
Base Asset Borrows
This graph shows the total borrows of the base asset over the past week.
To see updated statistics, please see the live version of this graph here.
Utilization
This graph shows the utilization (borrow / supply) of the base asset over the past week.
Supply Cap Usage
This graph shows the supply cap usage (supply / supply cap) of all collateral assets over the past week.
[Gauntlet] Polygon USDC.e Comet Update: (2024-05-27 through 2024-06-02)
Gauntlet would like to provide the community with an update on the Polygon USDC.e comet over the past week.
Simple Summary
-
USDC.e Borrows decreased 1.75%, from $14.29M to $14.03M.
-
USDC.e Supply decreased 5.31%, from $16.56M to $15.68M.
-
USDC.e utilization increased 3.76%, from 86.28% to 89.52%.
-
The minimum USDC.e reserve growth was 13.66%, and the maximum was 16.64%. The average USDC.e reserve growth was 15.49%.
-
The comet accumulated $4.20K USDC.e reserves while distributing 9.70K COMP rewards for a weekly Net Protocol Profit of -5.50K.
Base Asset APR Trend
Reserve Analysis
COMP Rewards Analysis
| Chain |
CometRewards COMP token holdings |
Daily aggregate COMP token reward distributions |
Remaining days of rewards runway (not including existing claimable rewards) |
| Polygon |
7.90K |
23.00 |
343.60 |
Collateral Asset Supply
This graph shows the total supply of all collateral assets over the past week.
To see updated statistics, please see the live version of this graph here.
Base Asset Borrows
This graph shows the total borrows of the base asset over the past week.
To see updated statistics, please see the live version of this graph here.
Utilization
This graph shows the utilization (borrow / supply) of the base asset over the past week.
Supply Cap Usage
This graph shows the supply cap usage (supply / supply cap) of all collateral assets over the past week.
[Gauntlet] Polygon USDC.e Comet Update: (2024-06-03 through 2024-06-09)
Gauntlet would like to provide the community with an update on the Polygon USDC.e comet over the past week.
Simple Summary
-
USDC.e Borrows increased 2.55%, from $14.04M to $14.39M.
-
USDC.e Supply increased 1.93%, from $15.68M to $15.98M.
-
USDC.e utilization did not change, remaining at 89.52%.
-
The minimum USDC.e reserve growth was 14.44%, and the maximum was 16.62%. The average USDC.e reserve growth was 15.66%.
-
The comet accumulated $4.46K USDC.e reserves while distributing 9.25K COMP rewards for a weekly Net Protocol Profit of -4.80K.
Base Asset APR Trend
Reserve Analysis
COMP Rewards Analysis
| Chain |
CometRewards COMP token holdings |
Daily aggregate COMP token reward distributions |
Remaining days of rewards runway (not including existing claimable rewards) |
| Polygon |
7.83K |
23.00 |
340.60 |
Collateral Asset Supply
This graph shows the total supply of all collateral assets over the past week.
To see updated statistics, please see the live version of this graph here.
Base Asset Borrows
This graph shows the total borrows of the base asset over the past week.
To see updated statistics, please see the live version of this graph here.
Utilization
This graph shows the utilization (borrow / supply) of the base asset over the past week.
Supply Cap Usage
This graph shows the supply cap usage (supply / supply cap) of all collateral assets over the past week.
[Gauntlet] Polygon USDC.e Comet Update: (2024-06-10 through 2024-06-16)
Gauntlet would like to provide the community with an update on the Polygon USDC.e comet over the past week.
Simple Summary
-
USDC.e Borrows decreased 22.57%, from $14.39M to $11.15M.
-
USDC.e Supply decreased 1.45%, from $15.98M to $15.75M.
-
USDC.e utilization decreased 21.43%, from 90.07% to 70.77%.
-
The minimum USDC.e reserve growth was -2.09%, and the maximum was 16.64%. The average USDC.e reserve growth was 8.02%.
-
The comet accumulated $1.95K USDC.e reserves while distributing 8.53K COMP rewards for a weekly Net Protocol Profit of -6.58K.
Base Asset APR Trend
Reserve Analysis
COMP Rewards Analysis
| Chain |
CometRewards COMP token holdings |
Daily aggregate COMP token reward distributions |
Remaining days of rewards runway (not including existing claimable rewards) |
| Polygon |
7.20K |
23.00 |
312.90 |
Collateral Asset Supply
This graph shows the total supply of all collateral assets over the past week.
To see updated statistics, please see the live version of this graph here.
Base Asset Borrows
This graph shows the total borrows of the base asset over the past week.
To see updated statistics, please see the live version of this graph here.
Utilization
This graph shows the utilization (borrow / supply) of the base asset over the past week.
Supply Cap Usage
This graph shows the supply cap usage (supply / supply cap) of all collateral assets over the past week.
[Gauntlet] Polygon USDC.e Comet Update: (2024-06-17 through 2024-06-23)
Gauntlet would like to provide the community with an update on the Polygon USDC.e comet over the past week.
Simple Summary
-
USDC.e Borrows decreased 3.19%, from $11.15M to $10.79M.
-
USDC.e Supply decreased 1.62%, from $15.75M to $15.50M.
-
USDC.e utilization decreased 1.59%, from 70.77% to 69.64%.
-
The minimum USDC.e reserve growth was -4.11%, and the maximum was -1.34%. The average USDC.e reserve growth was -3.00%.
-
The comet accumulated $-450.93 USDC.e reserves while distributing 7.89K COMP rewards for a weekly Net Protocol Profit of -8.34K.
Base Asset APR Trend
Reserve Analysis
COMP Rewards Analysis
| Chain |
CometRewards COMP token holdings |
Daily aggregate COMP token reward distributions |
Remaining days of rewards runway (not including existing claimable rewards) |
| Polygon |
7.06K |
23.00 |
306.90 |
Collateral Asset Supply
This graph shows the total supply of all collateral assets over the past week.
To see updated statistics, please see the live version of this graph here.
Base Asset Borrows
This graph shows the total borrows of the base asset over the past week.
To see updated statistics, please see the live version of this graph here.
Utilization
This graph shows the utilization (borrow / supply) of the base asset over the past week.
Supply Cap Usage
This graph shows the supply cap usage (supply / supply cap) of all collateral assets over the past week.
[Gauntlet] Polygon USDC.e Comet Update: (2024-06-24 through 2024-06-30)
Gauntlet would like to provide the community with an update on the Polygon USDC.e comet over the past week.
Simple Summary
-
USDC.e Borrows increased 2.17%, from $10.79M to $11.03M.
-
USDC.e Supply decreased 5.23%, from $15.49M to $14.68M.
-
USDC.e utilization increased 7.81%, from 69.65% to 75.09%.
-
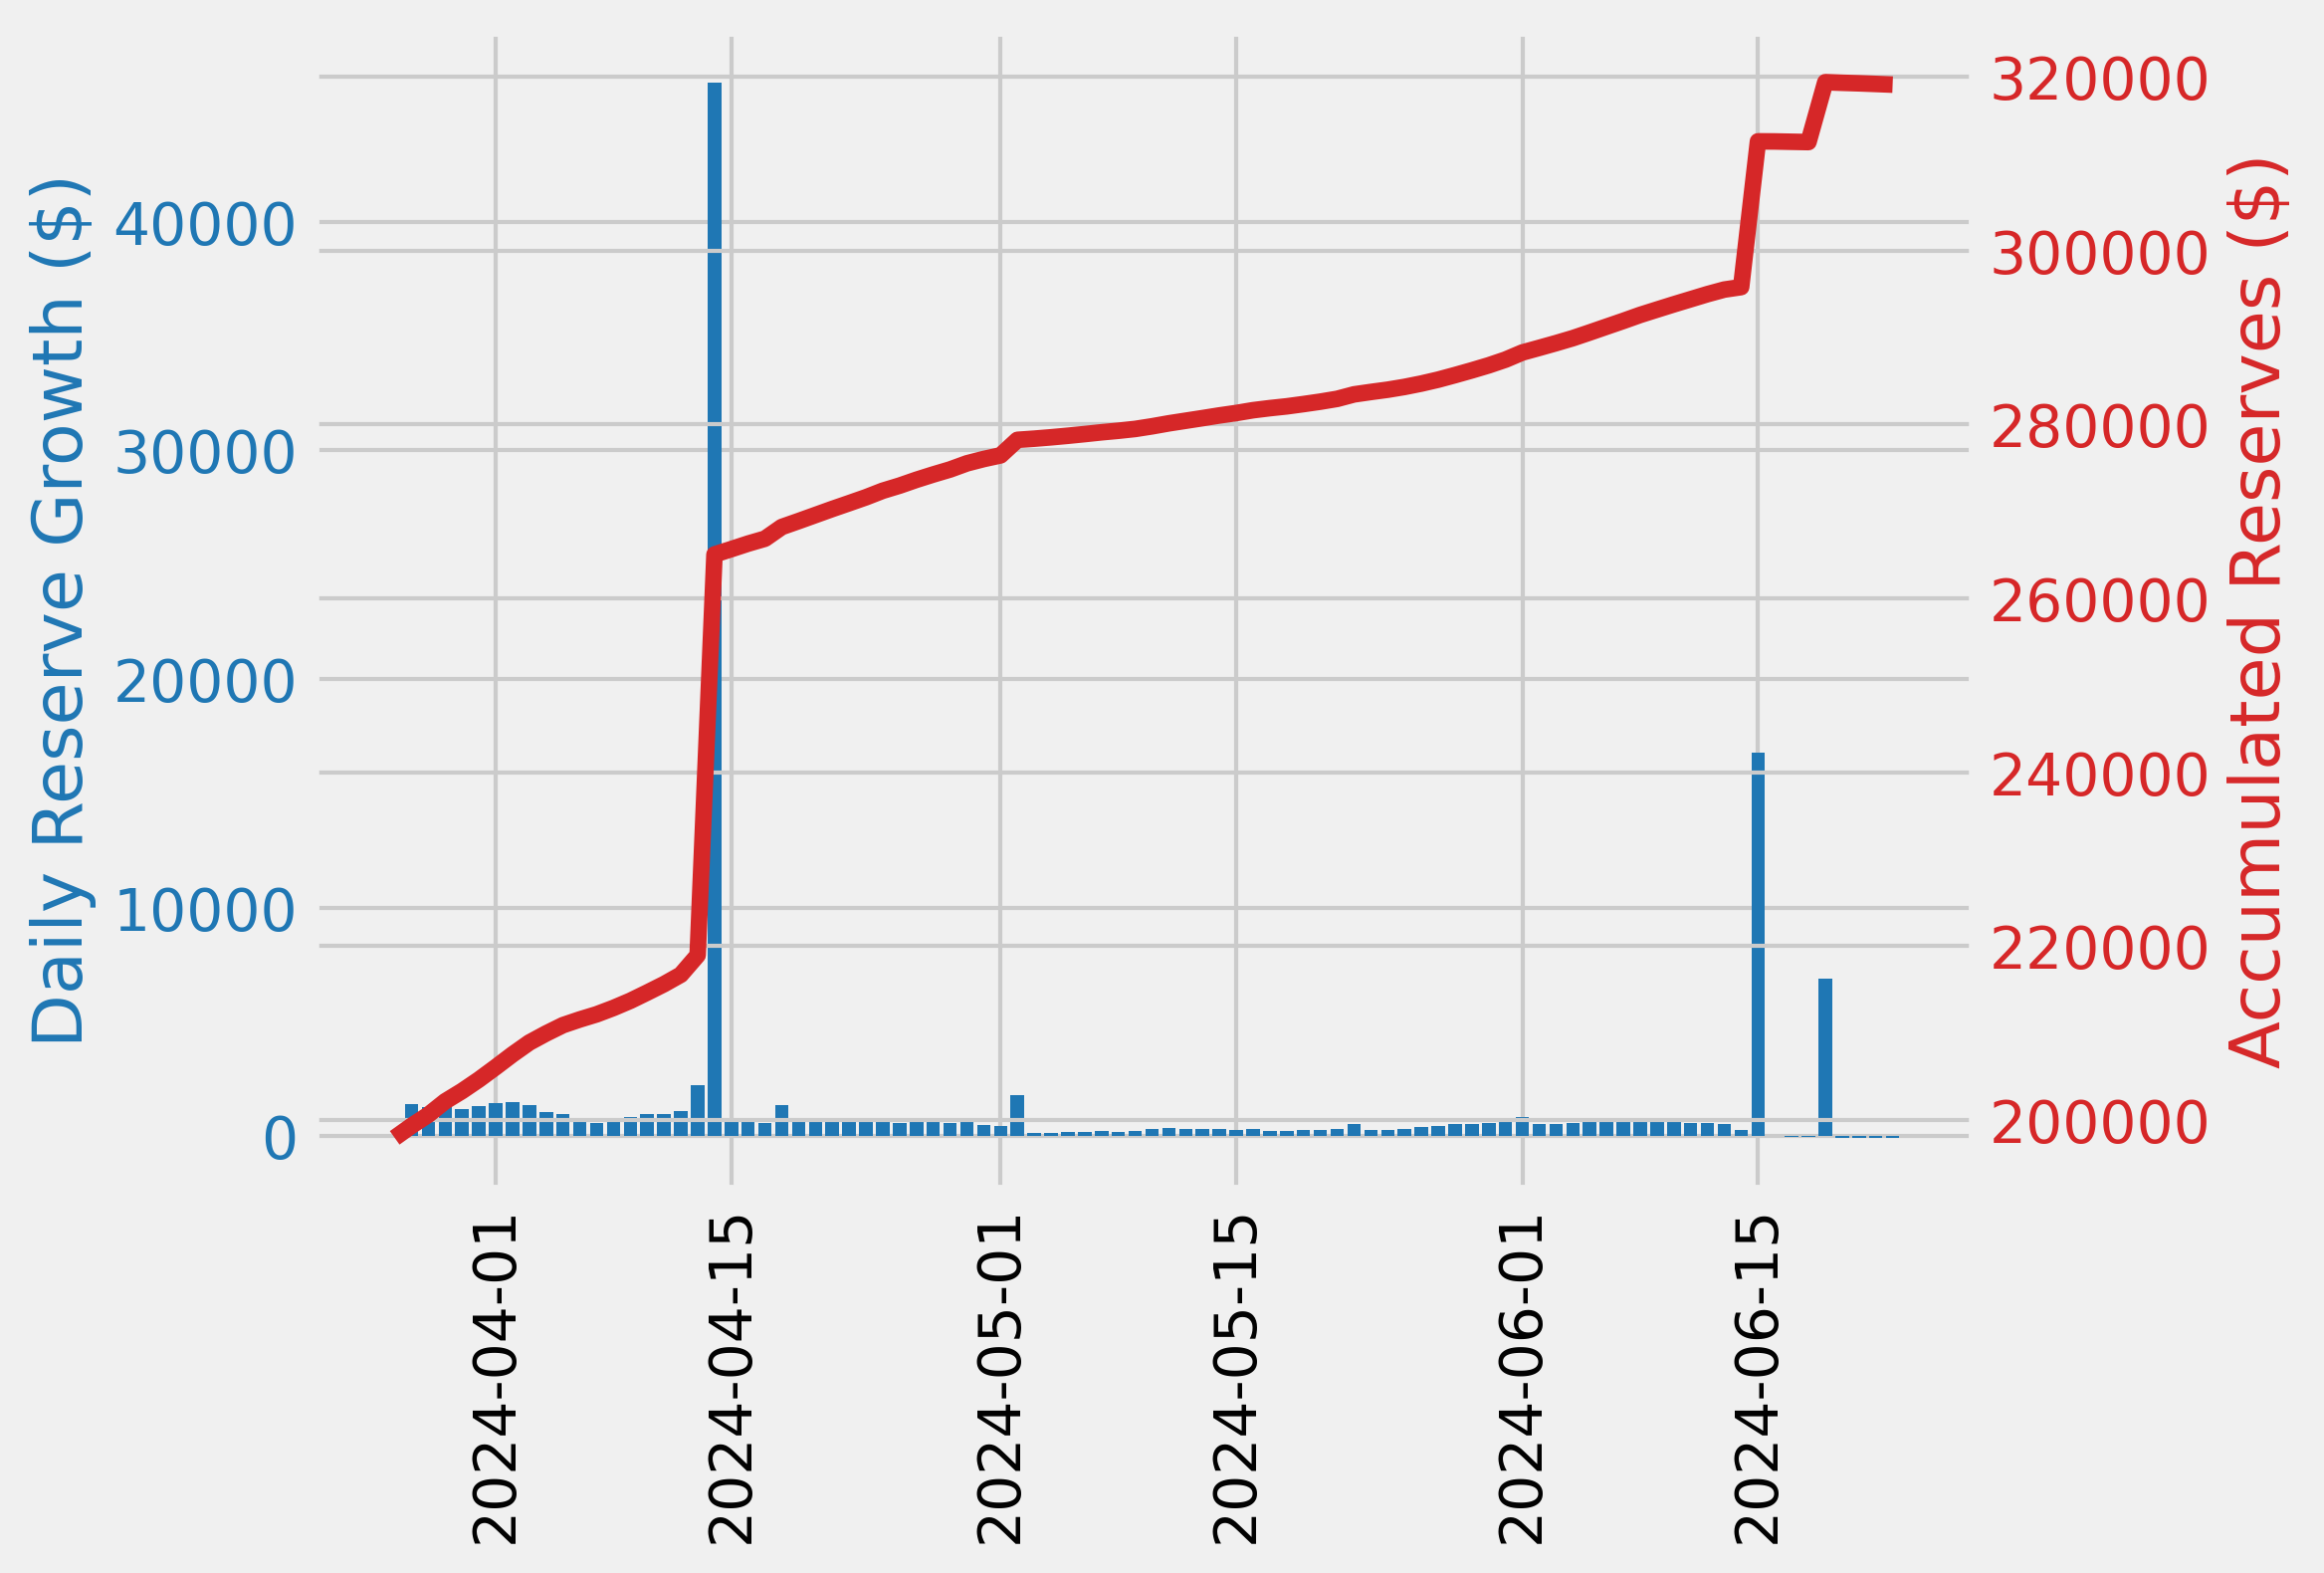
The minimum USDC.e reserve growth was -2.72%, and the maximum was 3.38%. The average USDC.e reserve growth was -0.82%.
-
The comet accumulated $-120.89 USDC.e reserves while distributing 7.90K COMP rewards for a weekly Net Protocol Profit of -8.02K.
Base Asset APR Trend
Reserve Analysis
COMP Rewards Analysis
| Chain |
CometRewards COMP token holdings |
Daily aggregate COMP token reward distributions |
Remaining days of rewards runway (not including existing claimable rewards) |
| Polygon |
6.92K |
23.00 |
300.70 |
Collateral Asset Supply
This graph shows the total supply of all collateral assets over the past week.
To see updated statistics, please see the live version of this graph here.
Base Asset Borrows
This graph shows the total borrows of the base asset over the past week.
To see updated statistics, please see the live version of this graph here.
Utilization
This graph shows the utilization (borrow / supply) of the base asset over the past week.
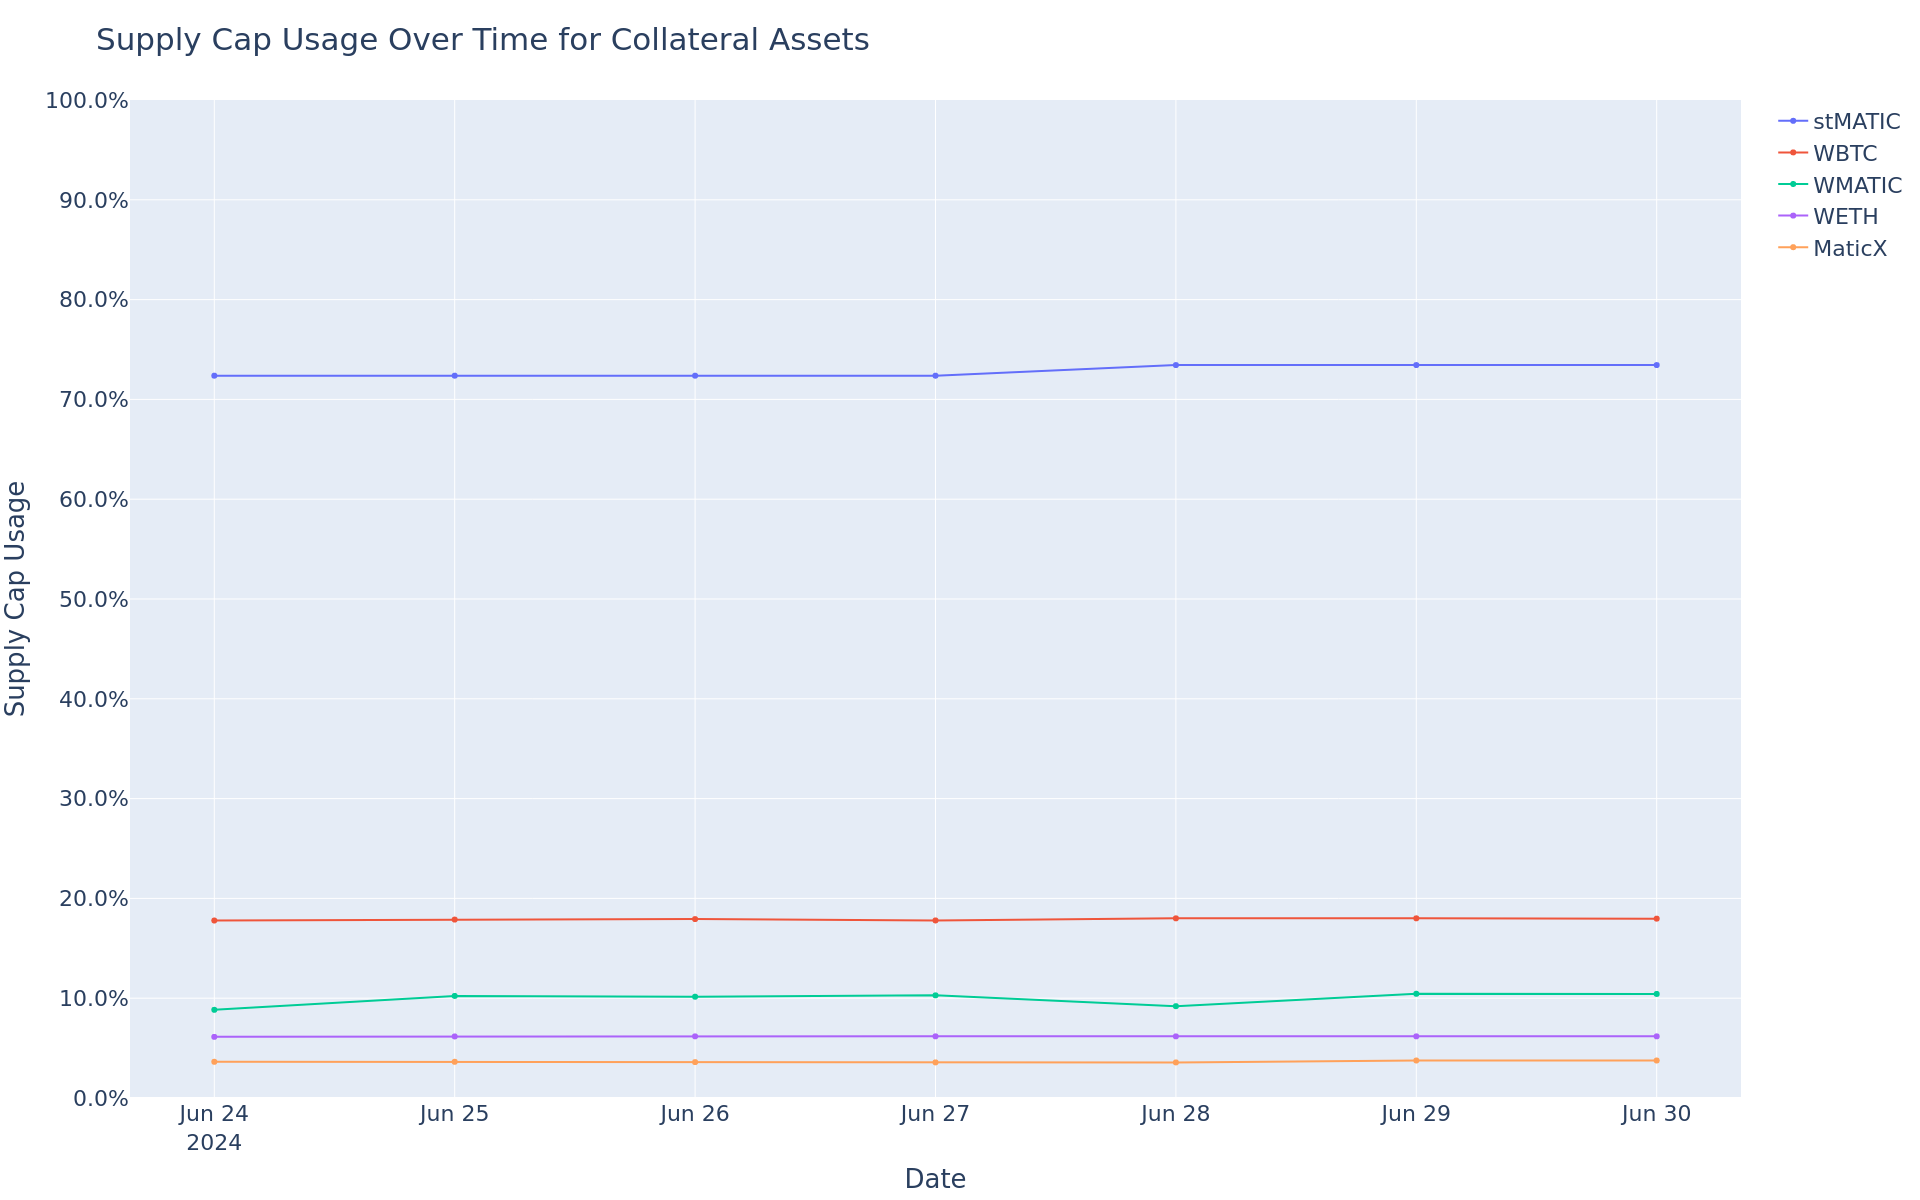
Supply Cap Usage
This graph shows the supply cap usage (supply / supply cap) of all collateral assets over the past week.
[Gauntlet] Polygon USDC.e Comet Update: (2024-06-30 through 2024-07-06)
Gauntlet would like to provide the community with an update on the Polygon USDC.e comet over the past week.
Simple Summary
-
USDC.e Borrows decreased 8.33%, from $11.06M to $10.14M.
-
USDC.e Supply has not changed, remaining at $14.83M.
-
USDC.e utilization decreased 8.82%, from 74.54% to 67.96%.
-
The minimum USDC.e reserve growth was -5.27%, and the maximum was 3.38%. The average USDC.e reserve growth was 0.63%.
-
The comet accumulated $131.26 USDC.e reserves while distributing 7.69K COMP rewards for a weekly Net Protocol Profit of -7.56K.
Base Asset APR Trend
Reserve Analysis
COMP Rewards Analysis
| Chain |
CometRewards COMP token holdings |
Daily aggregate COMP token reward distributions |
Remaining days of rewards runway (not including existing claimable rewards) |
| Polygon |
6.38K |
23.00 |
277.50 |
Collateral Asset Supply
This graph shows the total supply of all collateral assets over the past week.
To see updated statistics, please see the live version of this graph here.
Base Asset Borrows
This graph shows the total borrows of the base asset over the past week.
To see updated statistics, please see the live version of this graph here.
Utilization
This graph shows the utilization (borrow / supply) of the base asset over the past week.
Supply Cap Usage
This graph shows the supply cap usage (supply / supply cap) of all collateral assets over the past week.