[Gauntlet] Arbitrum v3 USDC.e Update: (12/1/23 - 12/7/23)
Gauntlet would like to provide the community with an update on the Arbitrum v3 USDC.e comet over the past week.
Simple Summary
- USDC.e Borrows increased 3.52%, from $2.34M to $2.42M.
- USDC.e Supply decreased 1.24%, from $2.6M to $2.57M.
- USDC.e utilization increased 4.83%, from 90.07% to 94.41%.
- The minimum USDC.e reserve growth was -14.03%, and the maximum was 0.78%. The average USDC.e reserve growth was -10.16%.
- The comet accumulated $-0.27K USDC.e reserves while distributing $0.0K COMP rewards for a weekly Net Protocol Profit of $-0.27K.
Asset Supply
This graph shows the time series of total supply of all assets.
To see updated statistics, please see the live version of this graph here.
USDC.e Borrows
This graph shows the time series of USDC.e borrows.
To see updated statistics, please see the live version of this graph here.
Utilization
This graph shows the utilization (borrow / supply) of USDC.e over the past week.
Supply Cap Usage
This graph shows the supply cap usage (supply / supply cap) of all collateral assets over the past week.
2 Likes
[Gauntlet] Arbitrum v3 USDC.e Comet Update: (12/08/23 - 12/14/23)
Gauntlet would like to provide the community with an update on the Arbitrum v3 USDC.e comet over the past week.
Simple Summary
- USDC.e Borrows increased 11.11%, from $2.44M to $2.71M.
- USDC.e Supply increased 2.77%, from $2.61M to $2.69M.
- USDC.e utilization increased 8.11%, from 93.2% to 100.76%.
- The minimum USDC.e reserve growth was -14.04%, and the maximum was -8.96%. The average USDC.e reserve growth was -13.15%.
- The comet accumulated $-0.5K USDC.e reserves while distributing $0.0K COMP rewards for a weekly Net Protocol Profit of $-0.5K.
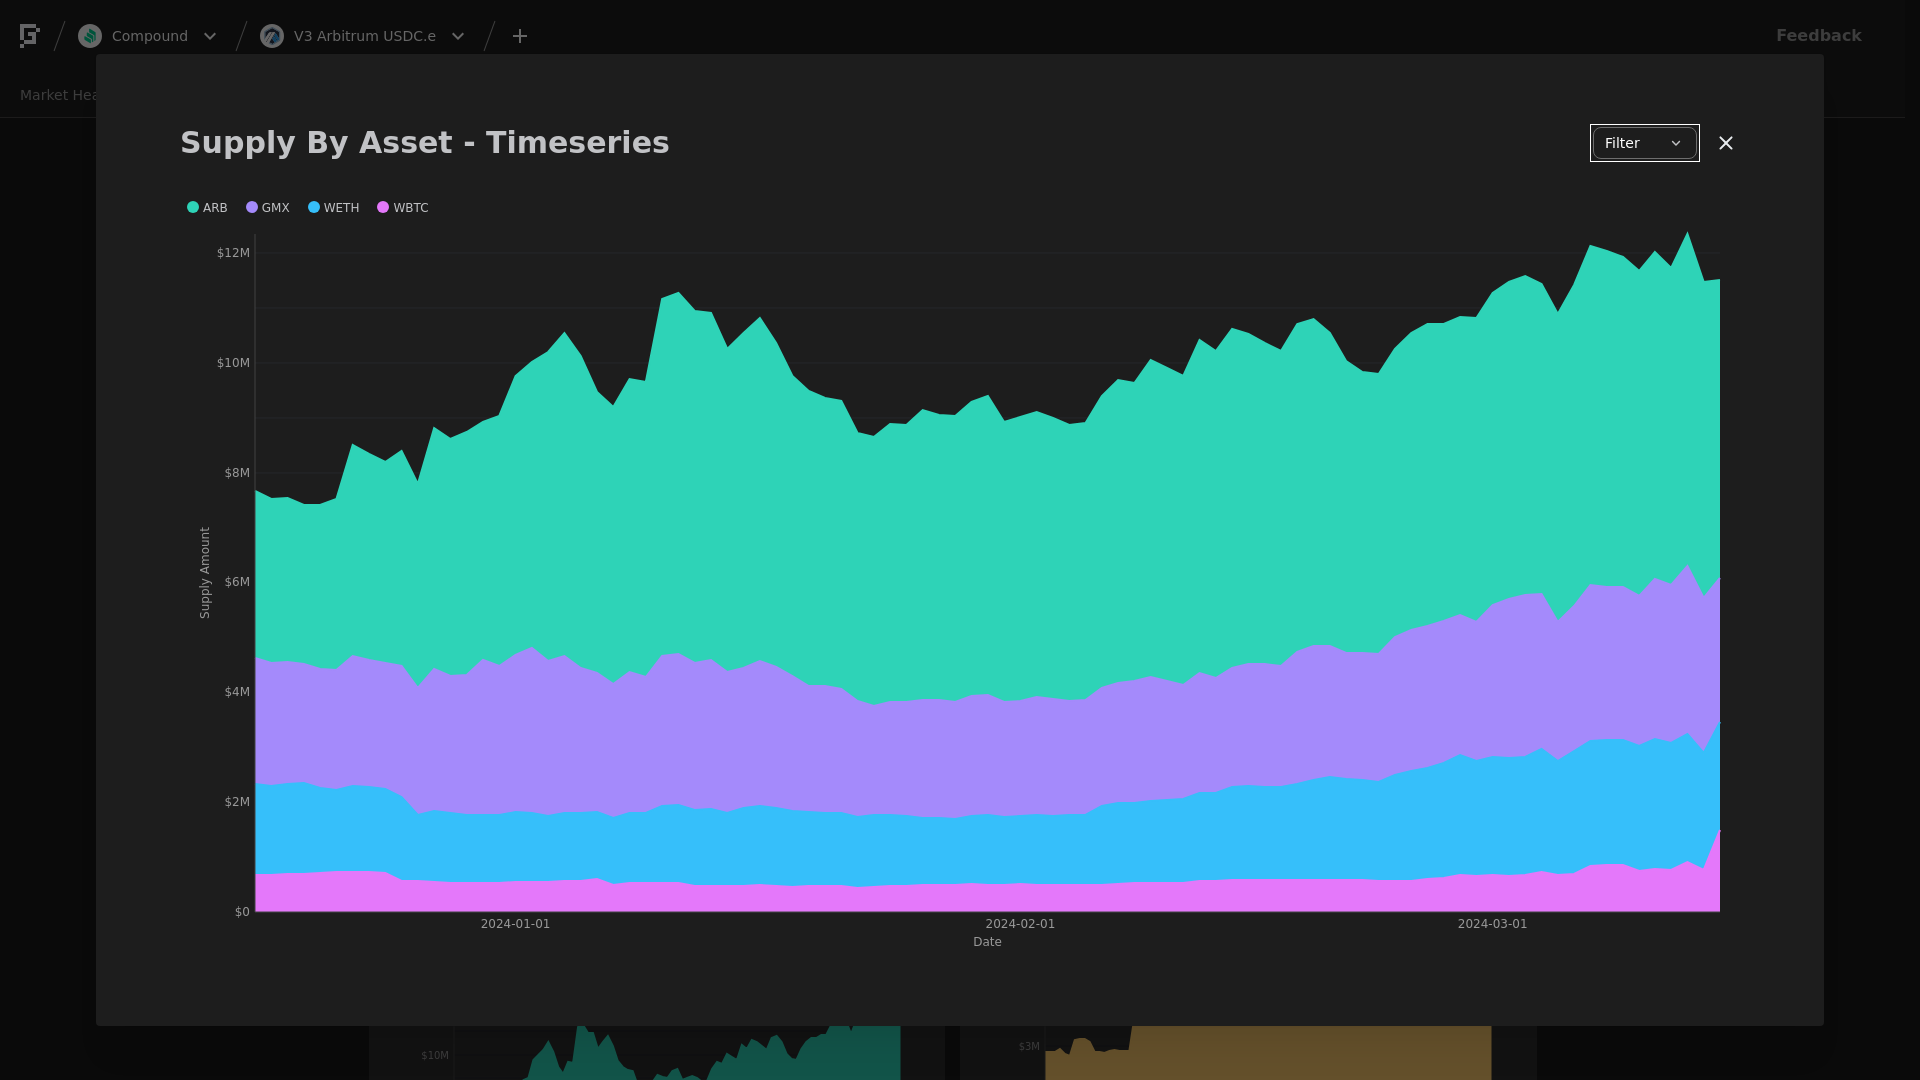
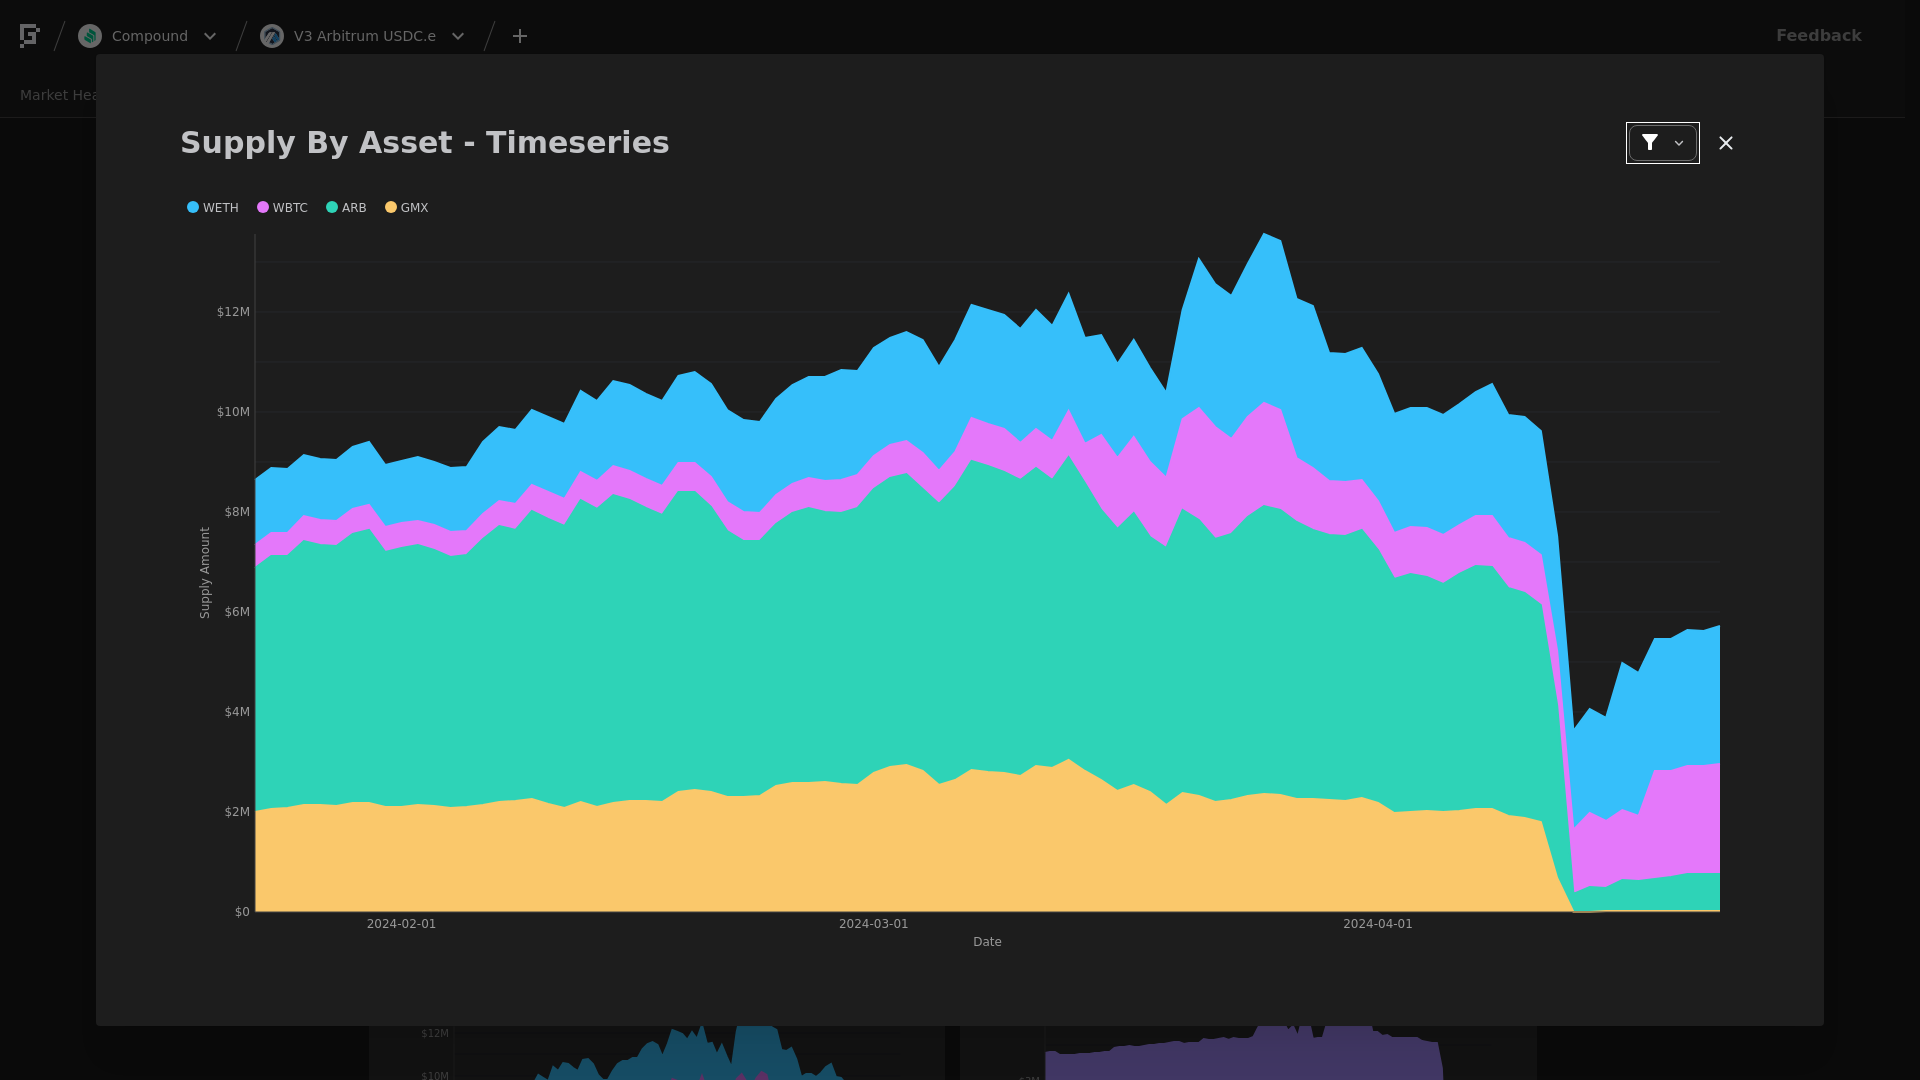
Collateral Asset Supply
This graph shows the total supply of all collateral assets over the past week.
To see updated statistics, please see the live version of this graph here.
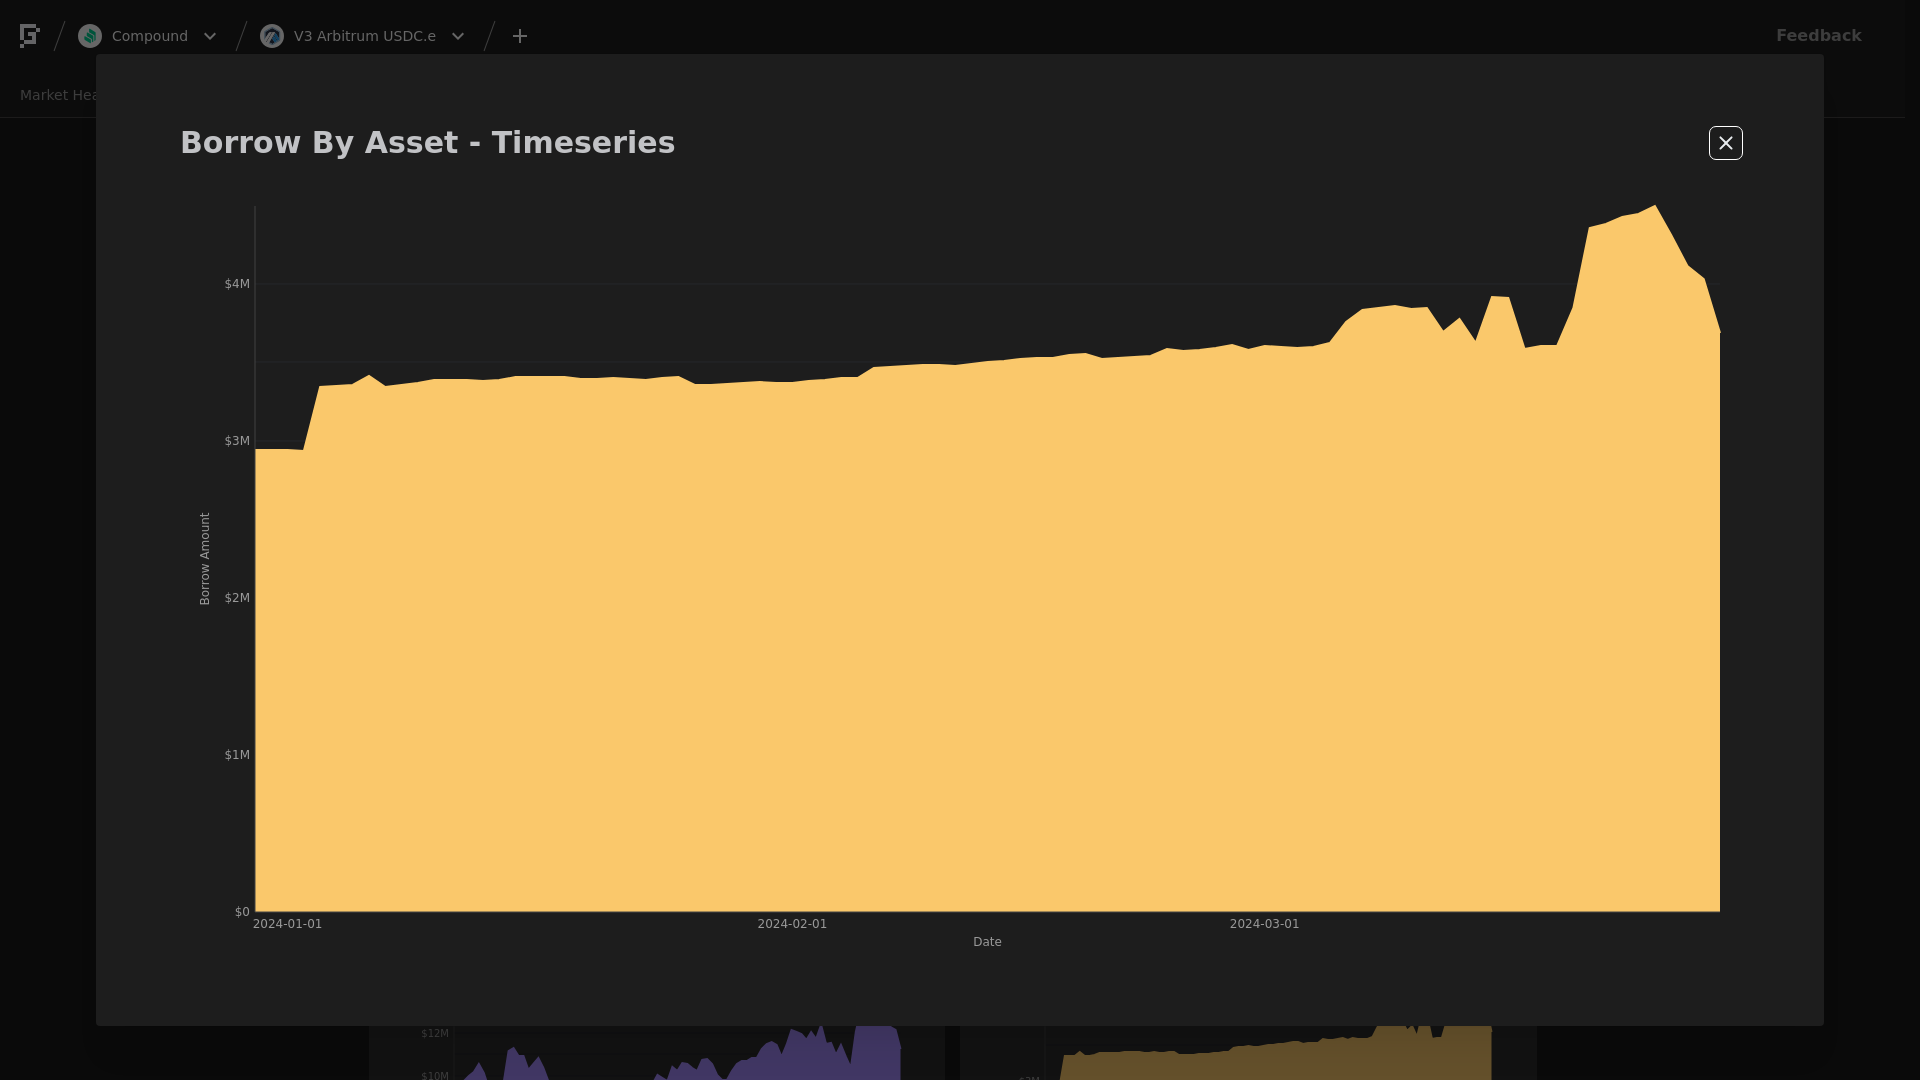
Base Asset Borrows
This graph shows the total borrows of the base asset over the past week.
To see updated statistics, please see the live version of this graph here.
Utilization
This graph shows the utilization (borrow / supply) of the base asset over the past week.
Supply Cap Usage
This graph shows the supply cap usage (supply / supply cap) of all collateral assets over the past week.
2 Likes
[Gauntlet] Arbitrum v3 USDC Update (12/21/2023 - 12/27/2023)
Gauntlet would like to provide the community with an update on metrics from the Arbitrum v3 USDC comet over the past week.
Simple Summary
- USDC.e Borrows increased 0.66%, from $2.9M to $2.92M.
- USDC.e Supply increased 9.08%, from $3.02M to $3.29M.
- USDC.e utilization decreased 7.71%, from 96.1% to 88.69%.
- The minimum USDC.e reserve growth was -14.02%, and the maximum was 15.96%. The average USDC.e reserve growth was 0.85%.
- The comet accumulated $0.39K USDC.e reserves while distributing $0.0K COMP rewards for a weekly Net Protocol Profit of $0.39K.
Collateral Asset Supply
This graph shows the total supply of all collateral assets over the past week.
To see updated statistics, please see the live version of this graph here.
Base Asset Borrows
This graph shows the total borrows of the base asset over the past week.
To see updated statistics, please see the live version of this graph here.
Utilization
This graph shows the utilization (borrow / supply) of the base asset over the past week.
Supply Cap Usage
This graph shows the supply cap usage (supply / supply cap) of all collateral assets over the past week.
1 Like
[Gauntlet] Weekly Market Update: Arbitrum USDC (2023-12-28 through 2024-01-03)
Gauntlet would like to provide the community with an update on metrics from the Arbitrum USDC comet over the past week and will include any relevant recommendations.
Simple Summary
- USDC.e Borrows increased 14.61%, from $2.92M to $3.34M.
- USDC.e Supply increased 10.77%, from $3.27M to $3.62M.
- USDC.e utilization increased 3.47%, from 89.3% to 92.4%.
- The minimum USDC.e reserve growth was 10.54%, and the maximum was 19.75%. The average USDC.e reserve growth was 11.54%.
- The comet accumulated $0.83K USDC.e reserves while distributing $0.0K COMP rewards for a weekly Net Protocol Profit of $0.83K.
Collateral Asset Supply
This graph shows the total supply of all collateral assets over the past week.
To see updated statistics, please see the live version of this graph here.
Base Asset Borrows
This graph shows the total borrows of the base asset over the past week.
To see updated statistics, please see the live version of this graph here.
Utilization
This graph shows the utilization (borrow / supply) of the base asset over the past week.
Supply Cap Usage
This graph shows the supply cap usage (supply / supply cap) of all collateral assets over the past week.
1 Like
[Gauntlet] Weekly Market Update: Arbitrum USDC (2024-01-04 through 2024-01-10)
Gauntlet would like to provide the community with an update on metrics from the Arbitrum USDC comet over the past week and will include any relevant recommendations.
Simple Summary
- USDC.e Borrows increased 1.23%, from $3.35M to $3.39M.
- USDC.e Supply increased 2.7%, from $3.64M to $3.73M.
- USDC.e utilization decreased 1.43%, from 92.0% to 90.68%.
- The minimum USDC.e reserve growth was 10.52%, and the maximum was 19.23%. The average USDC.e reserve growth was 13.18%.
- The comet accumulated $0.95K USDC.e reserves while distributing $0.0K COMP rewards for a weekly Net Protocol Profit of $0.95K.
Collateral Asset Supply
This graph shows the total supply of all collateral assets over the past week.
To see updated statistics, please see the live version of this graph here.
Base Asset Borrows
This graph shows the total borrows of the base asset over the past week.
To see updated statistics, please see the live version of this graph here.
Utilization
This graph shows the utilization (borrow / supply) of the base asset over the past week.
Supply Cap Usage
This graph shows the supply cap usage (supply / supply cap) of all collateral assets over the past week.
1 Like
[Gauntlet] Arbitrum v3 USDC.e Update: (2024-01-11 through 2024-01-17)
Gauntlet would like to provide the community with an update on the USDC.e comet over the past week.
Simple Summary
- USDC.e Borrows increased 0.67%, from $3.39M to $3.41M.
- USDC.e Supply increased 2.46%, from $3.74M to $3.83M.
- USDC.e utilization decreased 1.75%, from 90.5% to 88.92%.
- The minimum USDC.e reserve growth was 10.52%, and the maximum was 18.66%. The average USDC.e reserve growth was 11.38%.
- The comet accumulated $1.0K USDC.e reserves while distributing $0.0K COMP rewards for a weekly Net Protocol Profit of $1.0K.
Collateral Asset Supply
This graph shows the total supply of all collateral assets over the past week.
To see updated statistics, please see the live version of this graph here.
Base Asset Borrows
This graph shows the total borrows of the base asset over the past week.
To see updated statistics, please see the live version of this graph here.
Utilization
This graph shows the utilization (borrow / supply) of the base asset over the past week.
Supply Cap Usage
This graph shows the supply cap usage (supply / supply cap) of all collateral assets over the past week.
2 Likes
[Gauntlet] Weekly Market Update: Arbitrum USDC (2024-01-19 through 2024-01-25)
Gauntlet would like to provide the community with an update on metrics from the Arbitrum USDC comet over the past week and will include any relevant recommendations. Gauntlet is continuing to monitor all the Compound markets. Gauntlet is aware of the asset supply caps that are close to full utilziation. Gauntlet will continue to monitor these assets and provide recommendations based on our methodology.
Simple Summary
- USDC.e Borrows decreased 0.11%, from $3.41M to $3.4M.
- USDC.e Supply increased 3.43%, from $3.8M to $3.93M.
- USDC.e utilization decreased 3.42%, from 89.68% to 86.61%.
- The minimum USDC.e reserve growth was 10.52%, and the maximum was 19.75%. The average USDC.e reserve growth was 12.89%.
- The comet accumulated $0.85K USDC.e reserves while distributing $0.0K COMP rewards for a weekly Net Protocol Profit of $0.85K.
Collateral Asset Supply
This graph shows the total supply of all collateral assets over the past week.
To see updated statistics, please see the live version of this graph here.
Base Asset Borrows
This graph shows the total borrows of the base asset over the past week.
To see updated statistics, please see the live version of this graph here.
Utilization
This graph shows the utilization (borrow / supply) of the base asset over the past week.
Supply Cap Usage
This graph shows the supply cap usage (supply / supply cap) of all collateral assets over the past week.
1 Like
[Gauntlet] Weekly Market Update: Arbitrum USDC (2024-01-26 through 2024-02-01)
Gauntlet would like to provide the community with an update on metrics from the Arbitrum USDC comet over the past week and will include any relevant recommendations.
Simple Summary
- USDC.e Borrows decreased 0.96%, from $3.4M to $3.37M.
- USDC.e Supply decreased 2.28%, from $3.93M to $3.84M.
- USDC.e utilization increased 1.35%, from 86.62% to 87.79%.
- The minimum USDC.e reserve growth was 10.84%, and the maximum was 15.82%. The average USDC.e reserve growth was 13.6%.
- The comet accumulated $0.8K USDC.e reserves while distributing $0.0K COMP rewards for a weekly Net Protocol Profit of $0.8K.
Collateral Asset Supply
This graph shows the total supply of all collateral assets over the past week.
To see updated statistics, please see the live version of this graph here.
Base Asset Borrows
This graph shows the total borrows of the base asset over the past week.
To see updated statistics, please see the live version of this graph here.
Utilization
This graph shows the utilization (borrow / supply) of the base asset over the past week.
Supply Cap Usage
This graph shows the supply cap usage (supply / supply cap) of all collateral assets over the past week.
2 Likes
[Gauntlet] USDC.e Comet Update: (2024-02-02 through 2024-02-08)
Gauntlet would like to provide the community with an update on metrics from the Arbitrum USDC comet over the past week and will include any relevant recommendations. Gauntlet is continuing to monitor all the Compound markets. Gauntlet is aware of the asset supply caps that are close to full utilization. However, considering the need of USDC.e deprecation, Gauntlet will not provide supply cap increase recommendations.
Simple Summary
- USDC.e Borrows increased 3.19%, from $3.37M to $3.48M.
- USDC.e Supply decreased 0.2%, from $3.84M to $3.83M.
- USDC.e utilization increased 3.39%, from 87.79% to 90.77%.
- The minimum USDC.e reserve growth was 10.53%, and the maximum was 13.47%. The average USDC.e reserve growth was 11.7%.
- The comet accumulated $0.89K USDC.e reserves while distributing $0.0K COMP rewards for a weekly Net Protocol Profit of $0.89K.
Utilization
This graph shows the utilization (borrow / supply) of the base asset over the past week.
Supply Cap Usage
This graph shows the supply cap usage (supply / supply cap) of all collateral assets over the past week.
1 Like
[Gauntlet] Weekly Market Update: Arbitrum USDC (2024-02-09 through 2024-02-15)
Gauntlet would like to provide the community with an update on the USDC.e comet over the past week.
Simple Summary
- USDC.e Borrows increased 1.15%, from $3.48M to $3.52M.
- USDC.e Supply increased 3.47%, from $3.83M to $3.97M.
- USDC.e utilization decreased 2.24%, from 90.77% to 88.73%.
- The minimum USDC.e reserve growth was 10.52%, and the maximum was 13.45%. The average USDC.e reserve growth was 11.19%.
- The comet accumulated $0.96K USDC.e reserves while distributing $0.0K COMP rewards for a weekly Net Protocol Profit of $0.96K.
Collateral Asset Supply
This graph shows the total supply of all collateral assets over the past week.
To see updated statistics, please see the live version of this graph here.
Base Asset Borrows
This graph shows the total borrows of the base asset over the past week.
To see updated statistics, please see the live version of this graph here.
Utilization
This graph shows the utilization (borrow / supply) of the base asset over the past week.
Supply Cap Usage
This graph shows the supply cap usage (supply / supply cap) of all collateral assets over the past week.
1 Like
[Gauntlet] USDC.e Comet Update: (2024-02-16 through 2024-02-22)
Gauntlet would like to provide the community with an update on the USDC.e comet over the past week.
This week, Gauntlet recommends the following risk parameter updates for the Arbitrum v3 USDC.e comet, see here:
- Increase ARB Liquidation Penalty from 7% to 10%
- Decrease Comet Market Store Price Factor from 80% to 60%
Simple Summary
- USDC.e Borrows increased 0.36%, from $3.52M to $3.53M.
- USDC.e Supply increased 0.36%, from $3.97M to $3.98M.
- USDC.e utilization decreased 0.0%, from 88.73% to 88.73%.
- The minimum USDC.e reserve growth was 10.52%, and the maximum was 13.06%. The average USDC.e reserve growth was 11.38%.
- The comet accumulated $0.94K USDC.e reserves while distributing $0.0K COMP rewards for a weekly Net Protocol Profit of $0.94K.
Collateral Asset Supply
This graph shows the total supply of all collateral assets over the past week.
To see updated statistics, please see the live version of this graph here.
Base Asset Borrows
This graph shows the total borrows of the base asset over the past week.
To see updated statistics, please see the live version of this graph here.
Utilization
This graph shows the utilization (borrow / supply) of the base asset over the past week.
Supply Cap Usage
This graph shows the supply cap usage (supply / supply cap) of all collateral assets over the past week.
1 Like
[Gauntlet] USDC.e Comet Update: (2024-02-23 through 2024-02-29)
Gauntlet would like to provide the community with an update on the USDC.e comet over the past week.
Simple Summary
- USDC.e Borrows increased 1.29%, from $3.53M to $3.58M.
- USDC.e Supply decreased 2.99%, from $3.98M to $3.86M.
- USDC.e utilization increased 4.41%, from 88.73% to 92.65%.
- The minimum USDC.e reserve growth was 10.52%, and the maximum was 10.97%. The average USDC.e reserve growth was 10.61%.
- The comet accumulated $1.12K USDC.e reserves while distributing $0.0K COMP rewards for a weekly Net Protocol Profit of $1.12K.
Collateral Asset Supply
This graph shows the total supply of all collateral assets over the past week.
To see updated statistics, please see the live version of this graph here.
Base Asset Borrows
This graph shows the total borrows of the base asset over the past week.
To see updated statistics, please see the live version of this graph here.
Utilization
This graph shows the utilization (borrow / supply) of the base asset over the past week.
Supply Cap Usage
This graph shows the supply cap usage (supply / supply cap) of all collateral assets over the past week.
1 Like
[Gauntlet] USDC.e Comet Update: (2024-03-01 through 2024-03-07)
Gauntlet would like to provide the community with an update on the USDC.e comet over the past week.
Simple Summary
- USDC.e Borrows increased 7.17%, from $3.58M to $3.83M.
- USDC.e Supply increased 7.91%, from $3.86M to $4.17M.
- USDC.e utilization decreased 0.68%, from 92.64% to 92.01%.
- The minimum USDC.e reserve growth was 10.52%, and the maximum was 11.8%. The average USDC.e reserve growth was 10.9%.
- The comet accumulated $1.46K USDC.e reserves while distributing $0.0K COMP rewards for a weekly Net Protocol Profit of $1.46K.
Collateral Asset Supply
This graph shows the total supply of all collateral assets over the past week.
To see updated statistics, please see the live version of this graph here.
Base Asset Borrows
This graph shows the total borrows of the base asset over the past week.
To see updated statistics, please see the live version of this graph here.
Utilization
This graph shows the utilization (borrow / supply) of the base asset over the past week.
Supply Cap Usage
This graph shows the supply cap usage (supply / supply cap) of all collateral assets over the past week.
1 Like
[Gauntlet] Arbitrum USDC.e Comet Update: (2024-03-08 through 2024-03-14)
Gauntlet would like to provide the community with an update on the Arbitrum USDC.e comet over the past week.
From this week, Gauntlet starts providing COMP rewards analysis in our weekly communication. Gauntlet will continue improving the weekly to better inform the community of the latest information.
Simple Summary
- USDC.e Borrows decreased 5.53%, from $3.83M to $3.62M.
- USDC.e Supply decreased 4.65%, from $4.17M to $3.97M.
- USDC.e utilization did not change, remaining at 92.01%.
- The minimum USDC.e reserve growth was 10.52%, and the maximum was 13.13%. The average USDC.e reserve growth was 11.00%.
- The comet accumulated $1.55K USDC.e reserves while distributing $0.00 COMP rewards for a weekly Net Protocol Profit of $1.55K.
COMP Rewards Analysis
| Chain |
CometRewards COMP token holdings |
Daily aggregate COMP token reward distributions |
Remaining days of rewards runway (not including existing claimable rewards) |
| Arbitrum |
3.63K |
40.00 |
90.70 |
Collateral Asset Supply
This graph shows the total supply of all collateral assets over the past week.
To see updated statistics, please see the live version of this graph here.
Base Asset Borrows
This graph shows the total borrows of the base asset over the past week.
To see updated statistics, please see the live version of this graph here.
Utilization
This graph shows the utilization (borrow / supply) of the base asset over the past week.
Supply Cap Usage
This graph shows the supply cap usage (supply / supply cap) of all collateral assets over the past week.
1 Like
[Gauntlet] Arbitrum USDC.e Comet Update: (2024-03-15 through 2024-03-21)
Gauntlet would like to provide the community with an update on the Arbitrum USDC.e comet over the past week.
Simple Summary
- USDC.e Borrows increased 20.31%, from $3.62M to $4.36M.
- USDC.e Supply increased 22.55%, from $3.97M to $4.87M.
- USDC.e utilization decreased 1.83%, from 91.14% to 89.47%.
- The minimum USDC.e reserve growth was 10.53%, and the maximum was 19.72%. The average USDC.e reserve growth was 12.39%.
- The comet accumulated $1.27K USDC.e reserves while distributing $0.00 COMP rewards for a weekly Net Protocol Profit of $1.27K.
COMP Rewards Analysis
| Chain |
CometRewards COMP token holdings |
Daily aggregate COMP token reward distributions |
Remaining days of rewards runway (not including existing claimable rewards) |
| Arbitrum |
3.33K |
25.00 |
133.40 |
Collateral Asset Supply
This graph shows the total supply of all collateral assets over the past week.
To see updated statistics, please see the live version of this graph here.
Base Asset Borrows
This graph shows the total borrows of the base asset over the past week.
To see updated statistics, please see the live version of this graph here.
Utilization
This graph shows the utilization (borrow / supply) of the base asset over the past week.
Supply Cap Usage
This graph shows the supply cap usage (supply / supply cap) of all collateral assets over the past week.
1 Like
[Gauntlet] Arbitrum USDC.e Comet Update: (2024-03-22 through 2024-03-28)
Gauntlet would like to provide the community with an update on the Arbitrum USDC.e comet over the past week.
Simple Summary
- USDC.e Borrows decreased 7.50%, from $4.36M to $4.03M.
- USDC.e Supply decreased 7.83%, from $4.87M to $4.49M.
- USDC.e utilization did not change, remaining at 89.46%.
- The minimum USDC.e reserve growth was 10.52%, and the maximum was 14.67%. The average USDC.e reserve growth was 11.40%.
- The comet accumulated $1.58K USDC.e reserves while distributing $0.00 COMP rewards for a weekly Net Protocol Profit of $1.58K.
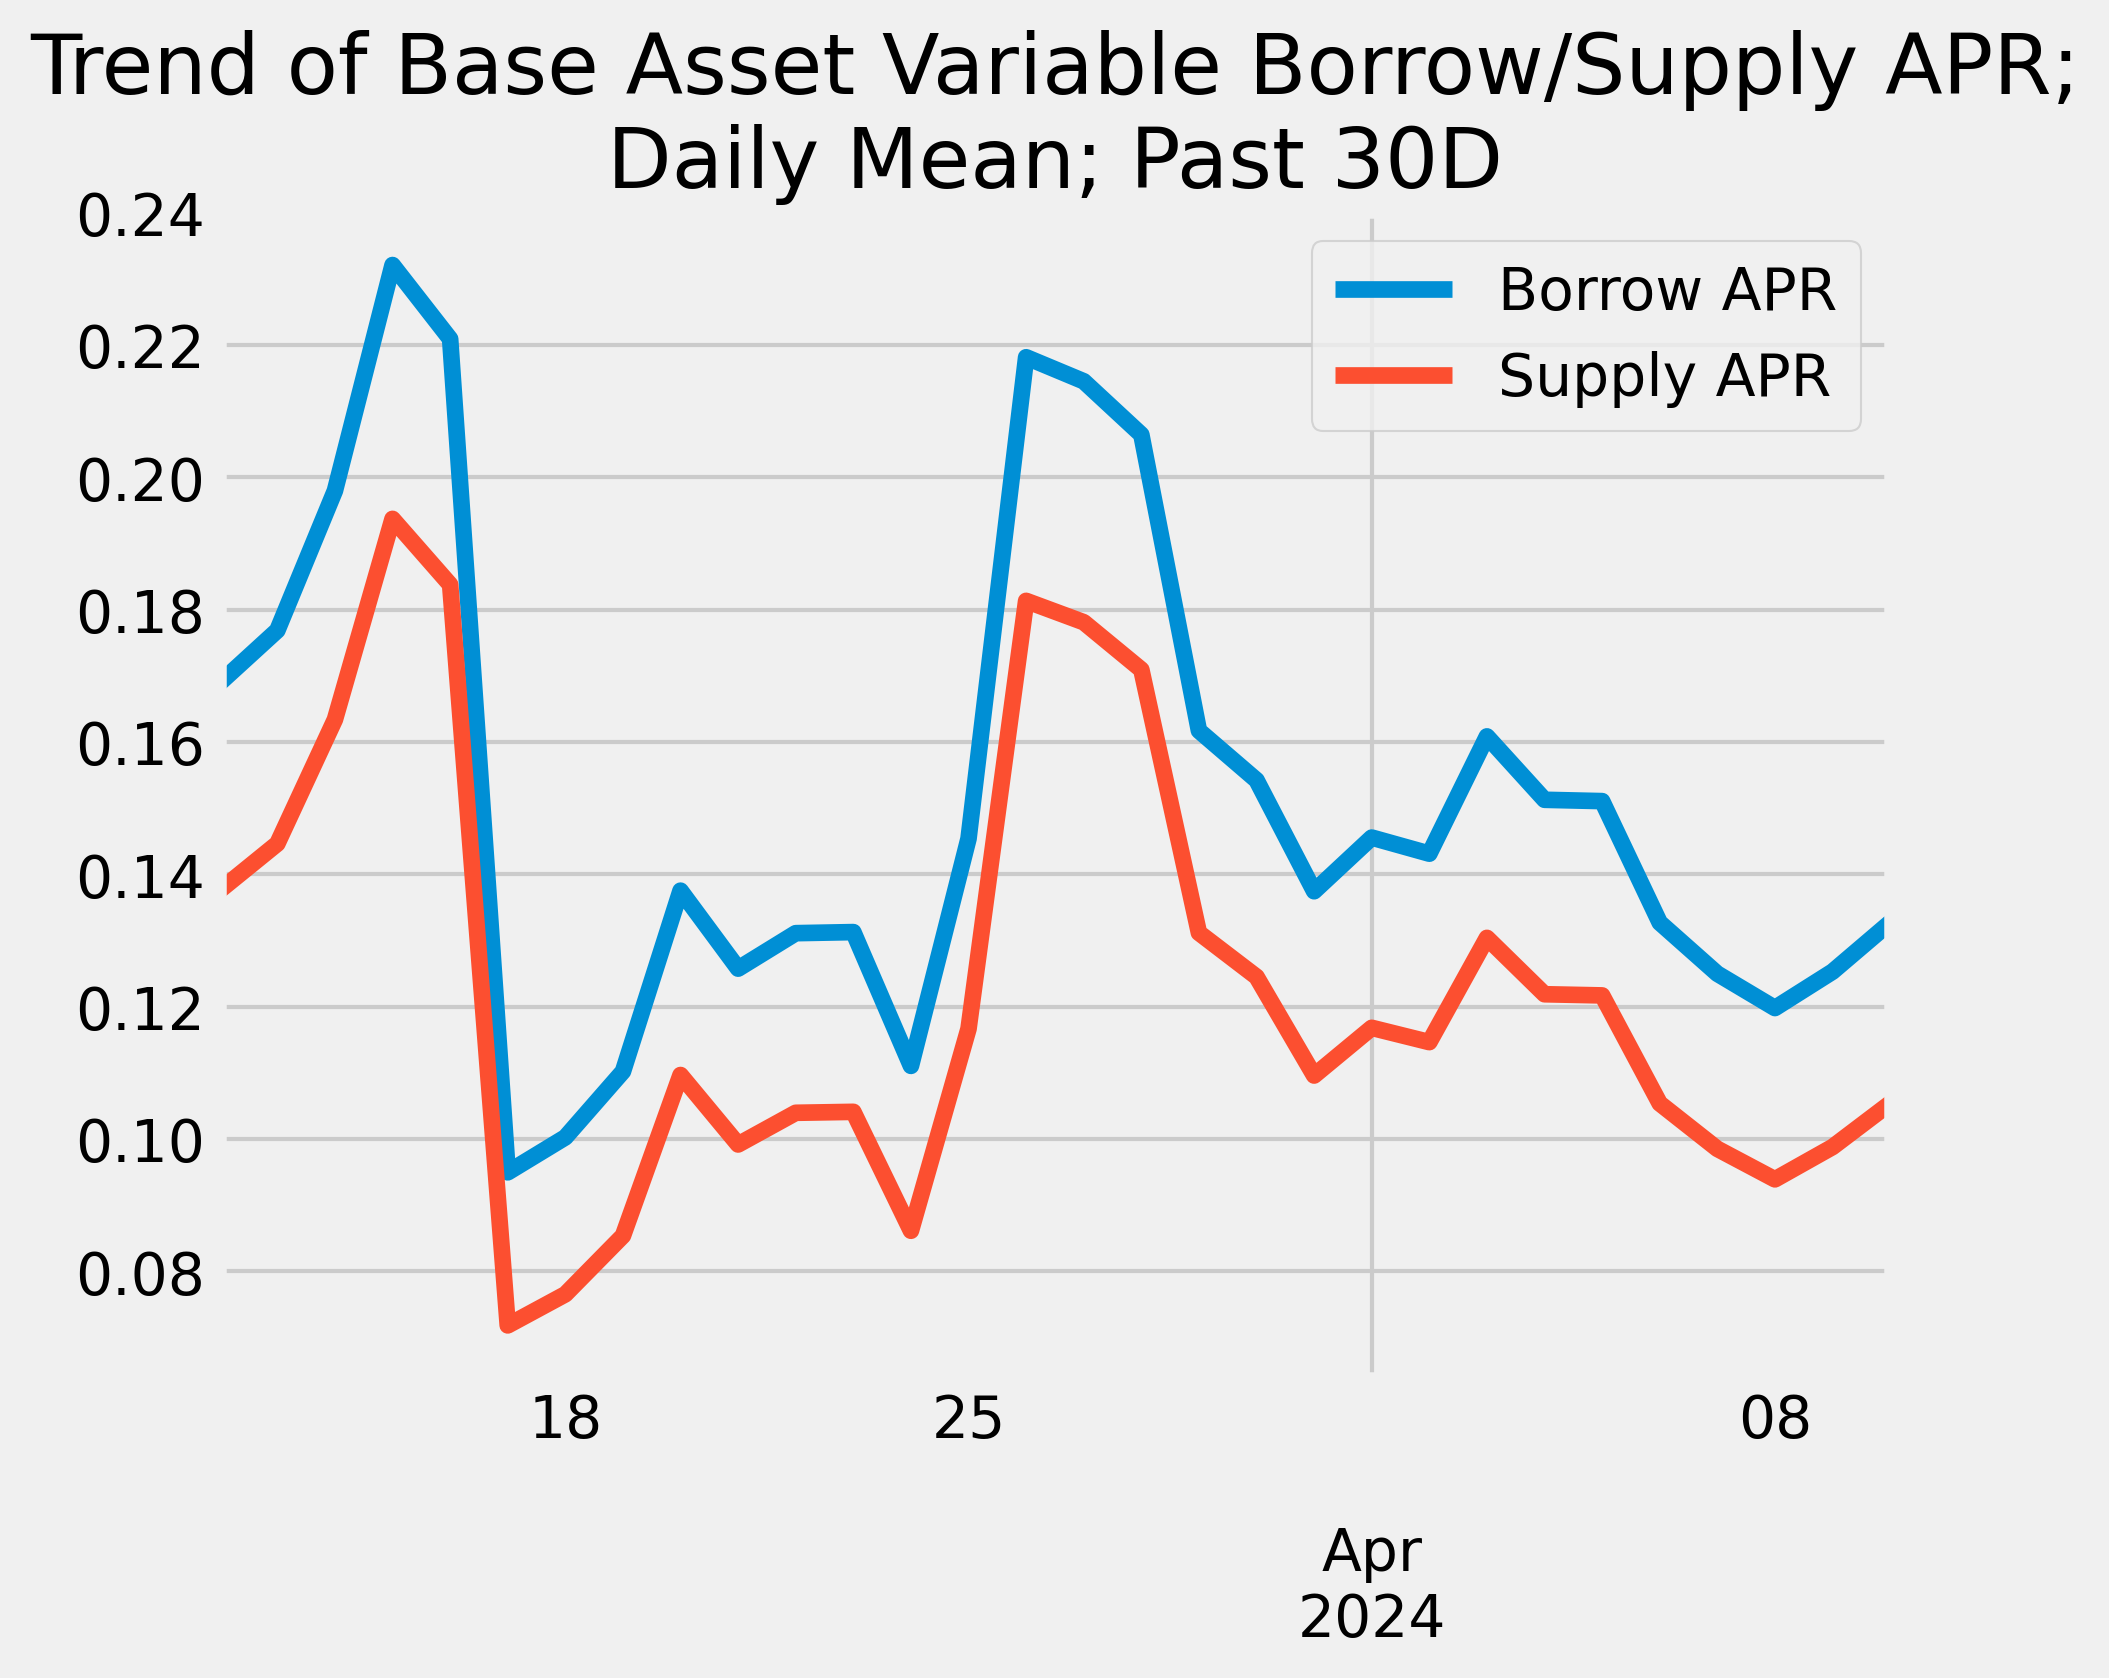
Base Asset APR Trend
COMP Rewards Analysis
| Chain |
CometRewards COMP token holdings |
Daily aggregate COMP token reward distributions |
Remaining days of rewards runway (not including existing claimable rewards) |
| Arbitrum |
3.19K |
25.00 |
127.40 |
Collateral Asset Supply
This graph shows the total supply of all collateral assets over the past week.
To see updated statistics, please see the live version of this graph here.
Base Asset Borrows
This graph shows the total borrows of the base asset over the past week.
To see updated statistics, please see the live version of this graph here.
Utilization
This graph shows the utilization (borrow / supply) of the base asset over the past week.
Supply Cap Usage
This graph shows the supply cap usage (supply / supply cap) of all collateral assets over the past week.
1 Like
[Gauntlet] Arbitrum USDC.e Comet Update: (2024-03-29 through 2024-04-04)
Gauntlet would like to provide the community with an update on the Arbitrum USDC.e comet over the past week. As the Arbitrum ecosystem is working to deprecate USDC.e, Gauntlet will not recommend any increases to GMX supply cap.
Simple Summary
-
USDC.e Borrows decreased 10.56%, from $4.03M to $3.60M.
-
USDC.e Supply decreased 10.03%, from $4.49M to $4.04M.
-
USDC.e utilization did not change, remaining at 89.78%.
-
The minimum USDC.e reserve growth was 10.52%, and the maximum was 18.14%. The average USDC.e reserve growth was 10.69%.
-
The comet accumulated $1.12K USDC.e reserves while distributing $0.00 COMP rewards for a weekly Net Protocol Profit of $1.12K.
Base Asset APR Trend
Reserve Analysis
COMP Rewards Analysis
| Chain |
CometRewards COMP token holdings |
Daily aggregate COMP token reward distributions |
Remaining days of rewards runway (not including existing claimable rewards) |
| Arbitrum |
3.09K |
25.00 |
123.70 |
Collateral Asset Supply
This graph shows the total supply of all collateral assets over the past week.
To see updated statistics, please see the live version of this graph here.
Base Asset Borrows
This graph shows the total borrows of the base asset over the past week.
To see updated statistics, please see the live version of this graph here.
Utilization
This graph shows the utilization (borrow / supply) of the base asset over the past week.
Supply Cap Usage
This graph shows the supply cap usage (supply / supply cap) of all collateral assets over the past week.
1 Like
[Gauntlet] Arbitrum USDC.e Comet Update: (2024-04-05 through 2024-04-11)
Gauntlet would like to provide the community with an update on the Arbitrum USDC.e comet over the past week.
Change in Weekly Update Schedule Announcement
In our continuous effort to enhance the communication and planning process within our community, we are pleased to announce an important change to our weekly update schedule. Effective immediately, the delivery of our weekly updates will transition from every Friday to every Monday. This adjustment will help us provide more comprehensive and timely information that includes the full spectrum of the past week’s events and updates, ensuring that all data is captured after the weekend.
The first update under this new schedule will be rolled out on Monday, April 22nd.
We appreciate your understanding and support as we implement this new schedule. As always, we are committed to keeping you informed and engaged with all the latest developments. If you have any questions or need further information, please do not hesitate to reach out to us.
Thank you for your continued partnership and trust in our efforts.
Simple Summary
-
USDC.e Borrows decreased 1.86%, from $3.60M to $3.54M.
-
USDC.e Supply decreased 1.41%, from $4.04M to $3.98M.
-
USDC.e utilization did not change, remaining at 89.25%.
-
The minimum USDC.e reserve growth was 10.52%, and the maximum was 19.79%. The average USDC.e reserve growth was 11.07%.
-
The comet accumulated $982.62 USDC.e reserves while distributing $0.00 COMP rewards for a weekly Net Protocol Profit of $982.62.
Base Asset APR Trend
Reserve Analysis
COMP Rewards Analysis
| Chain |
CometRewards COMP token holdings |
Daily aggregate COMP token reward distributions |
Remaining days of rewards runway (not including existing claimable rewards) |
| Arbitrum |
2.82K |
25.00 |
113.00 |
Collateral Asset Supply
This graph shows the total supply of all collateral assets over the past week.
To see updated statistics, please see the live version of this graph here.
Base Asset Borrows
This graph shows the total borrows of the base asset over the past week.
To see updated statistics, please see the live version of this graph here.
Utilization
This graph shows the utilization (borrow / supply) of the base asset over the past week.
Supply Cap Usage
This graph shows the supply cap usage (supply / supply cap) of all collateral assets over the past week.
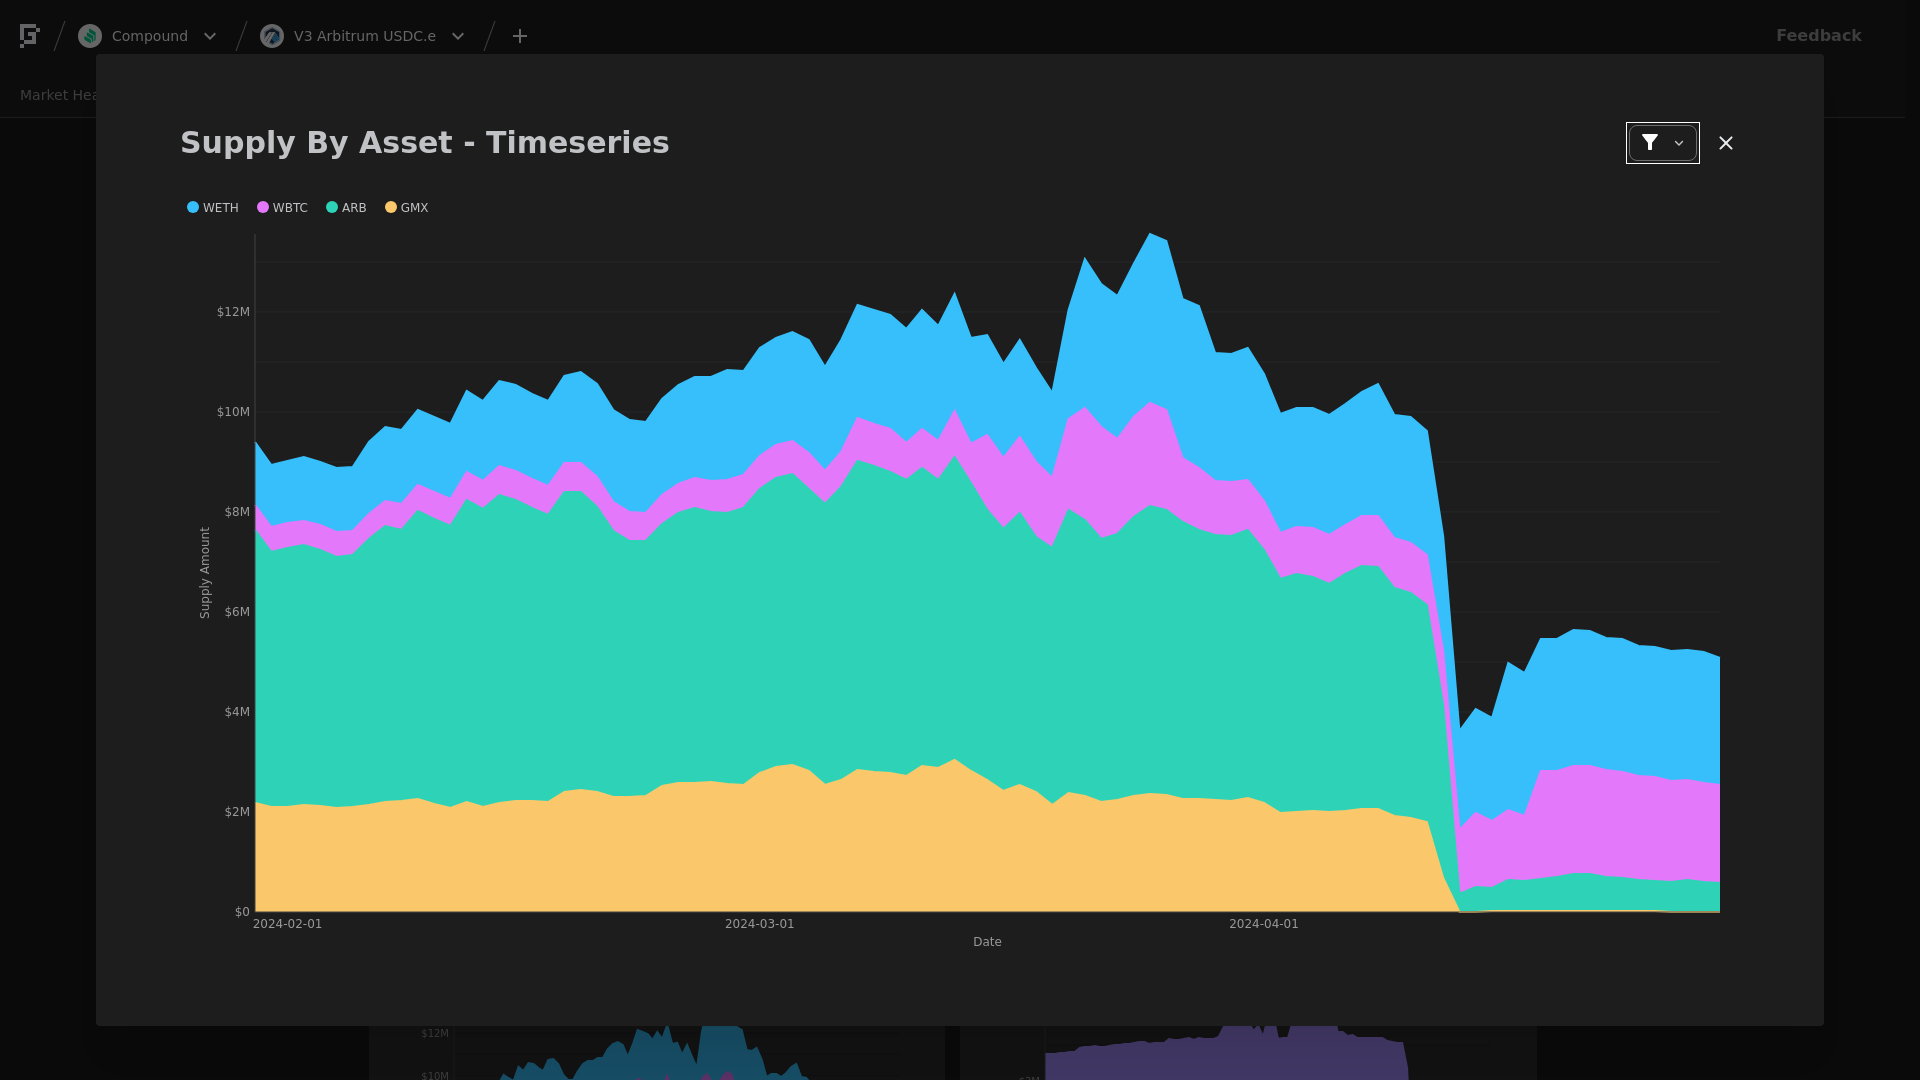
[Gauntlet] Arbitrum USDC.e Comet Update: (2024-04-15 through 2024-04-21)
Gauntlet would like to provide the community with an update on the Arbitrum USDC.e comet over the past week.
Simple Summary
-
USDC.e Borrows increased 59.29%, from $1.62M to $2.58M.
-
USDC.e Supply decreased 24.80%, from $3.90M to $2.93M.
-
USDC.e utilization increased 111.82%, from 41.62% to 88.16%.
-
The minimum USDC.e reserve growth was -29.52%, and the maximum was 19.98%. The average USDC.e reserve growth was 3.43%.
-
The comet accumulated $242.71 USDC.e reserves while distributing $0.00 COMP rewards for a weekly Net Protocol Profit of $242.71.
Base Asset APR Trend
Reserve Analysis
COMP Rewards Analysis
| Chain |
CometRewards COMP token holdings |
Daily aggregate COMP token reward distributions |
Remaining days of rewards runway (not including existing claimable rewards) |
| Arbitrum |
2.28K |
25.00 |
91.00 |
Collateral Asset Supply
This graph shows the total supply of all collateral assets over the past week.
To see updated statistics, please see the live version of this graph here.
Base Asset Borrows
This graph shows the total borrows of the base asset over the past week.
To see updated statistics, please see the live version of this graph here.
Utilization
This graph shows the utilization (borrow / supply) of the base asset over the past week.
Supply Cap Usage
This graph shows the supply cap usage (supply / supply cap) of all collateral assets over the past week.
[Gauntlet] Arbitrum USDC.e Comet Update: (2024-04-22 through 2024-04-28)
Gauntlet would like to provide the community with an update on the Arbitrum USDC.e comet over the past week. We have reviewed the markets and no IR adjustments are necessary at this time.
Simple Summary
-
USDC.e Borrows decreased 7.93%, from $2.58M to $2.38M.
-
USDC.e Supply decreased 5.14%, from $2.93M to $2.78M.
-
USDC.e utilization decreased 2.94%, from 88.16% to 85.57%.
-
The minimum USDC.e reserve growth was 10.99%, and the maximum was 19.59%. The average USDC.e reserve growth was 14.63%.
-
The comet accumulated $503.55 USDC.e reserves while distributing $0.00 COMP rewards for a weekly Net Protocol Profit of $503.55.
Base Asset APR Trend
Reserve Analysis
COMP Rewards Analysis
| Chain |
CometRewards COMP token holdings |
Daily aggregate COMP token reward distributions |
Remaining days of rewards runway (not including existing claimable rewards) |
| Arbitrum |
2.21K |
25.00 |
88.40 |
Collateral Asset Supply
This graph shows the total supply of all collateral assets over the past week.
To see updated statistics, please see the live version of this graph here.
Base Asset Borrows
This graph shows the total borrows of the base asset over the past week.
To see updated statistics, please see the live version of this graph here.
Utilization
This graph shows the utilization (borrow / supply) of the base asset over the past week.
Supply Cap Usage
This graph shows the supply cap usage (supply / supply cap) of all collateral assets over the past week.